Chainlink, Tezos, Helium Price Analysis: 05 January

While Bitcoin still struggled to cross the $47,000-mark, Ethereum managed to breach the $3,766-level.
Chainlink and Helium mark exponential gains and reclaim their lost supports. Also, Tezos saw an up-channel trajectory but faced resistance at the golden Fibonacci level.
Chainlink (LINK)
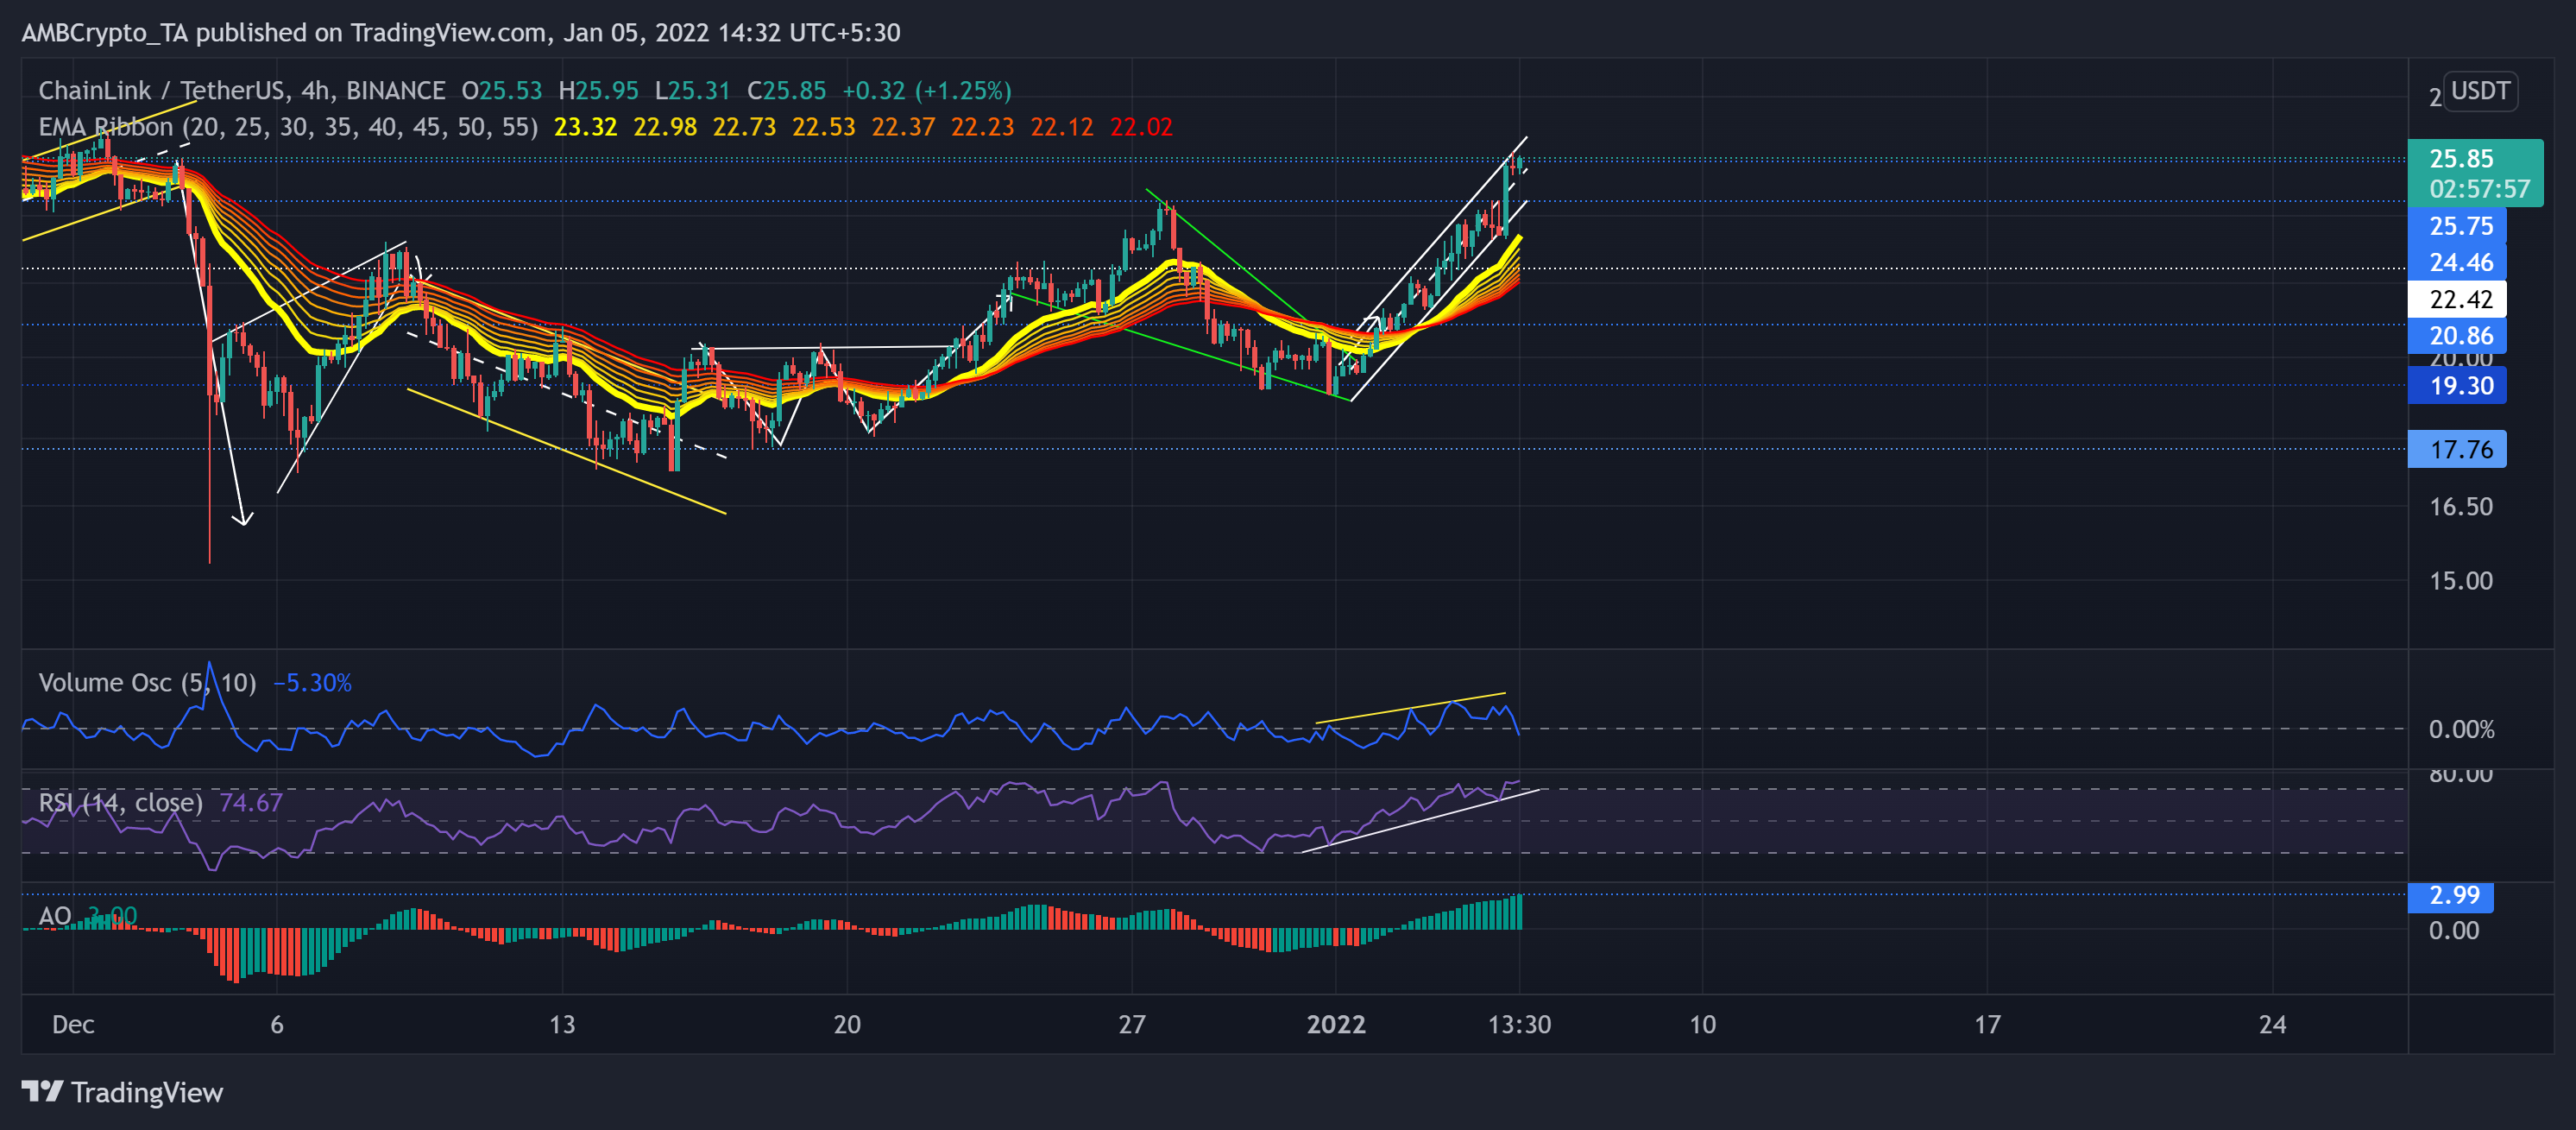
Since the up-channel (yellow) breakdown on 3 December, LINK bulls retested the $22.42-level four times over the past month. They finally propelled a sustained breach over the last two days after the salt saw a falling wedge (green) breakout.
On its 4-hour chart, LINK formed an ascending channel (white) and noted a 33.95% ROI (from 1 January low). However, the alt saw resistance at the $25.75-mark for the past 40 days. This level also coincided with the upper trendline of the channel.
The volume Oscillator marked higher peaks, indicating a healthy rally over the past few days.
At press time, LINK traded at $25.85. The EMA ribbons yet again saw a bullish flip. Further, the AO rose to its 11-week high on 5 January, hinting at a sweeping bullish vigor. The RSI wavered into the overbought region after showing no slowing signs. Even so, the overbought RSI threat should not be discarded for a possible near-term correction.
Tezos (XTZ)
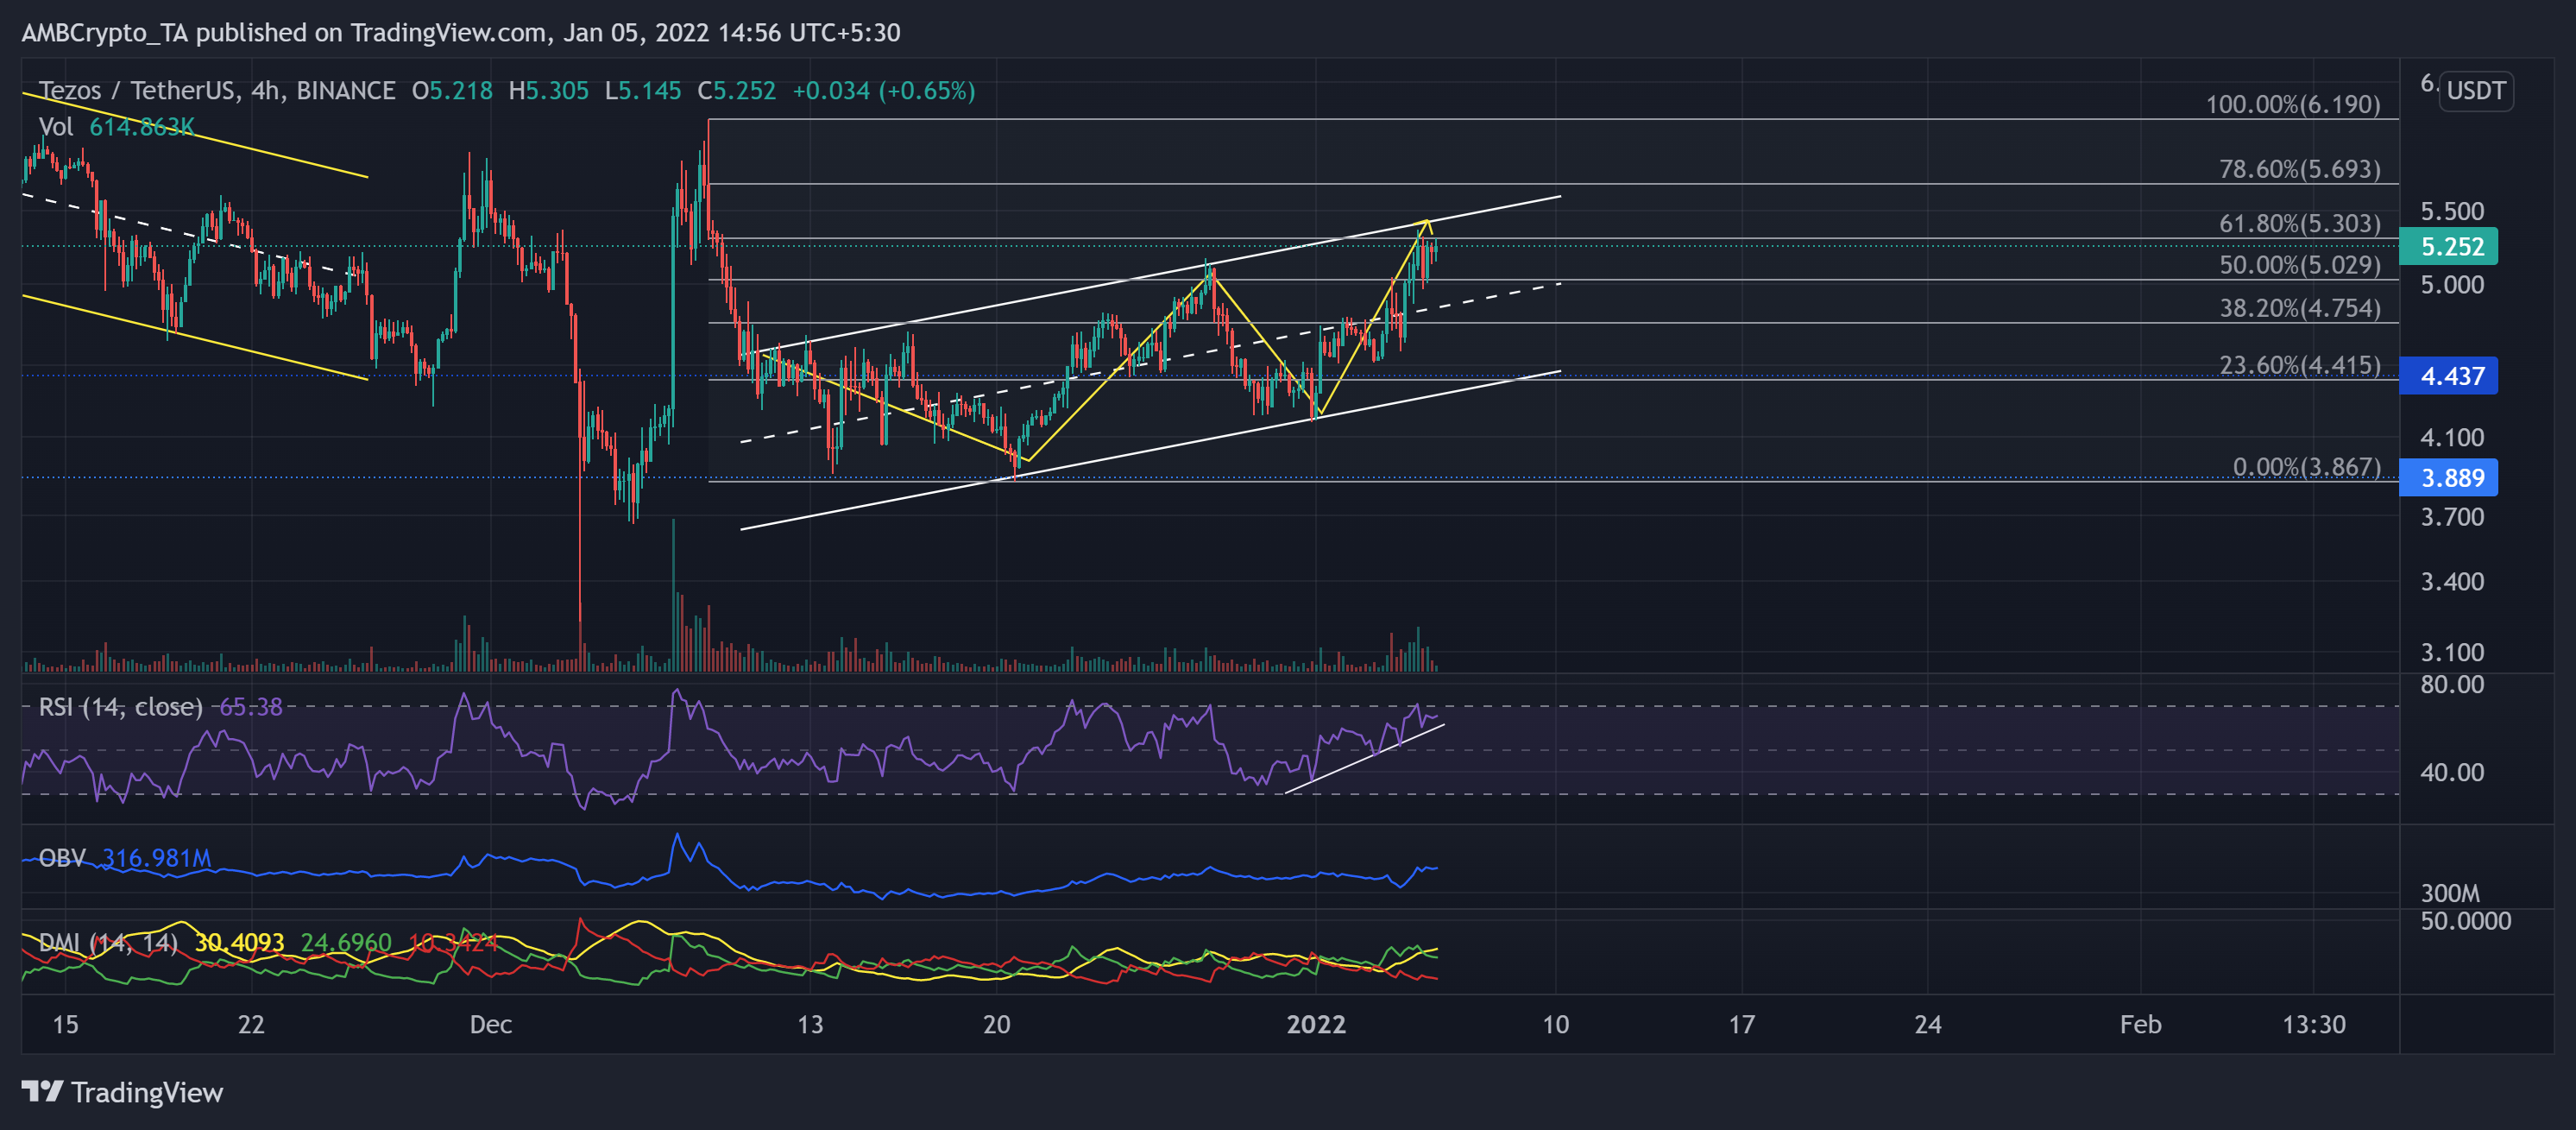
XTZ was on a constant downfall after striking its ATH on 4 October. Since then, The alt lost over 64% of its value until it poked its 15-week low on 4 December. The price diligently withdrew as it moved along the descending channel (yellow).
As XTZ bulls ensured the four-month support at the $3.8-mark, the price action entered into a recovery phase. As it marked an up-channel (white), the alt breached multiple resistance until the 61.8% Fibonacci level.
At press time, XTZ traded at $5.252. The RSI saw a steep surge as it moved above the 65-level. Further, the OBV and the DMI corresponded with the increased bullish vigor.
Helium (HNT)
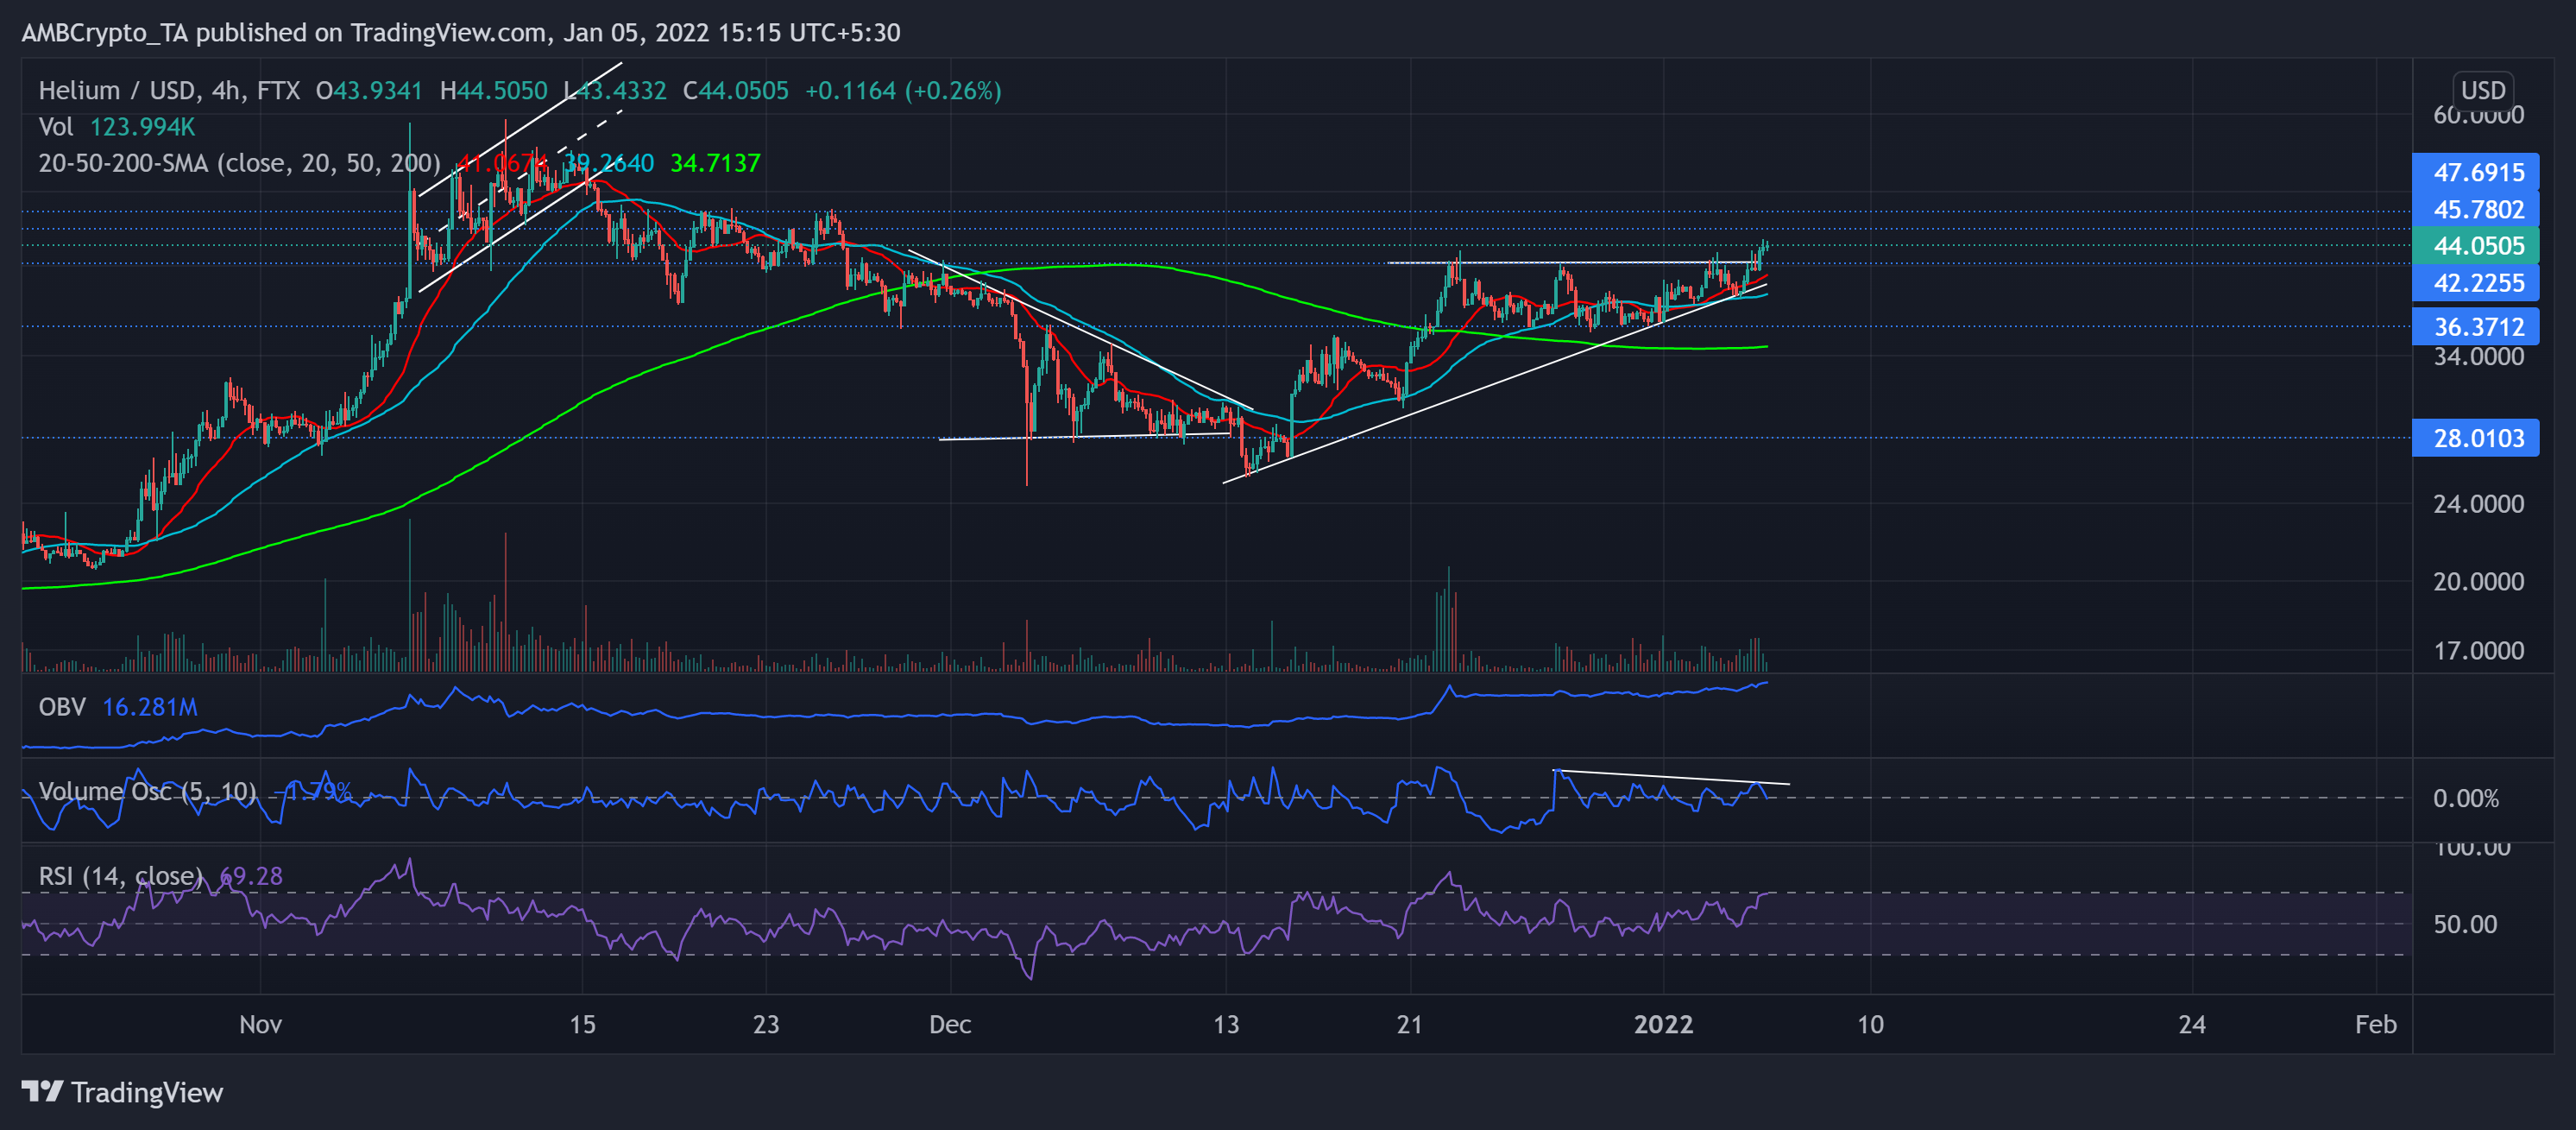
The alt saw a solid 74.96% recovery (from 13 December low) as it poked its 40-day high on 05 January. It consistently marked higher troughs while maintaining the $42-mark resistance for its previous peaks. This trajectory depicted a strong bullish force while the 20-SMA (red) crossed the 50-200 SMA.
Now the immediate testing point for the bulls stood at the $45-level. Now, the OBV undeniably projected an increased buying pressure. However, the Volume Oscillator failed to mark higher peaks.
At press time, HNT traded at $44.0505. The RSI tested the overbought region after a 21 point surge over the past day.