Chainlink: This pattern can shape LINK’s near-term trajectory

Disclaimer: The findings of the following analysis are the sole opinions of the writer and should not be considered investment advice.LINK
After sailing within the bounds of a side-channel for nearly three weeks, Chainlink’s [LINK] breakout was quick to register an up-channel (yellow) breakdown. This fall pierced through some critical price levels and found fresher multi-yearly lows.
Given the current market dynamics, the recent bearish engulfing candlestick could propel bearish tendencies in the near term. At press time, LINK was trading at $6.09.
LINK 4-hour Chart
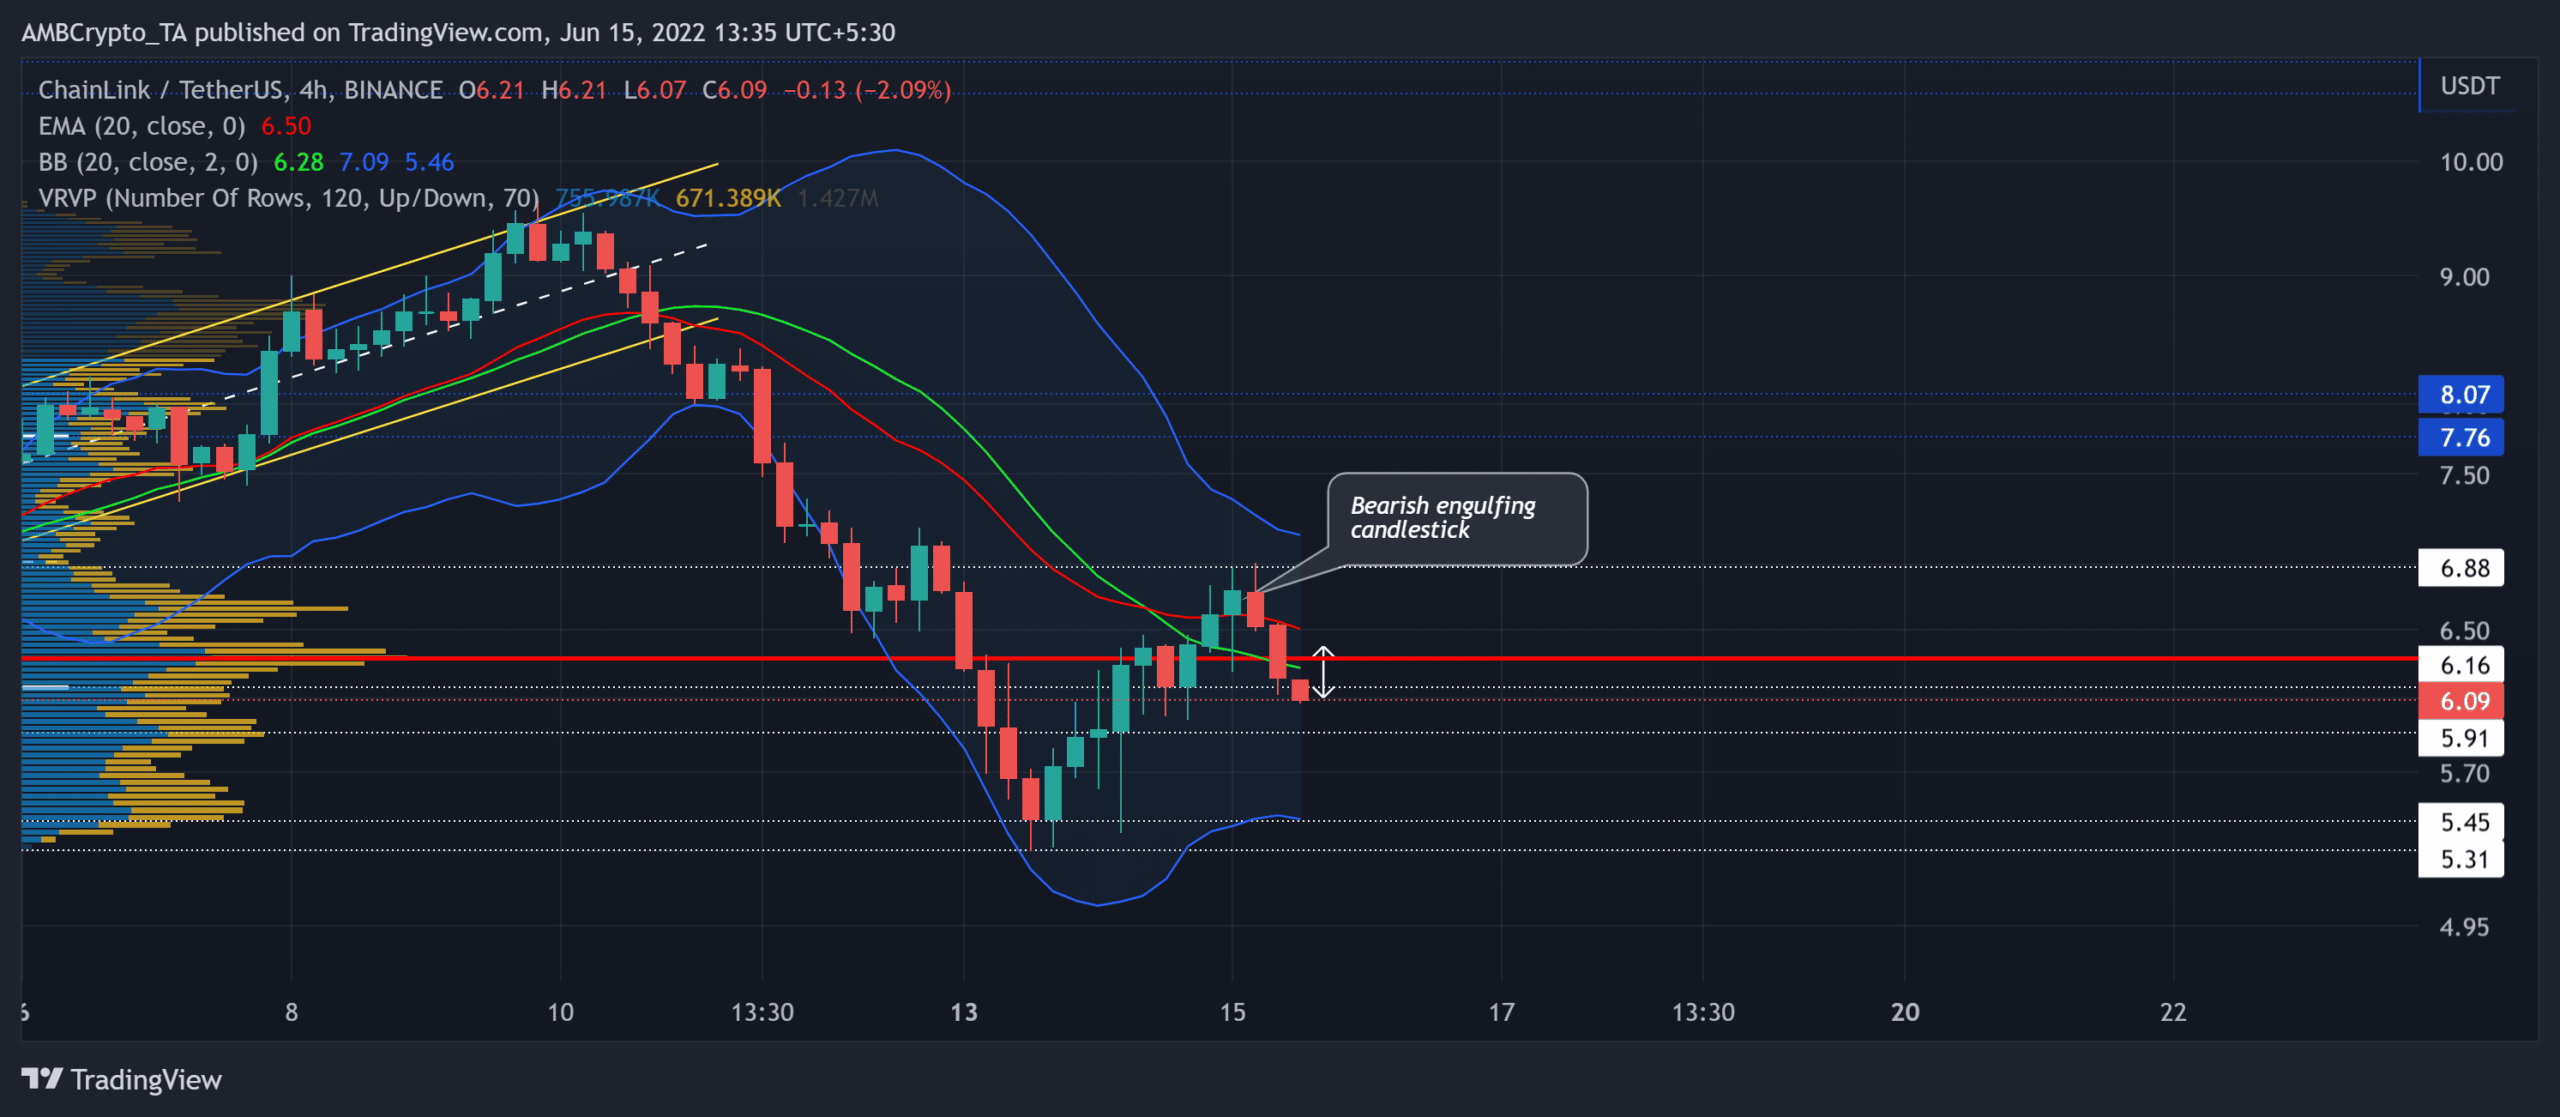
The buyers upheld the $6.16-level for over 23 months. However, the bulls failed to defend this level as the bears went to great lengths during recent liquidations. The sellers pulled off a 43.7% drop from 10-13 June.
After dragging the alt to its two-year low on 13 June, the buyers finally found a recouping zone at the $5.45-mark. The bullish engulfing candlestick invoked the recent gains while marking the end of the red candle streaks.
With a bearish engulfing candlestick near the $6.88-resistance, the selling pressure seems to have renewed. A sustained fall below the basis line (green) of the Bollinger Bands (BB) could position LINK to a potential downside toward the $5.45-level before any bounce-back possibilities. Also, the fall below the Point of Control (POC, red) could propel an extended fall.
Rationale
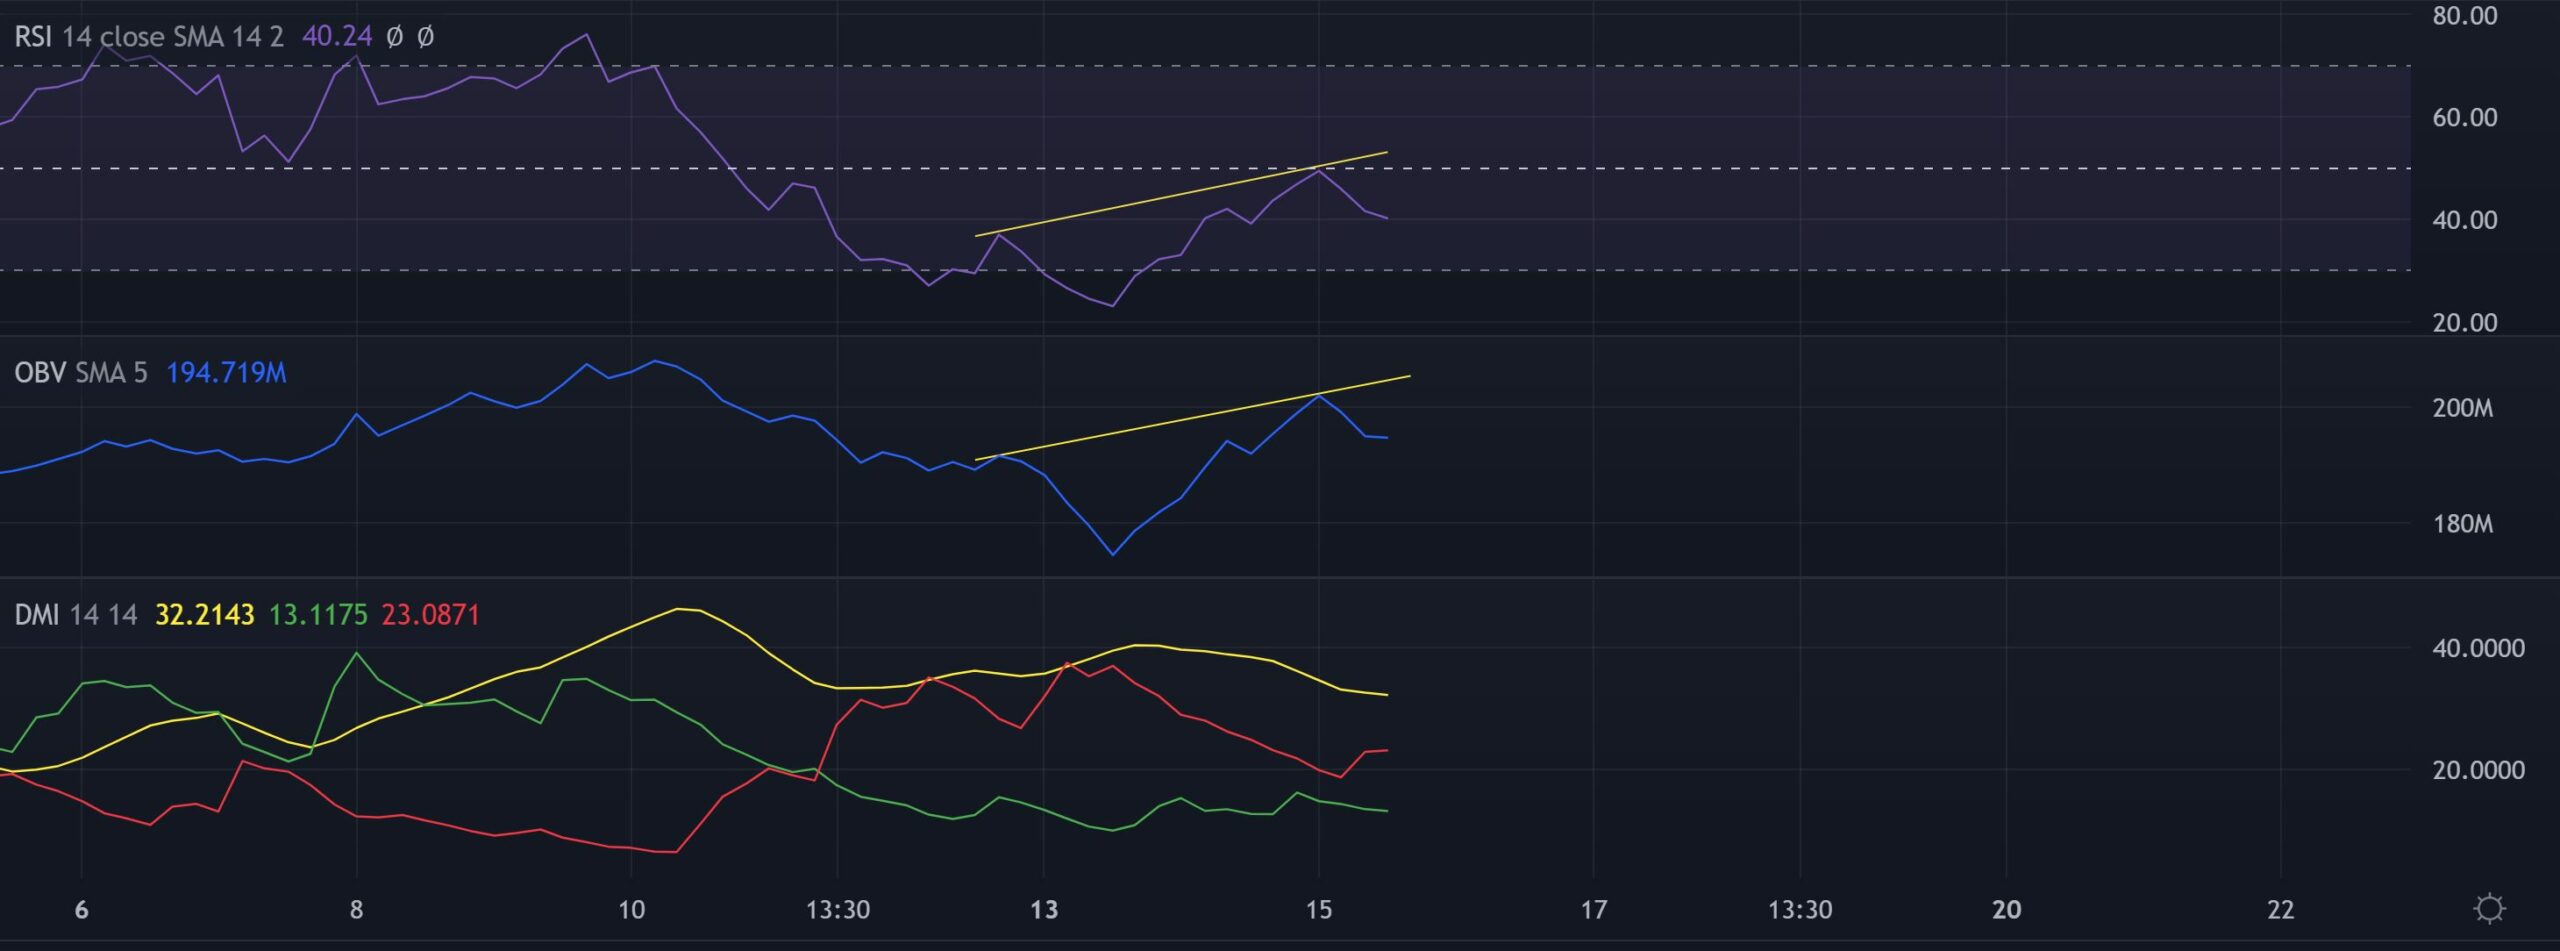
The Relative Strength Index (RSI) failed to breach the boundaries of its equilibrium for the last five days. After its recent bearish divergence with the price, it has depicted a bearish bias.
Also, the OBV did commensurate with the RSI’s outlook by bearishly diverging with the price. Furthermore, sellers have reaffirmed their strength in the current structure while the -DI refrained from a bullish crossover.
Conclusion
In light of the bearish engulfing candlestick inflicting a close below the 20 EMA (red), the basis line of BB, and the POC, LINK could see a near-term bearish cycle toward the $5.4-$5.7 range. Any bearish invalidations could see a relatively sluggish phase near the POC zone.
However, an overall market sentiment analysis becomes vital to complement the technical factors to make a profitable move.


