Chainlink, Waves, Dash Price Analysis: 15 May

Chainlink’s target of $50 would see a shift of market control over to the bullish side. Waves might present a stronger buy signal above $37.2. Finally, bearish conditions still presided over the Dash market, but the crypto’s candlesticks were well above the long-term moving average.
Chainlink [LINK]

Chainlink found support around the $41-mark – a region that was bolstered by the 200-SMA (green). Buyers even reclaimed the region above the $45.6-resistance level, at the time of writing, but some additional resistance lay in the form of the 50-SMA (yellow). If LINK manages to breach its next target at $50, another ATH could be on the cards.
The Squeeze Momentum Indicator rose above the half-line and a series of white dotted markers would indicate a “squeeze release.” If so, the rise in volatility would likely be followed by a price hike over the next few sessions. The MACD showed that the market was tilted in favor of the buyers after a hike above $45.6. However, the index was yet to recover above its equilibrium level.
Waves [WAVES]
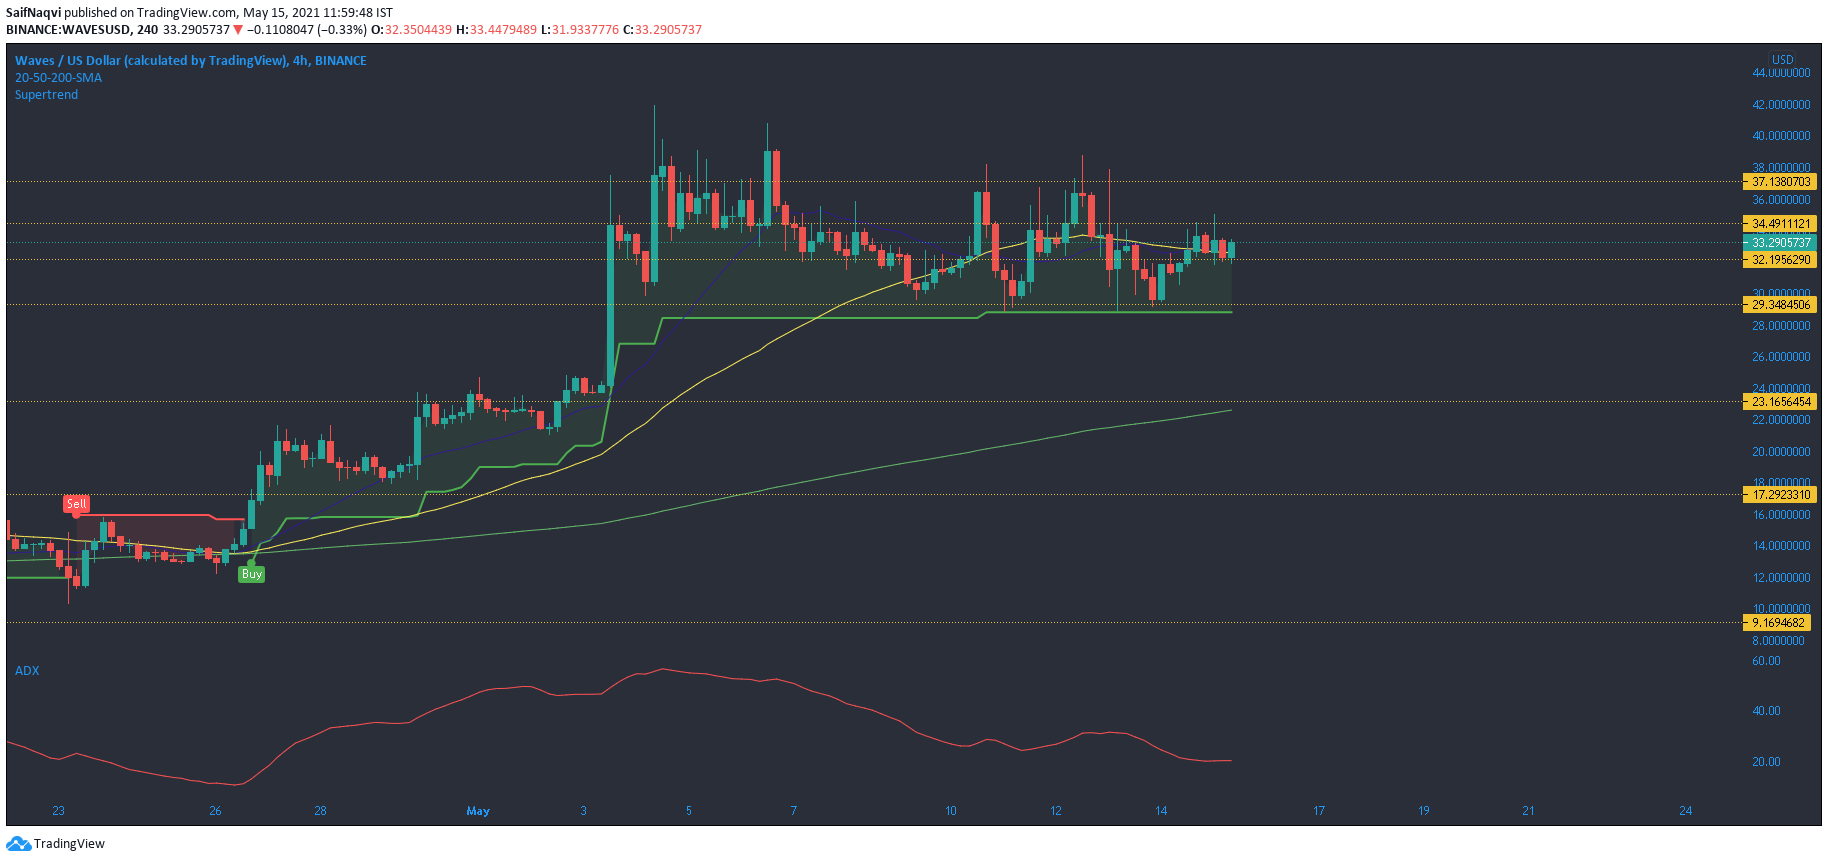
While the last few days noted some choppy movement in the Waves market, maintaining the $29.3-29.9 support was in fact a bullish development. This area also established itself as a reliable support line after countering multiple breakdown attempts during the most recent pullbacks. A move below the aforementioned level could have triggered a 20% retracement towards the 200-SMA (green).
Preserving key levels on its 4-hour chart allowed for a recovery above the 20-SMA and 50-SMA. However, the $37.2-resistance needs to be toppled for bullish control. The SuperTrend Indicator did flash a buy signal, but a safer bet would be to enter a trade above $37.2.
A stop-loss was placed at $28.8. ADX was slightly below 25, underlining the lack of a strong trend. Weak 24-hour trading volumes moving forward could point to some consolidation before the next upswing.
Dash [DASH]
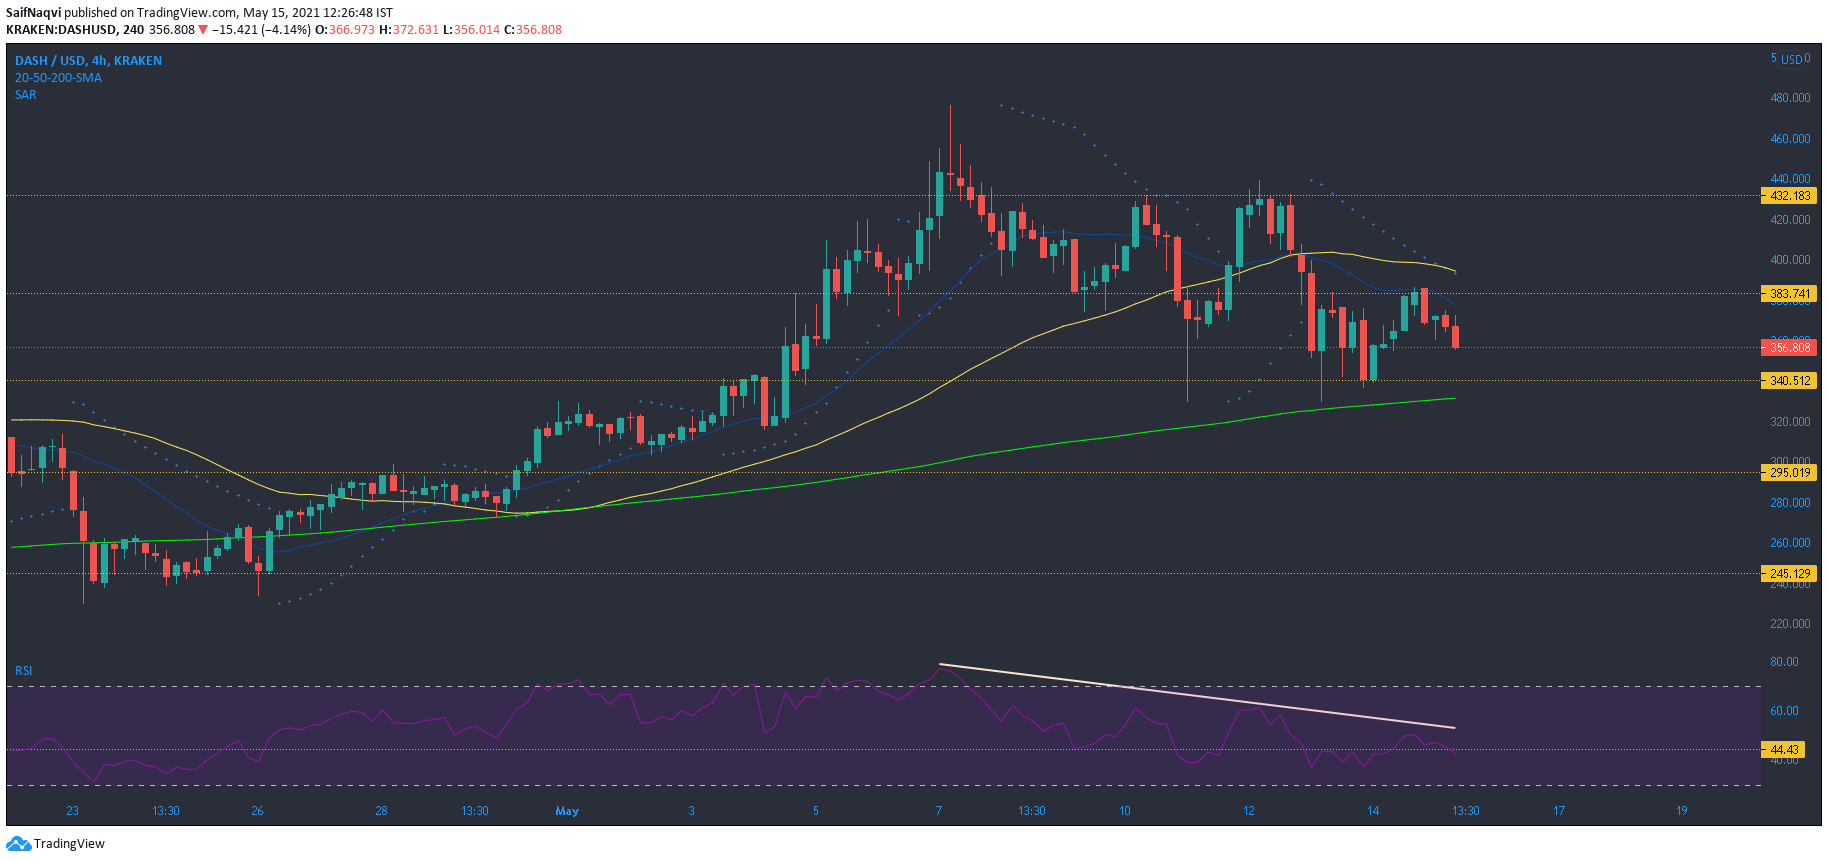
The past week has been rough for Dash. Weekly losses amounted to 12% and the candlesticks slipped below the key support level at $383.7. The market bulls have attempted comebacks, but have failed to trigger a move above the $432.1-resistance. Nevertheless, DASH was above its long-term moving (200-SMA) and an extended sell-off would be avoided as long as $340.5-$330 support is maintained.
The RSI made lower highs and confirmed weakness in the market after DASH’s local top. The Parabolic SAR’s dotted markers moved below the candlesticks and highlighted a downtrend after DASH’s failed attempt to rise above $432.1.


