


- Chainlink noted a network-wide accumulation.
- The selling pressure has not been strong, but bulls were not ready for a breakout either.
Chainlink [LINK] has traded within a range over the past two months. This range extended from $13.3 to $16.6. The range highs have served as an insurmountable barrier thus far. However, the bulls can have realistic expectations that LINK will reach $20.
A recent post on X by Ali revealed that the $14.8-$15.2 was a sturdy demand zone for LINK. Using data from IntoTheBlock, he noted that 85.13 million LINK were bought in this zone.
#Chainlink has built a solid demand zone between $14.8 and $15.2, where 17,650 addresses bought 85.12 million $LINK. With the lack of resistance ahead, #LINK could be positioned to advance toward $20. pic.twitter.com/jJwfVbM4eE
— Ali Charts (@alicharts) January 15, 2024
He also observed that the resistance overhead was weak. Yet, with such a large proportion of holders in profit, is another LINK rally feasible?
Selling pressure behind LINK is weak and HODLer sentiment is strong
AMBCrypto’s analysis of Santiment data showed that there was a network-wide accumulation of LINK in progress. The mean coin age metric has been trending upward since 15th December.
Meanwhile, the dormant circulation saw few notable spikes in the past two weeks.
This pointed toward a lack of selling pressure and a tendency to hold LINK from investors. The weighted market sentiment has swayed from positive to negative and did not sustain bullishly as it did back in September.
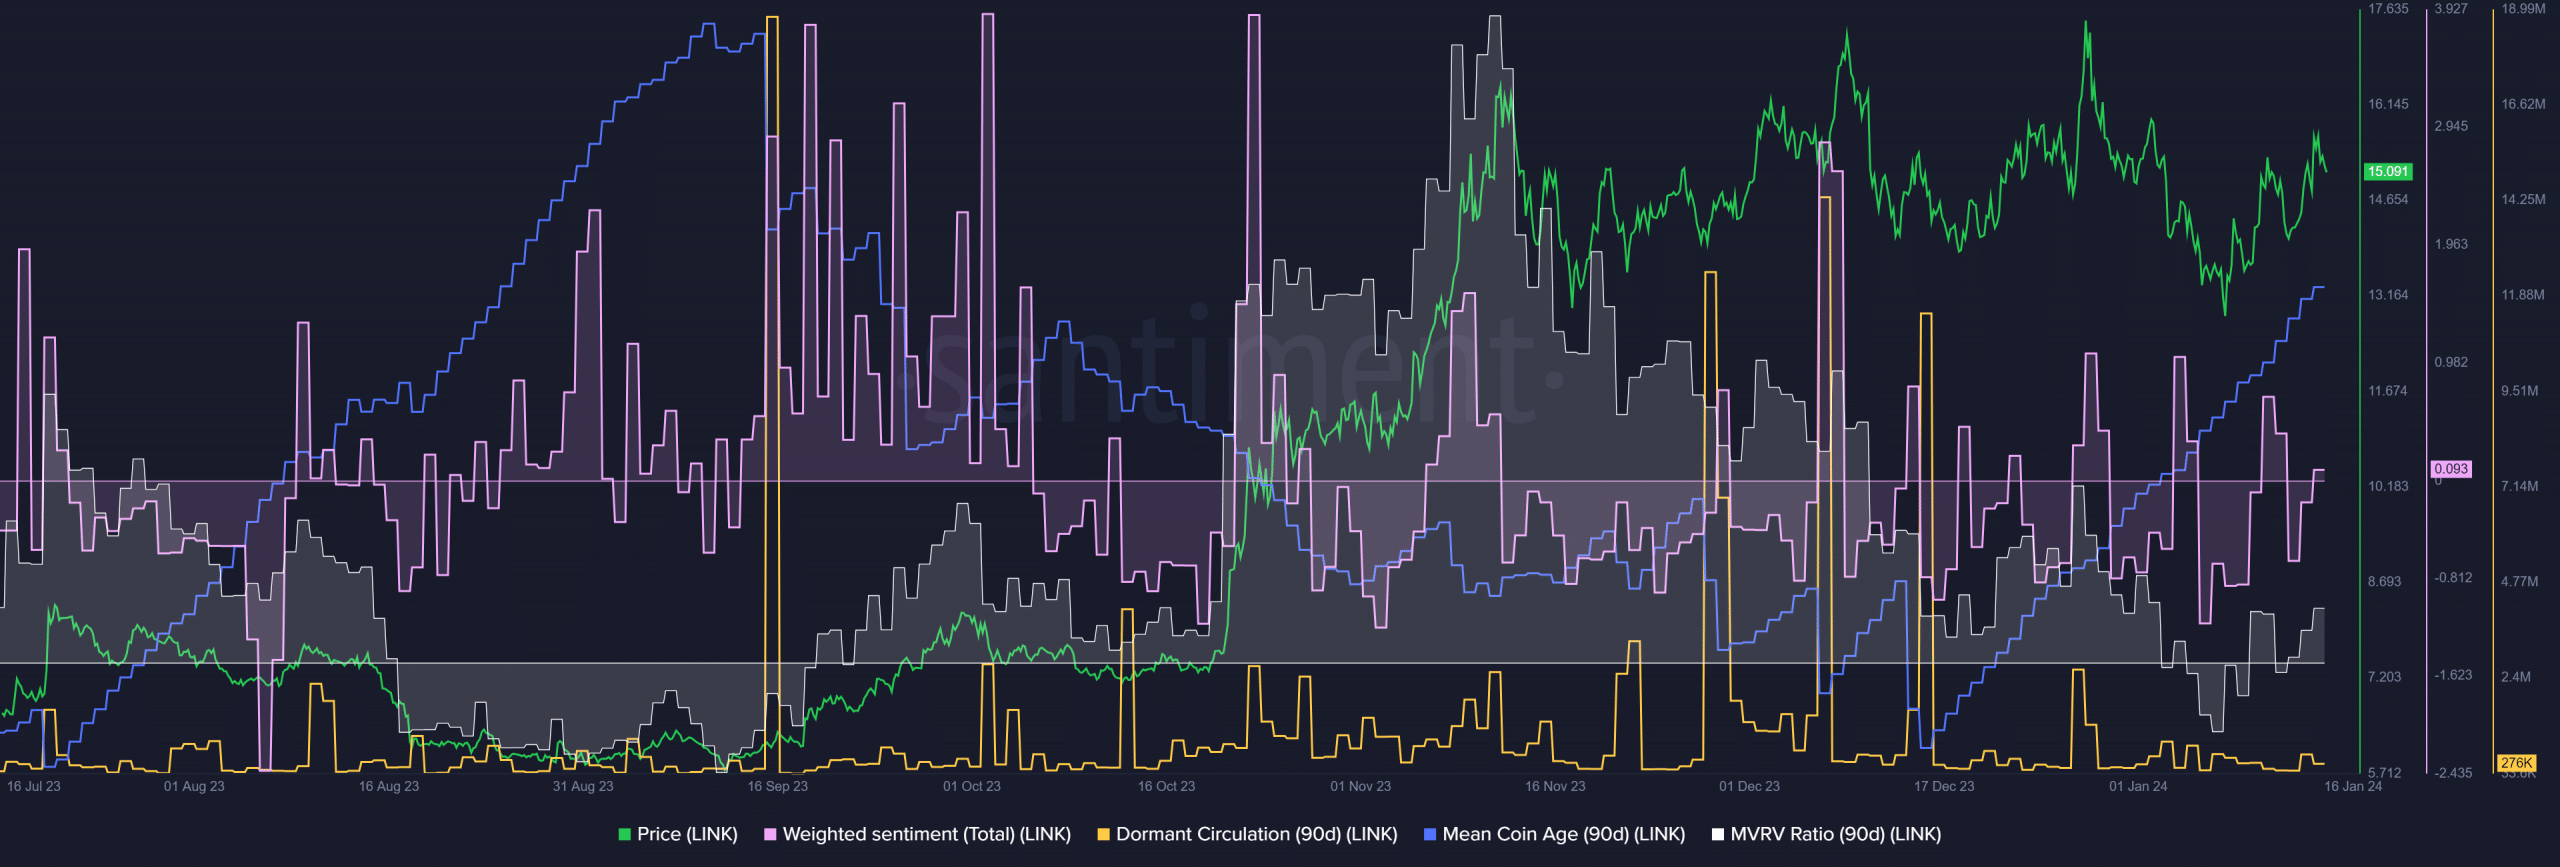
The MVRV ratio trended downward since mid-November. It stood just above zero at press time. This suggested that the token was not overvalued. Combined with the accumulation tendency, the inference was that LINK likely has room to rally.
A look at the supply distribution showed that whales were accumulating. Addresses with 1 million or more LINK jumped higher on 7th December while the 10-1 million LINK holder count dropped.
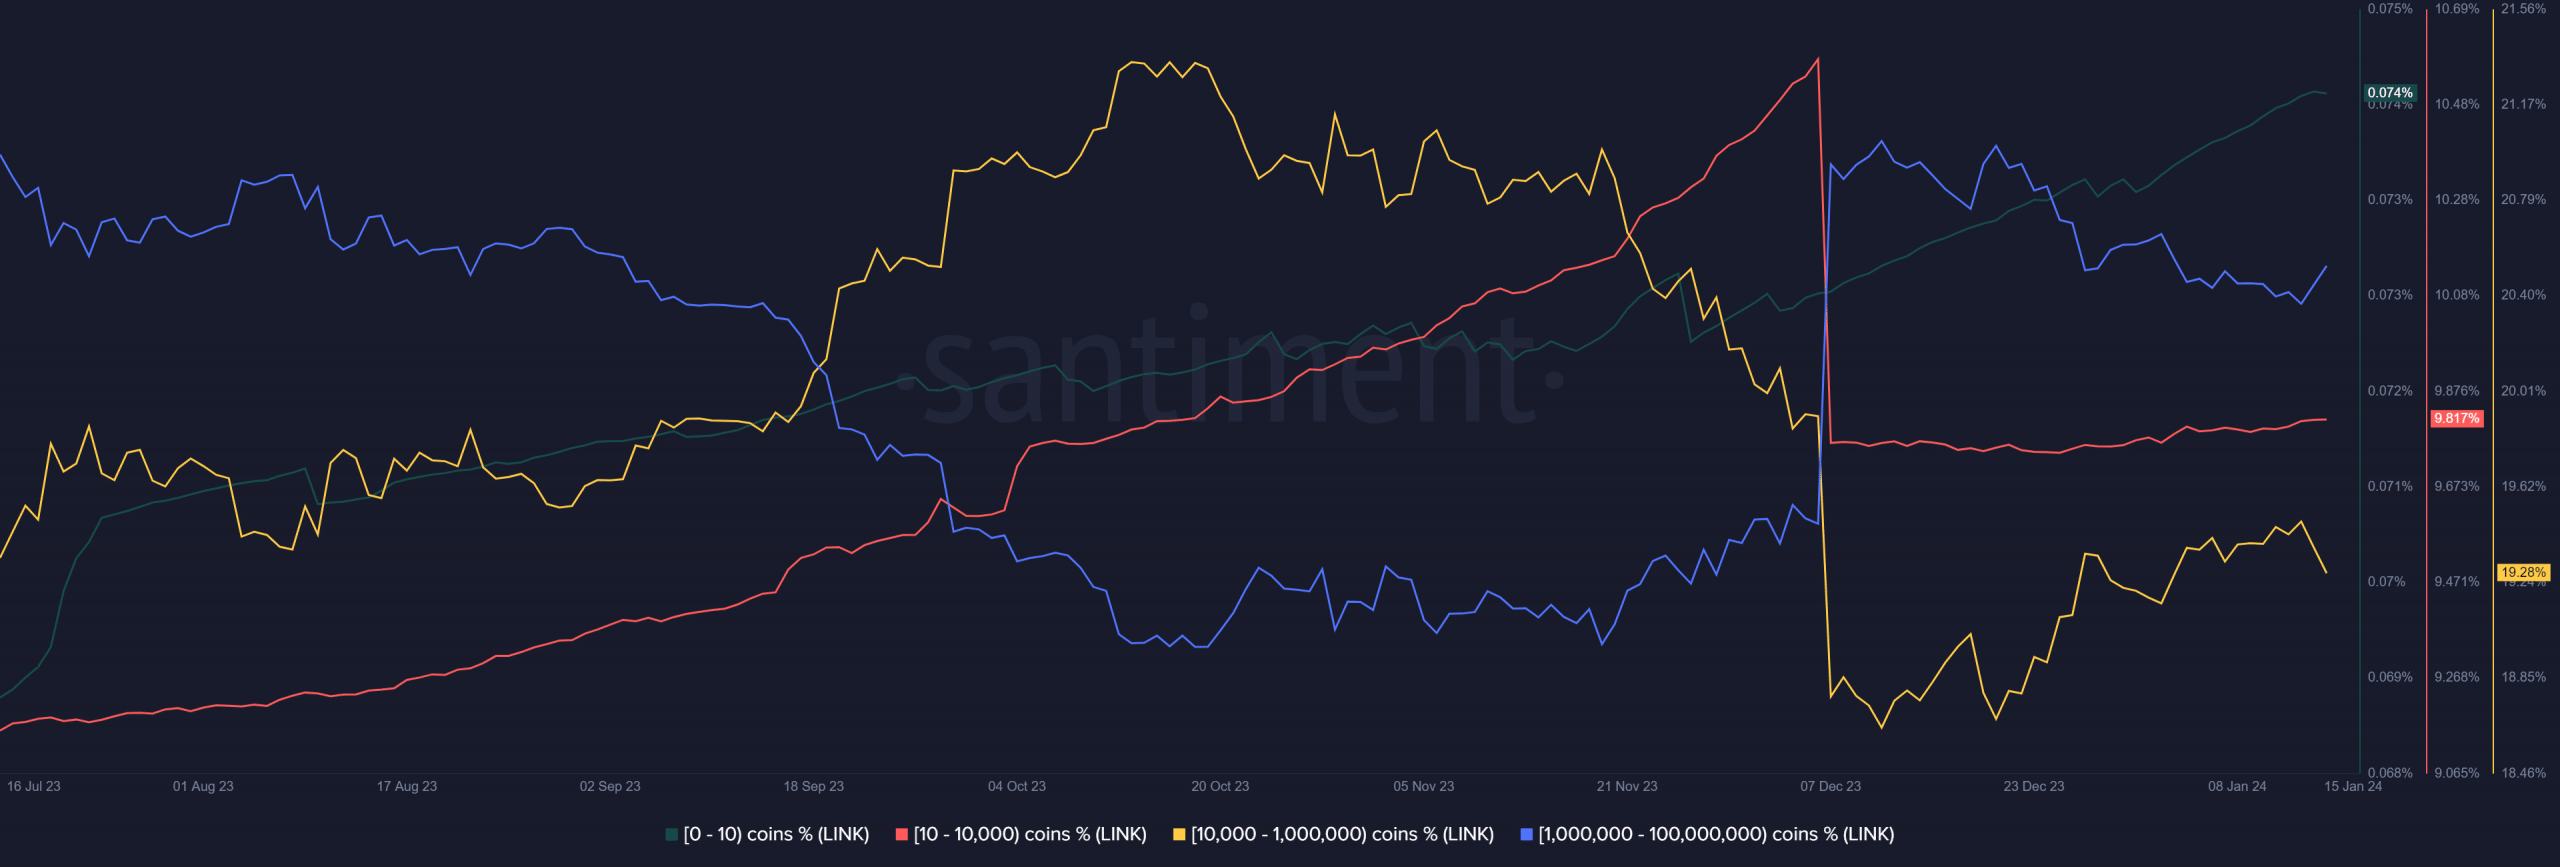
This suggested that many holders sold at a profit. But even before this event, this bracket of addresses had trended lower, suggesting some selling activity.
After the 7th of December, their holdings increased as a percentage, which meant that they had begun to accumulate once more.
On the other hand, addresses with 0-10 LINK marched steadily higher without much regard for the price trend. The whale holdings have begun to fall slightly over the past month, which was a slight concern. Overall, the argument for accumulation held merit.
The importance of the $15 level
Technical analysis of LINK showed that the aforementioned range’s (purple) mid-point stood at $15. This was also a higher timeframe level of importance. In the past two months, it has served as both support and resistance.
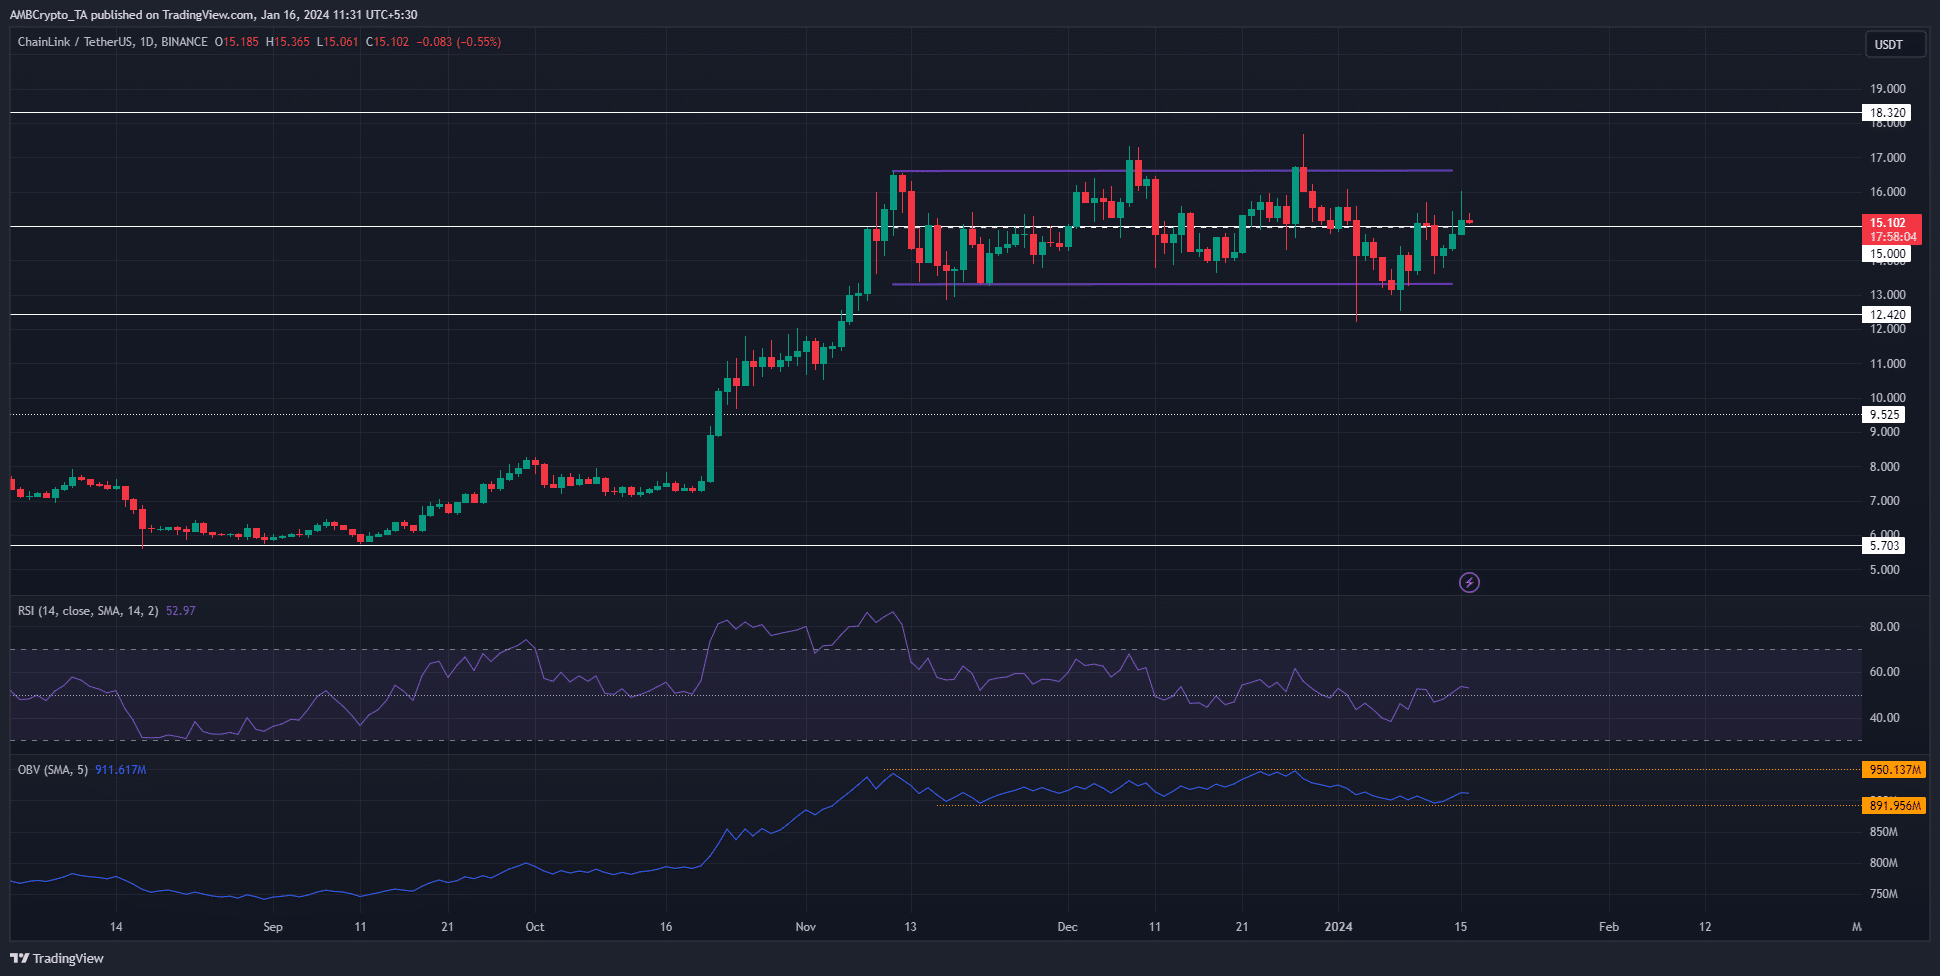
The market structure has oscillated from bearish to bullish due to the rangebound price action. The RSI stood at 53 on the one-day chart, which indicated neutrality. The OBV was also caught within a range.
Is your portfolio green? Check the LINK Profit Calculator
Therefore, both buyers and sellers in the spot market have been evenly poised.
At the same time, the amount of LINK bought in the $14.8-$15.2 window meant that bulls would fight fiercely should sellers try to drive prices lower.