Chainlink: Why LINK may be looking the opposite way despite its downtrend

Disclaimer: The information presented does not constitute financial, investment, trading, or other types of advice and is solely the opinion of the writer.
Bitcoin [BTC] has made a series of higher lows in the past few days. After months of selling pressure, any and every small wave of buying would not mean the beginning of a new uptrend. Yet, on shorter timeframes, traders might be able to profit from these moves upward as well. While Bitcoin bulls fought to maintain prices above $20k, Chainlink [LINK] bulls were also fighting to push the prices higher. A lower timeframe bullish break meant that LINK could rise toward the $7 and $7.4 levels in the coming days.
LINK- 4-Hour Chart
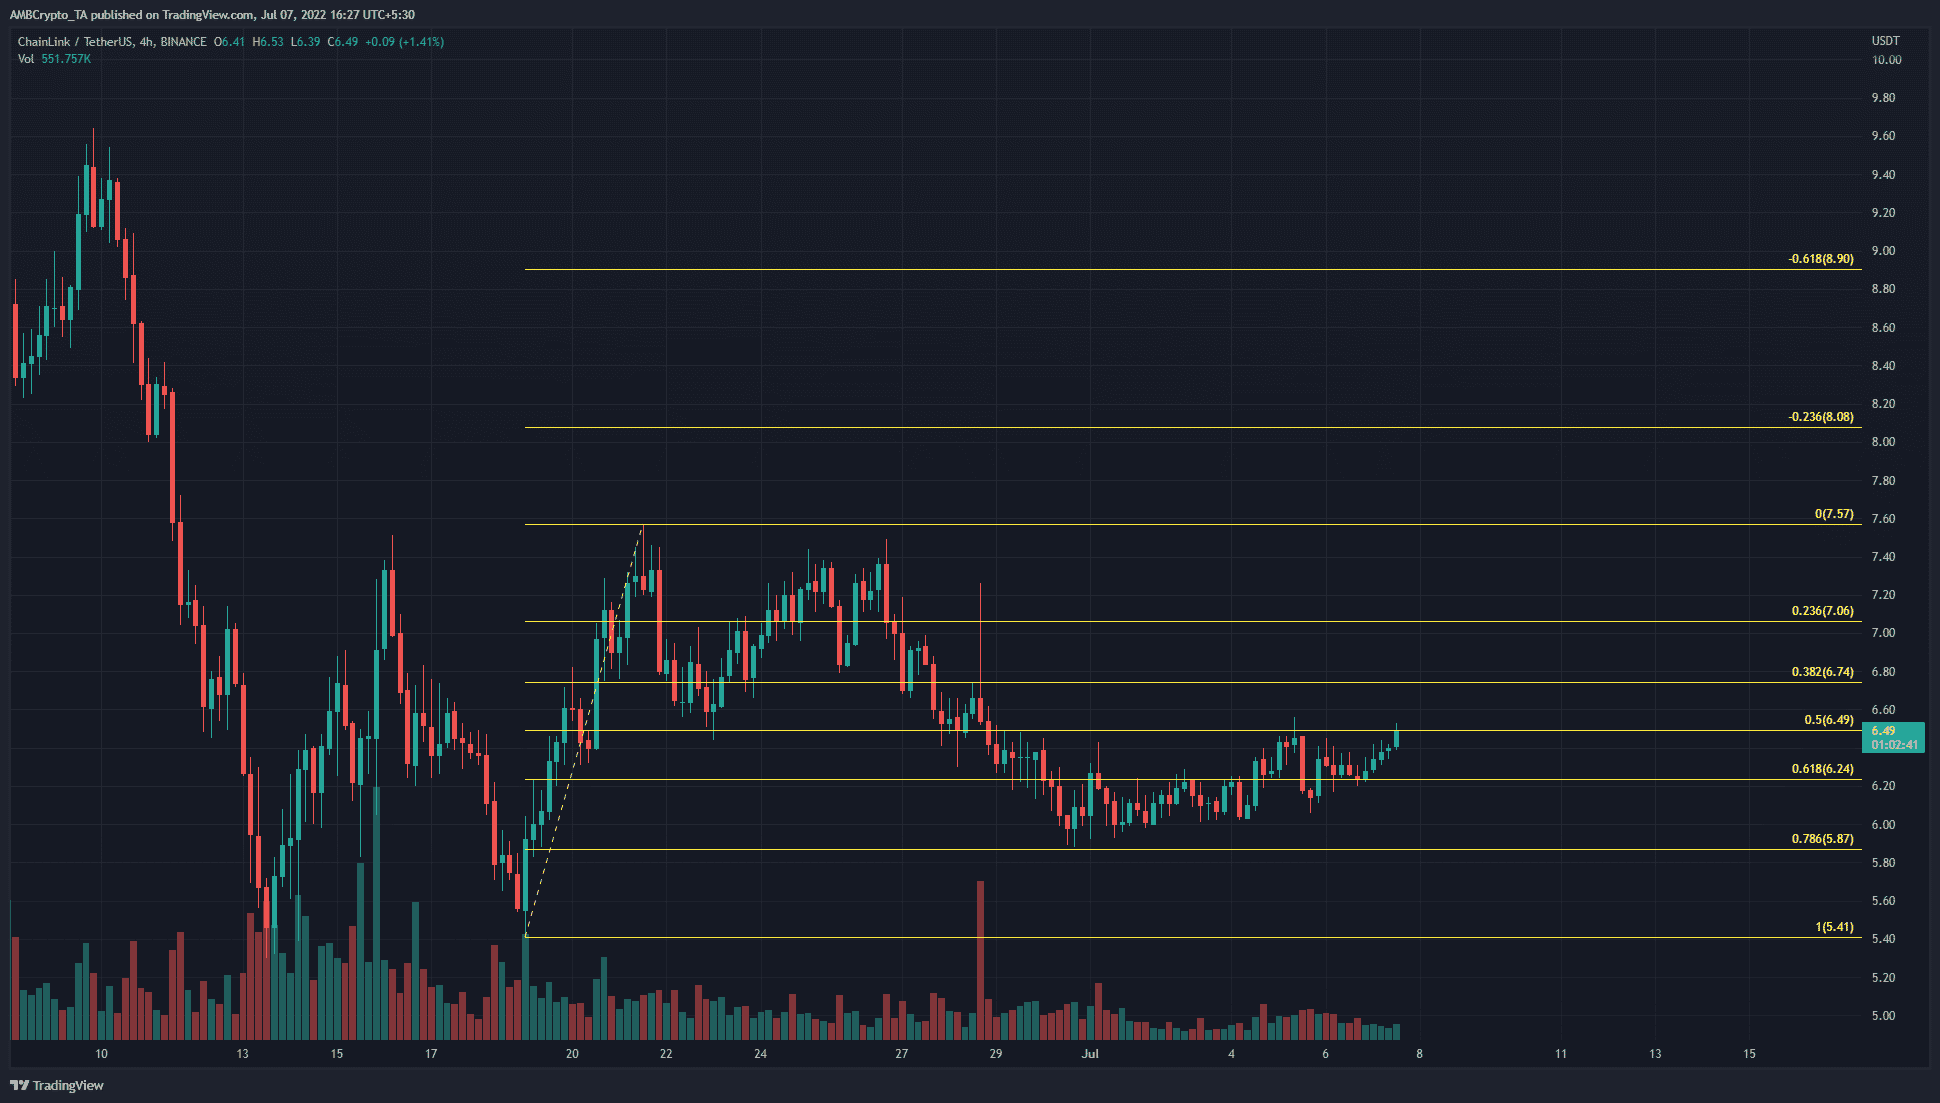
The bounce from the $5.4 support level to $7.57 was used to plot a set of Fibonacci retracement levels (yellow). There are two things to consider. First, the massive drop from $9.5 to $5.5 in mid-June indicated tremendous selling pressure behind Chainlink. This was on the back of a strong downtrend from the beginning of April as well. Therefore, the longer-term trend was strongly bearish.
The second consideration was that, after the sharp drop, Chainlink has been unable to breach the $7.5 resistance area on multiple attempts. Besides, the entire area from $7-$7.5 has seen tests, followed by sharp rejections on the price chart.
LINK- 1 Hour Chart
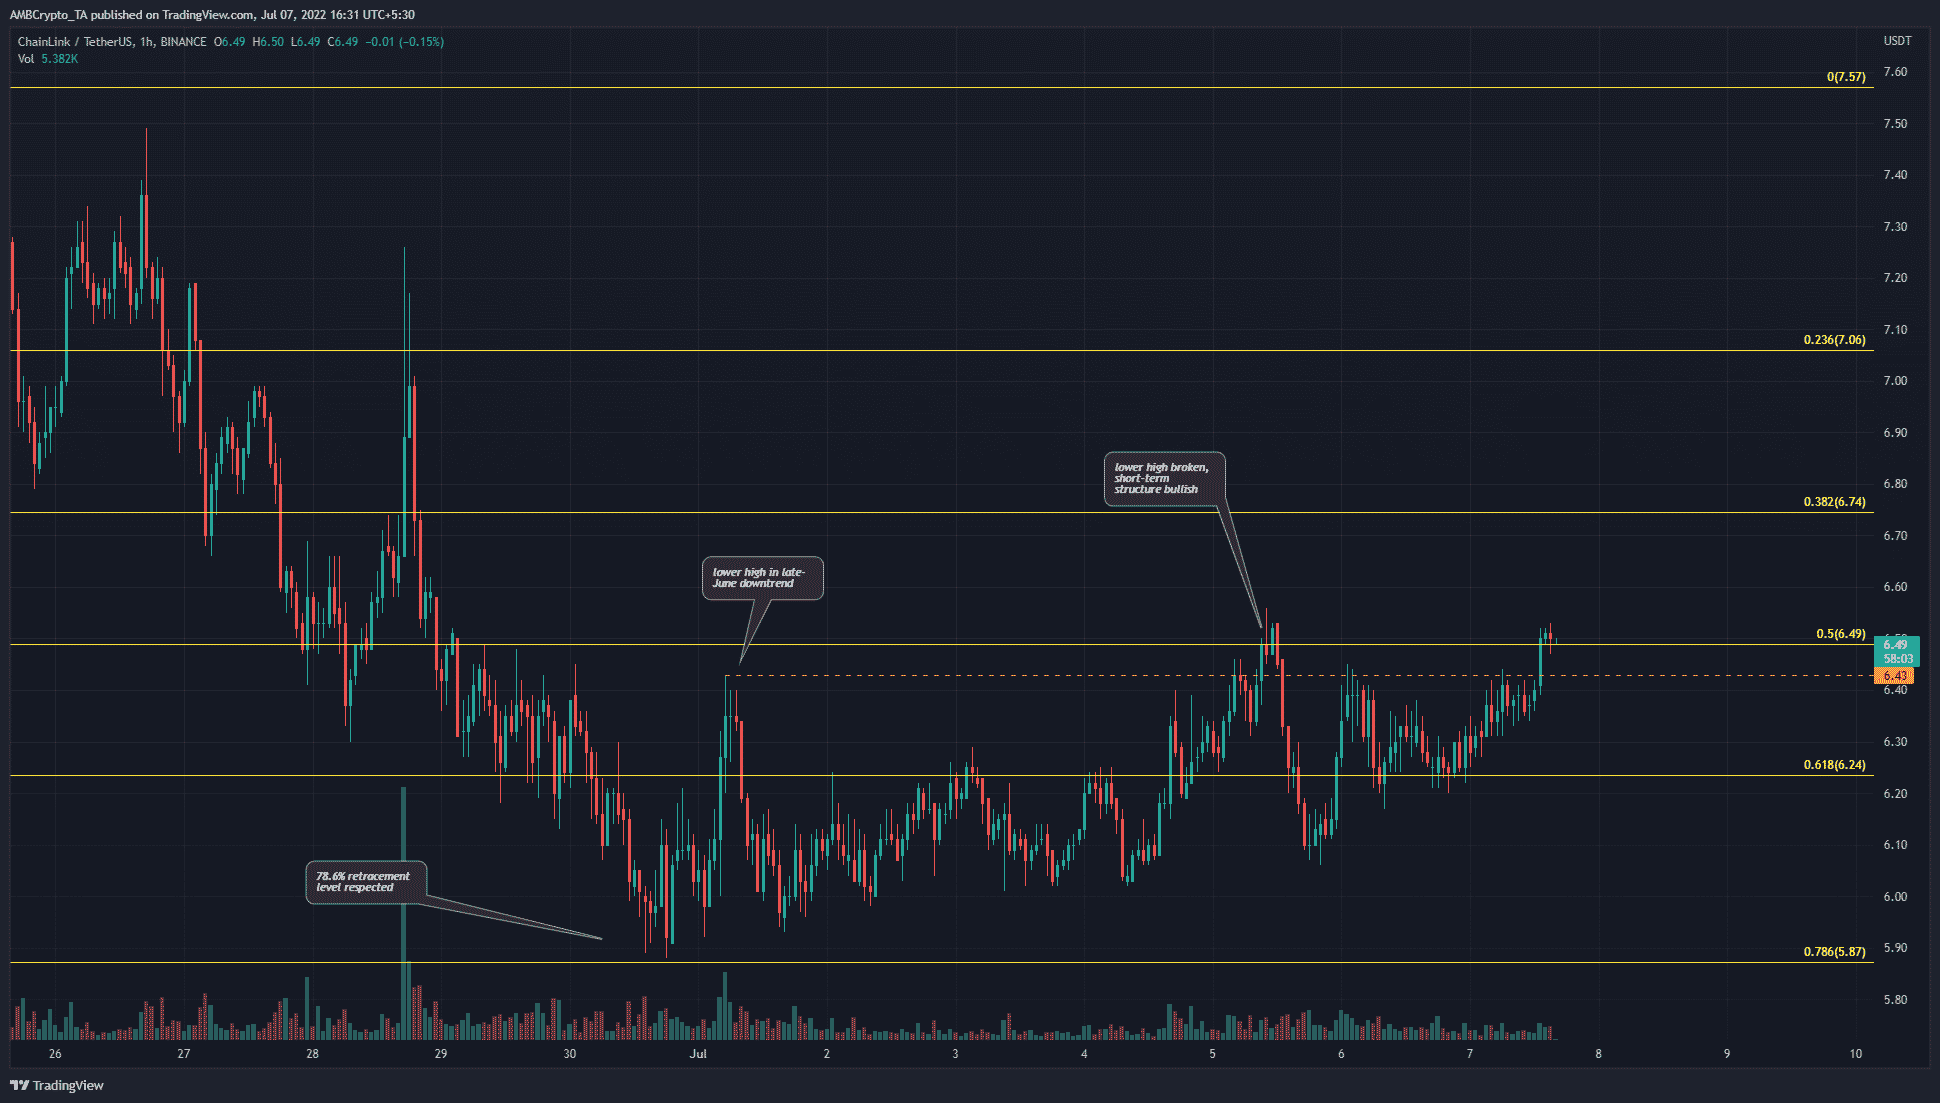
Zooming in on the one-hour chart, a bullish market structure break was seen a few days ago. The price was able to close a session above the previous lower high (dashed orange) at $6.43. Since then, the price also made a series of higher lows.
It can also be seen that the 78.6% Fibonacci retracement level was respected. The bulls were able to force a session close above the 50% level as well, which was a sign of intent.
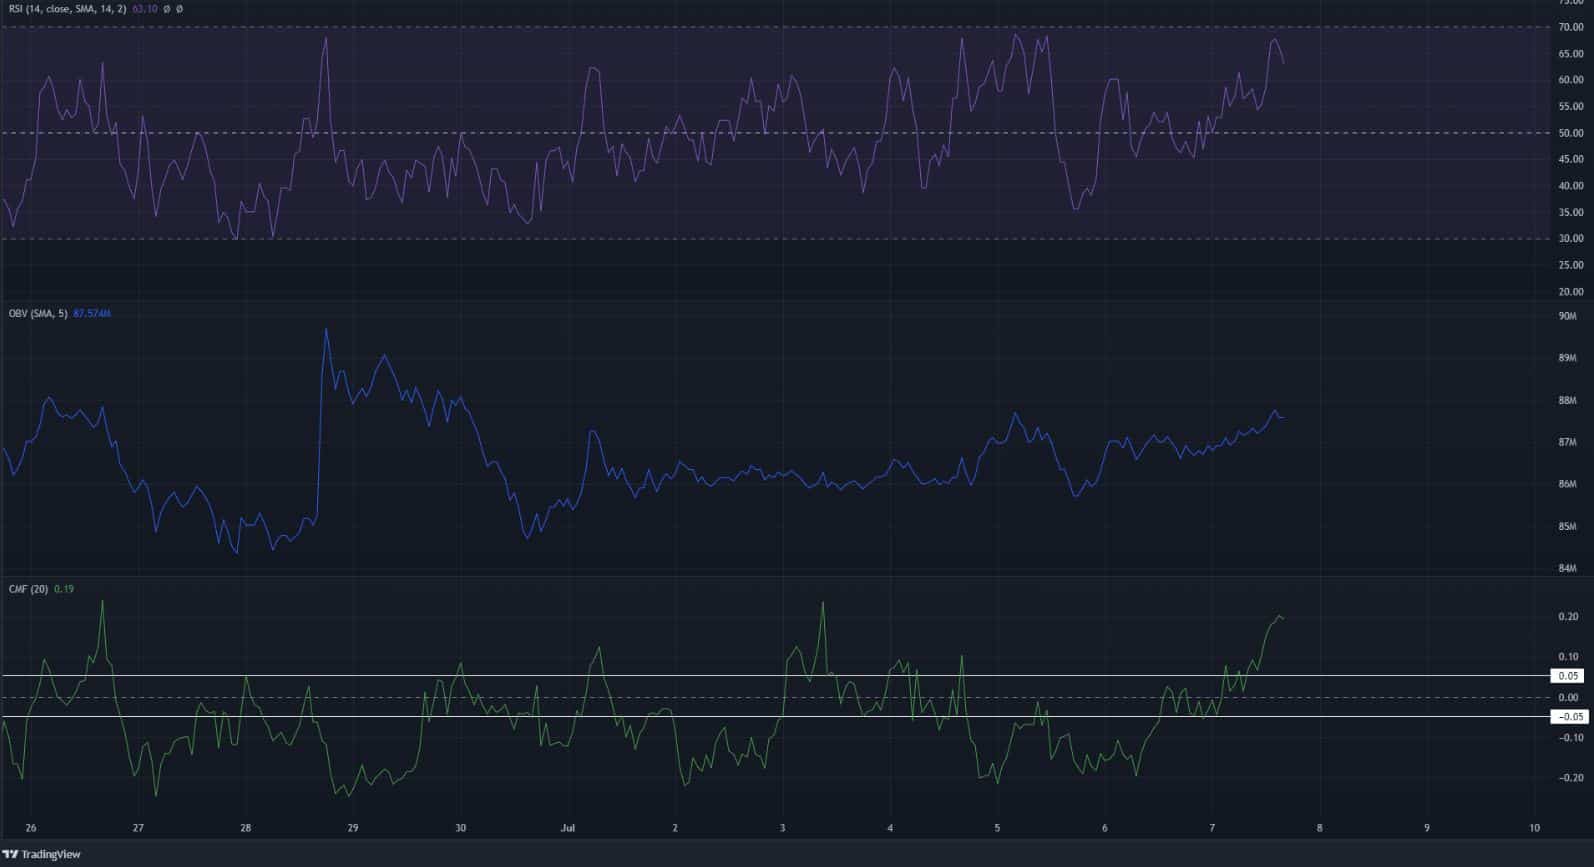
The lower timeframe indicators leaned in favor of the bulls. The Relative Strength Index (RSI) was able to climb back above the neutral 50 line to underline bullish momentum behind LINK in the past couple of days. The On-Balance Volume (OBV) has also slowly moved higher. However, it has not yet broken past the highs from 10 days ago.
The Chaikin Money Index (CMF), which had been in neutral or bearish territory for most of the past week, was able to rise swiftly past +0.05. Therefore, it can be concluded that significant capital flow into the market was witnessed in recent hours.
Conclusion
The lower timeframe price action and indicators hinted at a move toward $7 and $7.4 for LINK. However, it could be an intense battle for the bulls to push LINK past $7.5. The long-term trend remained bearish. Bitcoin could have a large impact on the sentiment behind LINK over the next few days as well.