Chainlink’s 74% hike – Gauging what’s next for LINK’s price action

- Chainlink surged by over 74% in 3 weeks to test its 6-month high near $18.7 after breaking above key EMAs
- Derivates data suggested many traders are still leaning towards long positions over the long term
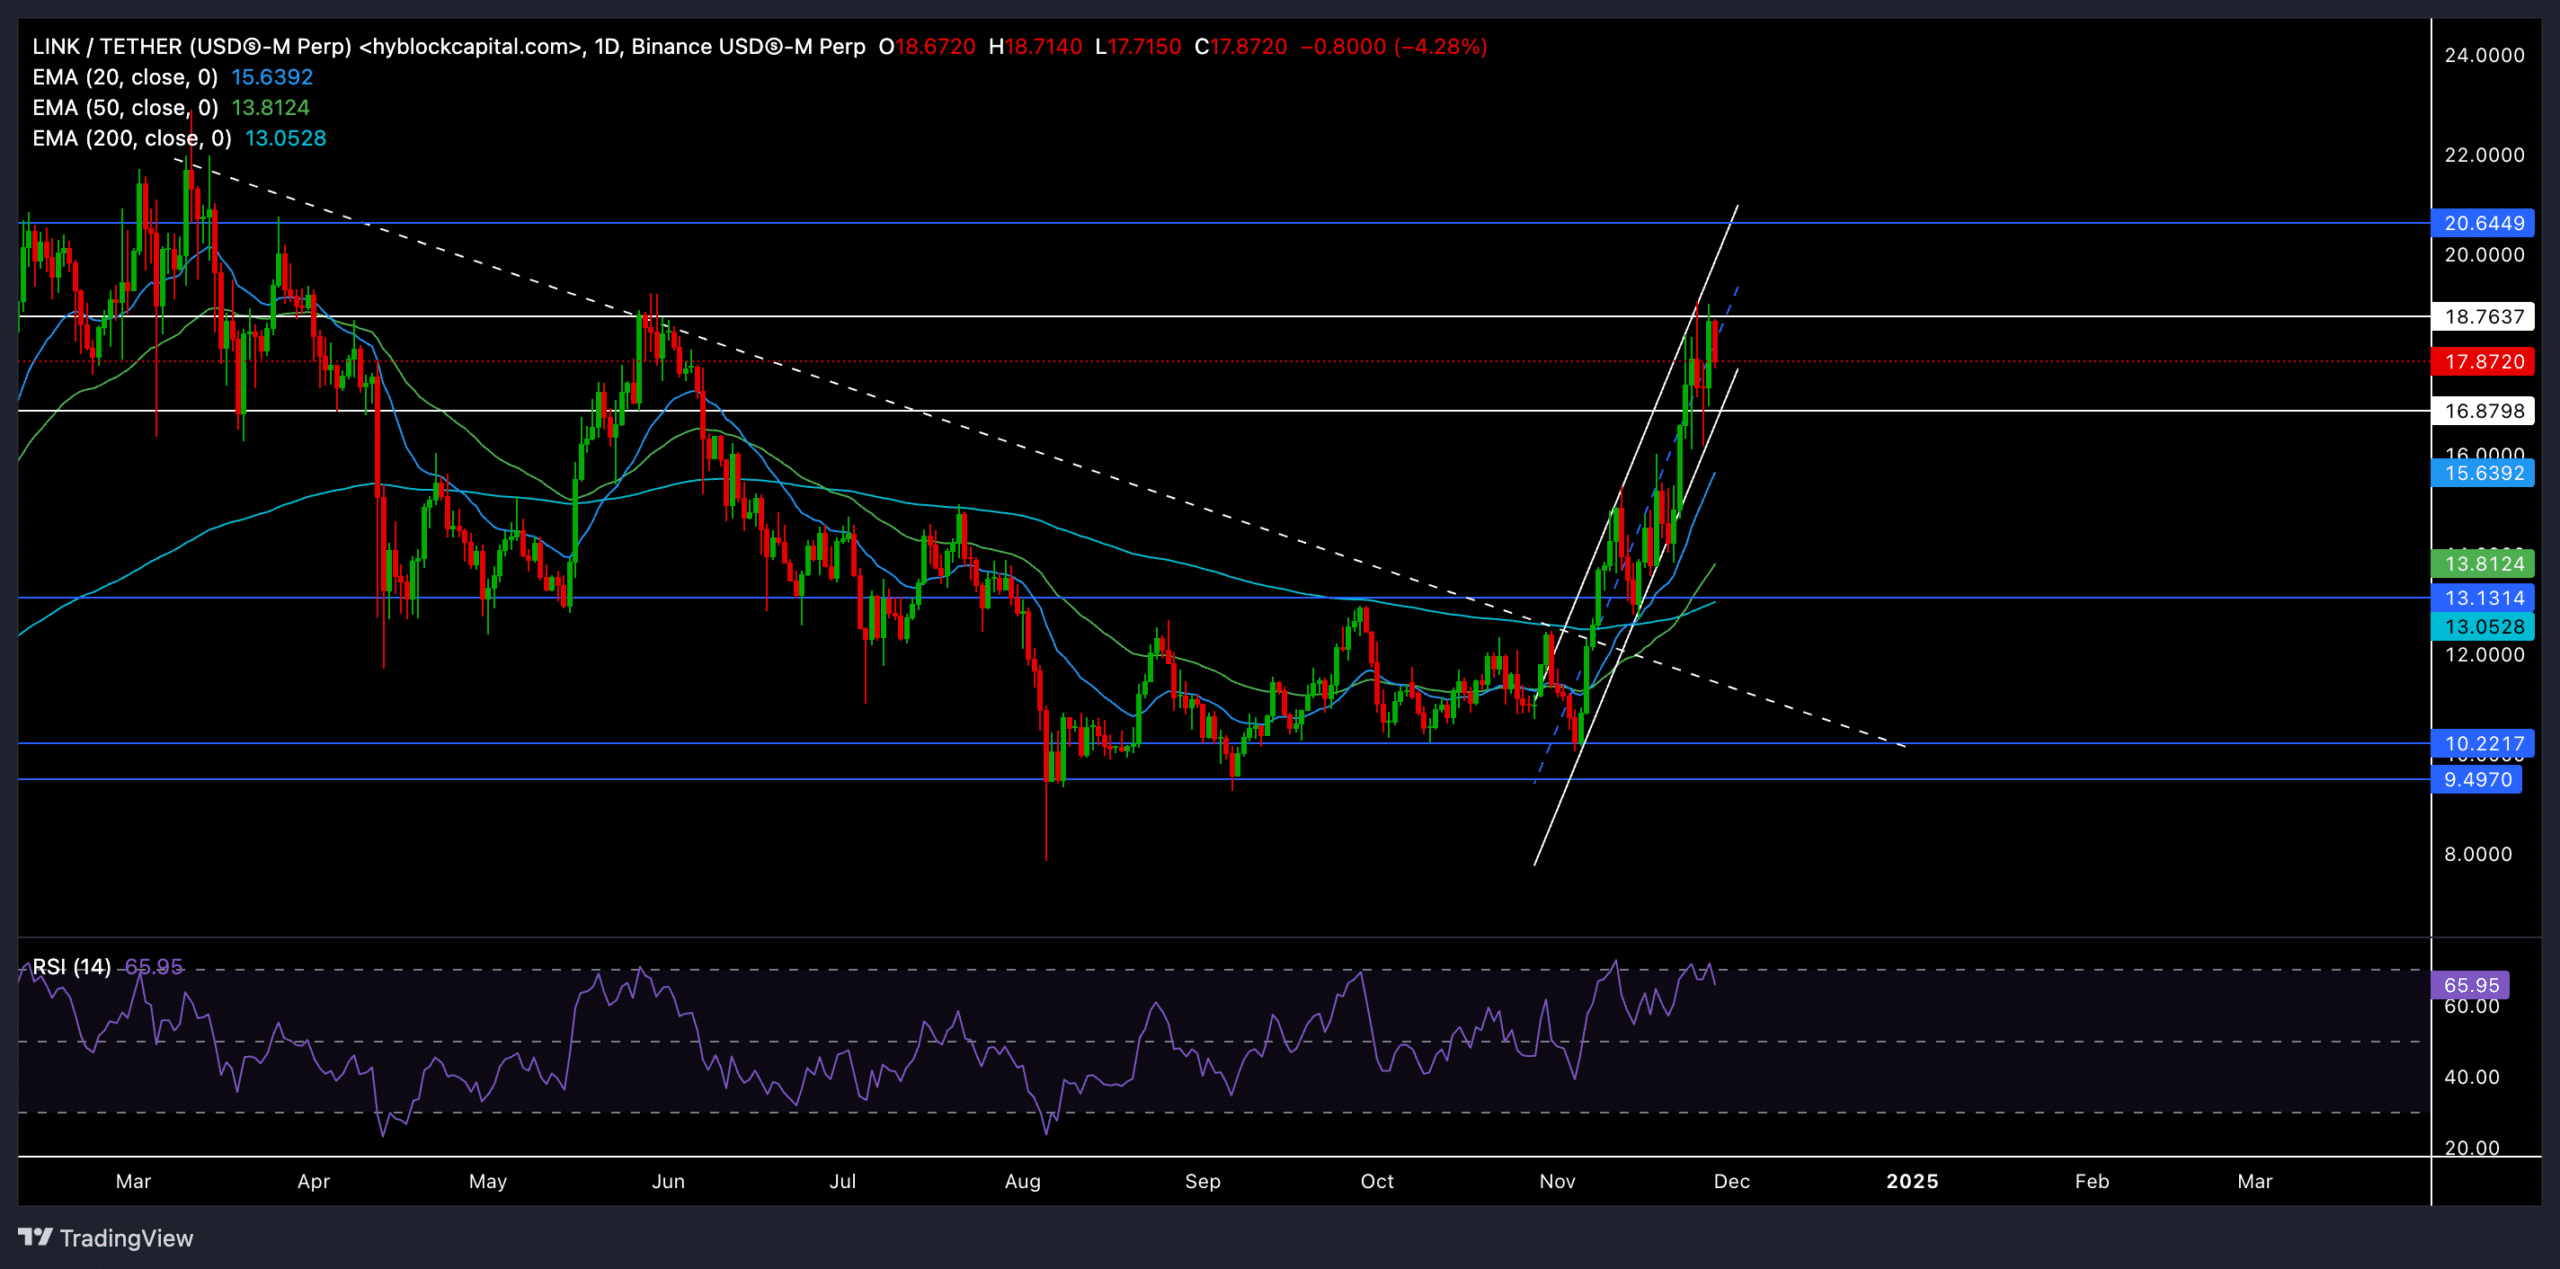
After a promising rebound from its $10-support, Chainlink (LINK) recently gained by over 74% and touched its 6-month high near the $18.7 resistance. In fact, its price action has managed to break above key exponential moving averages (EMAs) – Signaling extended bullish momentum.
LINK was trading at around $17.87, at the time of writing, experiencing a slight pullback after hitting the resistance level. Will the bulls break through, or will the price enter a consolidation phase?
LINK eyes $18 resistance
LINK’s price action over the last few weeks highlighted a steep uptrend, with the token forming higher highs and higher lows while maintaining its bullish momentum. The recent price rally took LINK above its 20-day EMA ($15.64), 50-day EMA ($13.81), and 200-day EMA ($13.05) – A sign of strong buying pressure that remains intact in the broader market.
However, as LINK touched the $18.7 resistance level, the price movement was confined within an ascending channel pattern. A breakout above $18.7 could pave the way for a sustained uptrend towards the next major resistance at $20. On the other hand, a failure to close above this resistance may prompt a near-term retracement towards the support near $15.
The Relative Strength Index (RSI) stood at 65.95 at press time, indicating a bullish edge but nearing overbought territory. If the RSI fails to sustain above 70, the buying pressure might ease and lead to a short-term correction.
Also, the RSI could be due for a near-term reversal because of a bearish divergence with the price action. However, the north-looking EMAs would likely continue to provide strong support in the coming days.
Derivatives market sentiment
LINK’s trading volume dropped by 17.67% to $760.22 million and Open Interest went down slightly by 0.6%. This revealed that traders are being cautious as the price approaches a resistance level.
Over the last 24 hours, the long/short ratio across exchanges was 0.9474, indicating a balanced sentiment among traders. However, platforms like Binance & OKX showed a stronger preference for long positions, with ratios of 2.94 and 2.27. This suggested that many traders have been optimistic about LINK’s potential hike. On Binance, the top traders also leaned heavily towards long positions, with a ratio of 3.902.
Recent data indicated that bulls seem to have the upper hand, as most liquidations involved short positions, further supporting the bullish outlook in the market.
Nonetheless, keeping an eye on Bitcoin’s price movement and broader market sentiment will be key to gauging LINK’s next course.


