
- Two key price clusters represented long-term holders, creating both strong support and resistance zones
- Strategic buys during dips suggested that LINK holders are unlikely to sell
Chainlink [LINK] is hovering between two major price clusters right now, with on-chain data pointing to intense accumulation activity from long-term holders. With strategic buys reinforcing the $14.6 support and heavy concentration at $16 acting as resistance, LINK’s next move could be shaped by the strength of its most committed investors.
Chainlink Cost Basis clusters reveal strategic accumulation
At the time of writing, Chainlink’s Cost Basis Distribution revealed two dominant clusters – At $14.6 and $16. These zones hold approximately 65 million and 20 million LINK, respectively. These zones are not random though. Instead, they reflect high-conviction investor behavior.
The $16 cluster, in particular, alludes to consistent buy activity during major market dips – From the December crash through the February correction and again, around the 11 March low.
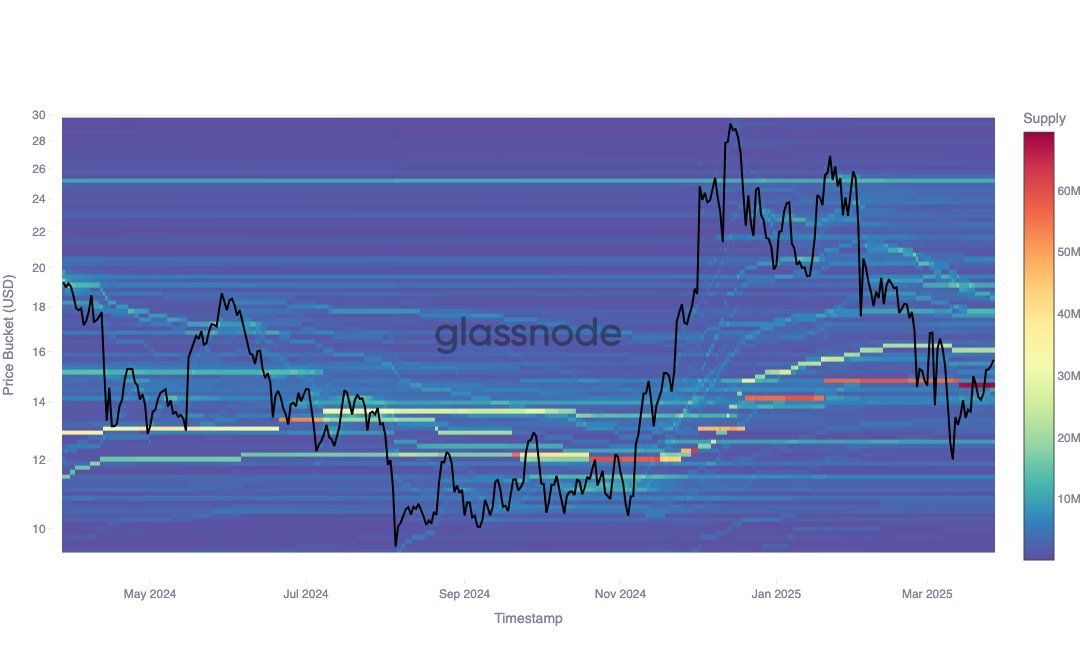
Source: Glassnode
This steady repositioning is a sign that these investors are not short-term traders, but strategic allocators with longer time horizons.
As such, the $16-level is less likely to face heavy sell pressure unless the market sees a drastic sentiment shift. However, it still poses a near-term resistance, having rejected price attempts recently.
$14.6 cluster offers reinforced support backed by historical buys
The $14.6-level carries more weight as a key support, backed by approximately 65 million LINK and representing a wide base of long-term buyers.
These investors entered around the $17 and $28 zones in December, revisited the market at $25 in January, and notably re-accumulated during the 15 March recovery off the $12-mark.
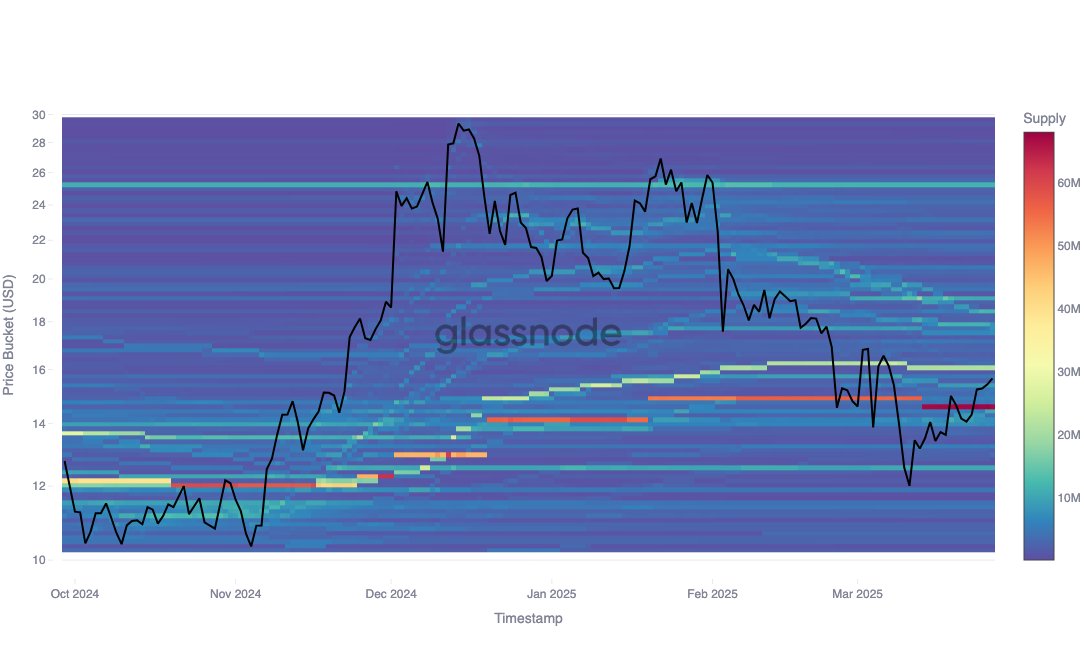
Source: Glassnode
This pattern of engagement paints a picture of patient, price-aware holders, less likely to be shaken by volatility.
Such behavior enhances $14.6’s credibility as a strong psychological and technical floor in the current market structure.
LINK caught between MAs as momentum weakens
From a technical standpoint, LINK was trading at $13.94 – Under both the 50-day [$14.56] and 200-day [$19.25] moving averages. The 50/200-day death cross seen in early March seemed to consistently cast a bearish shadow too.
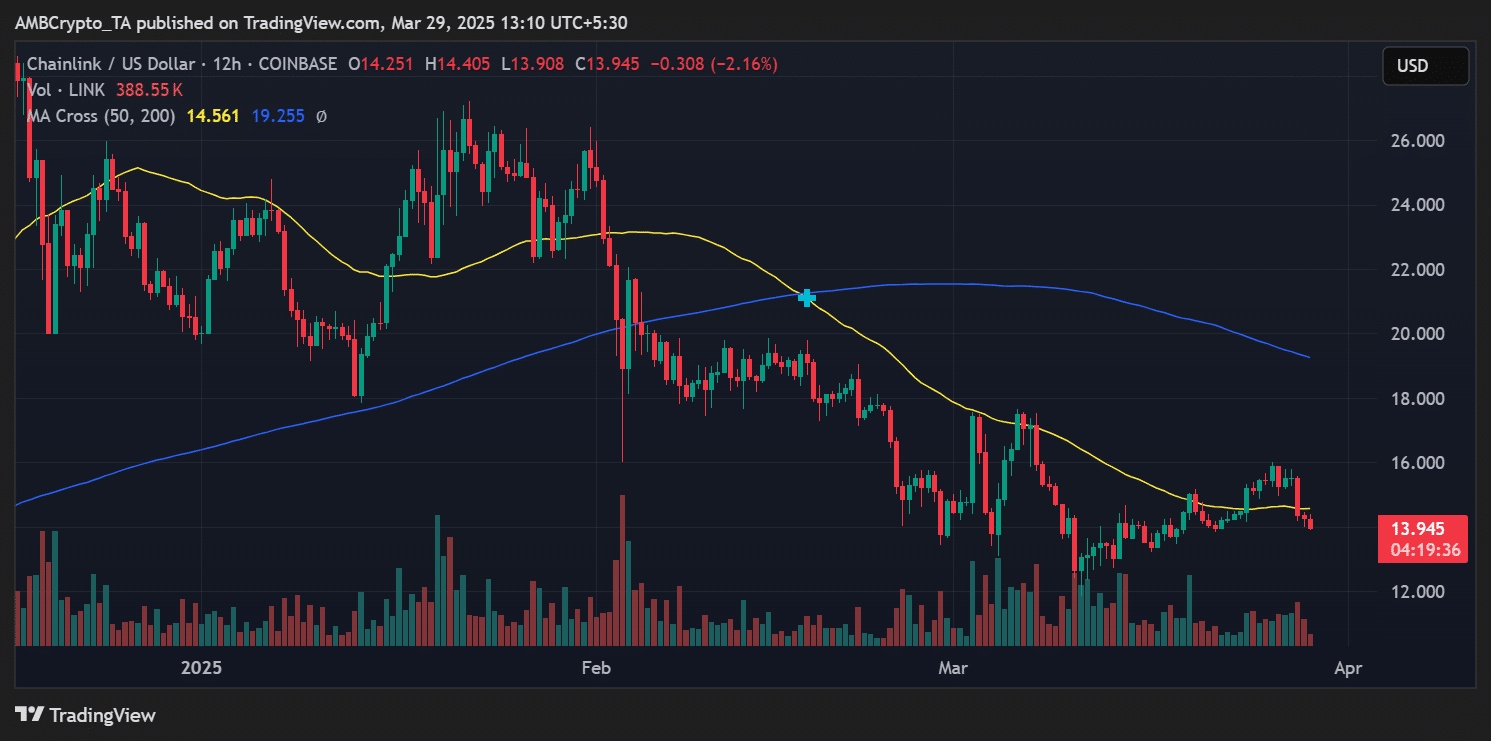
Source: TradingView
Still, the recent bounce off $12 was in line with the on-chain cluster data – A sign that bottoming efforts may be underway. If LINK reclaims $14.6 with strong volume, a retest of the $16 barrier could follow.
However, expect resistance there unless broader market momentum shifts.
Conclusion
Chainlink’s price is compressing within zones of historical buyer interest right now. While $14.6 offers credible support, $16 has emerged as the resistance battleground.
Whether LINK can break out depends on broader market liquidity and whether long-term holders continue to absorb supply without triggering profit-taking.