Chalking out MATIC’s probability of bouncing back from this support

Disclaimer: The findings of the following analysis are the sole opinions of the writer and should not be considered investment advice.
- MATIC’s recent bearish comeback aided sellers in breaking down from its rising wedge setup.
- The crypto’s social dominance and open interest unveiled a slight bearish edge.
The recent buying efforts pushed Polygon [MATIC] again above the constraints of the daily 20 EMA (red) and the 50 EMA (cyan) as the price traced its way to test the $0.94-$0.93 resistance range.
Here’s AMBCrypto’s Price Prediction for Polygon [MATIC] for 2023-24
After plateauing at this range, MATIC marked an expected reversal from its bearish pattern. The buyers could seek to curb the streak of red candles in their efforts to bounce back in the coming sessions.
At press time, MATIC was trading at $0.8906, down by 3.62% in the last 24 hours.
Can the north-looking EMAs support MATIC’s bull run?
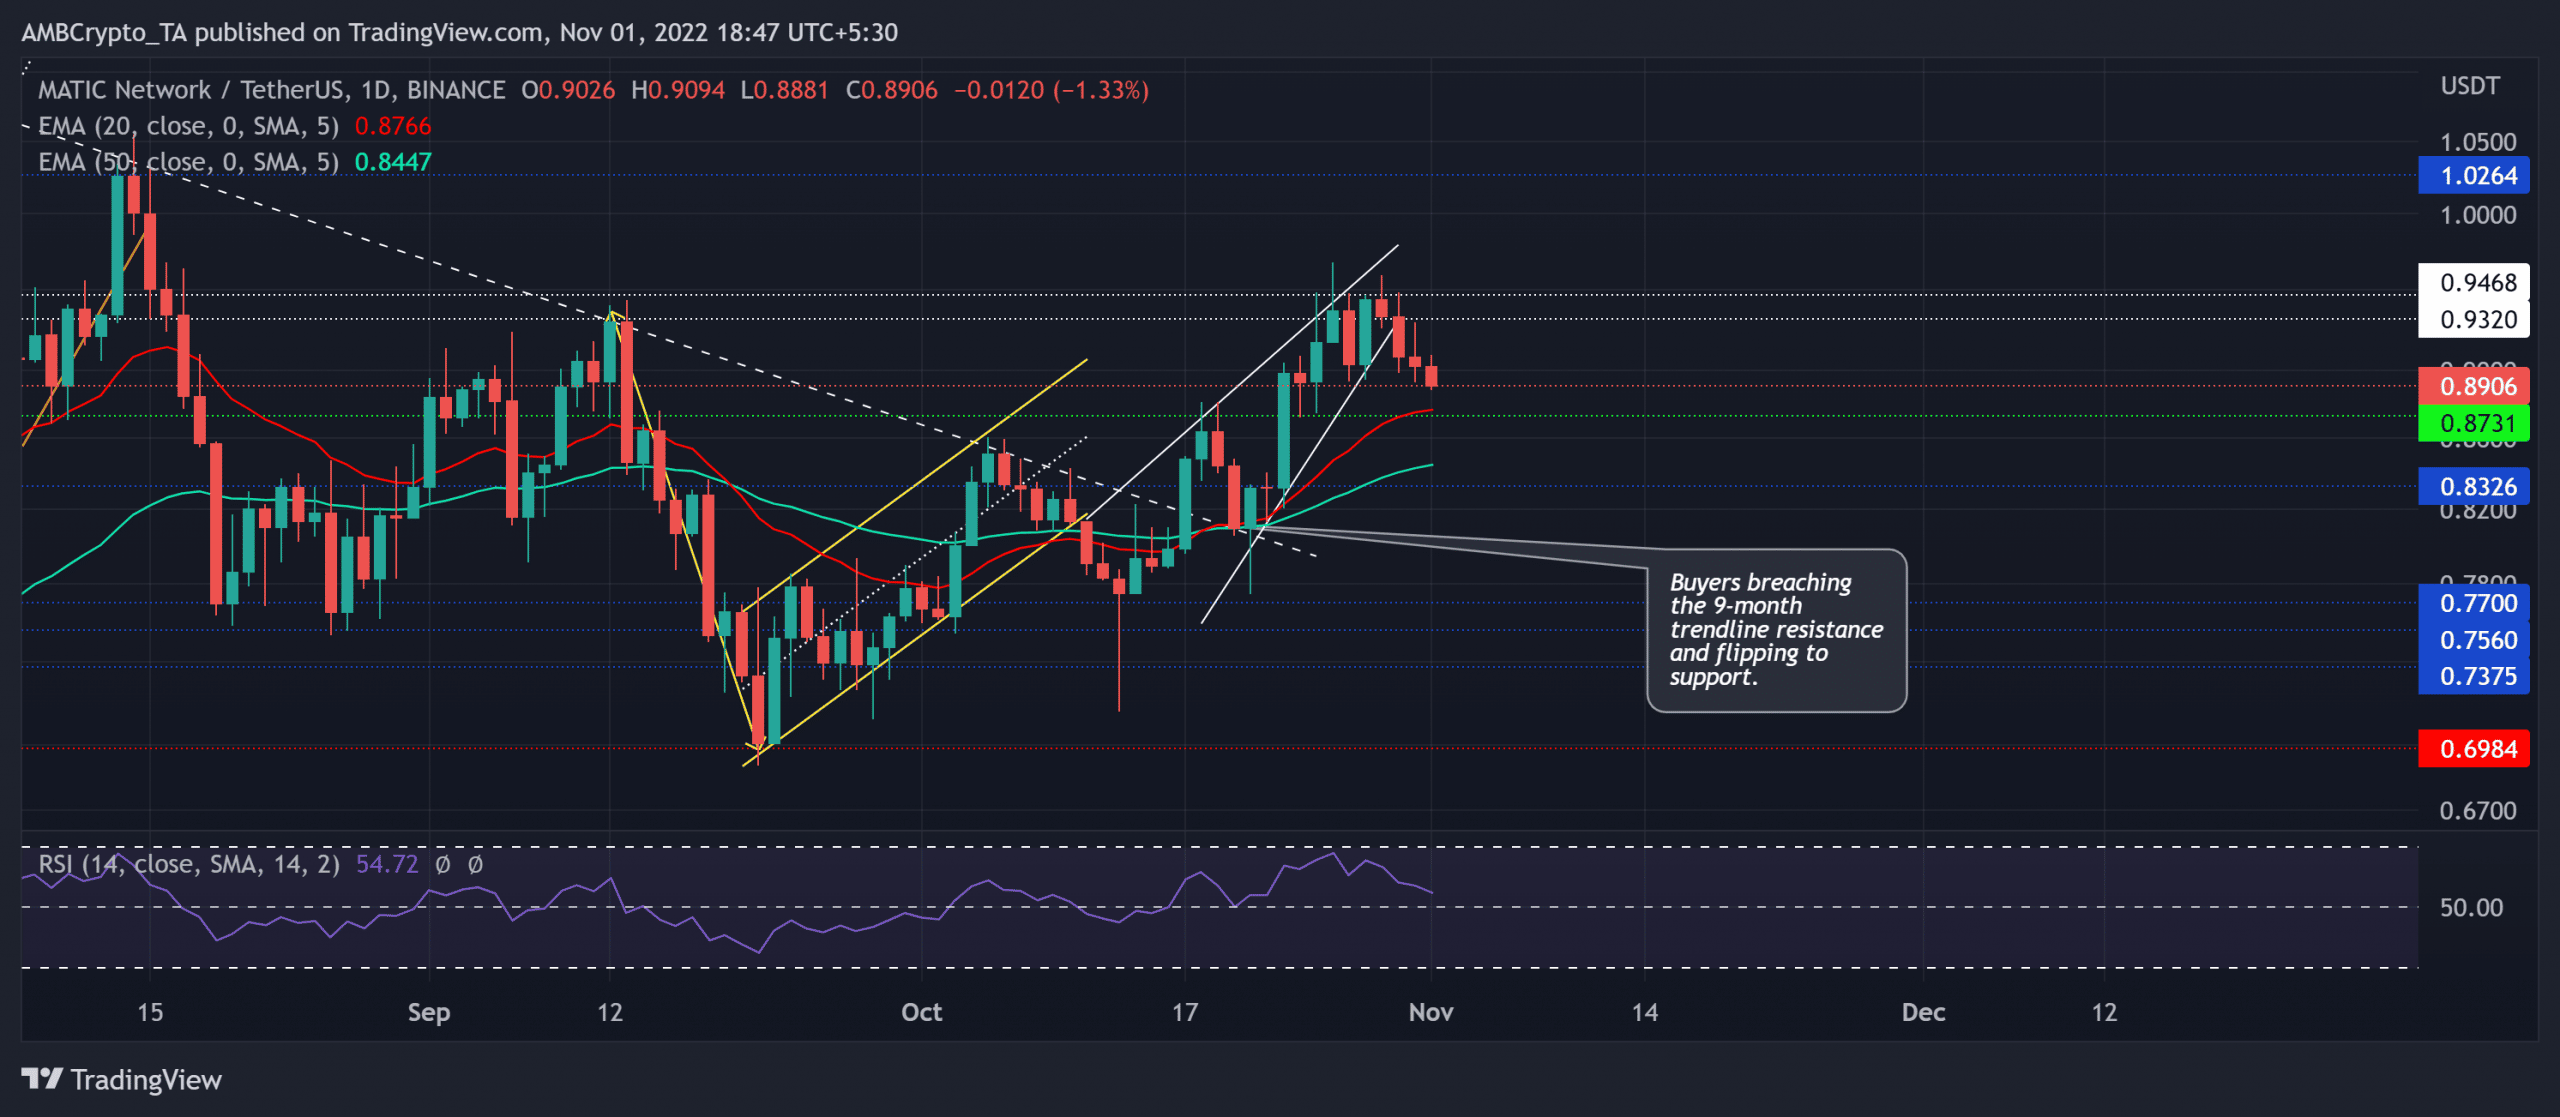
After an expected u-turn from the nine-month trendline resistance (now support), the alt saw a bearish flag on the daily chart as the sellers re-entered the market. Nonetheless, the recent rebound from the $0.698 support induced a buying rally above the 20/50 EMA.
MATIC’s solid double-digit growth in the last two weeks aided the alt in retesting the $0.94 resistance barrier. With the 20/50 EMAs now looking north after the golden cross, the buyers could look to maintain their edge.
A continued decline from the immediate resistance could find resting grounds at the $0.87-mark near the 20 EMA (red). A potential/ immediate reversal from this support could present buying opportunities. The first major resistance would lie in the $0.94 zone. Any close above this ceiling could carve a path for further gains.
Any decline below the 20 EMA could invalidate the near-term bullish inclinations by delaying the recovery prospects.
The Relative Strength Index (RSI) plunged from the overbought levels to depict ease in buying power. Any reversals from the midline could highlight the underlying bullish edge. A close below the equilibrium could hint at a bullish invalidation.
Decreased Social Dominance & Open Interest
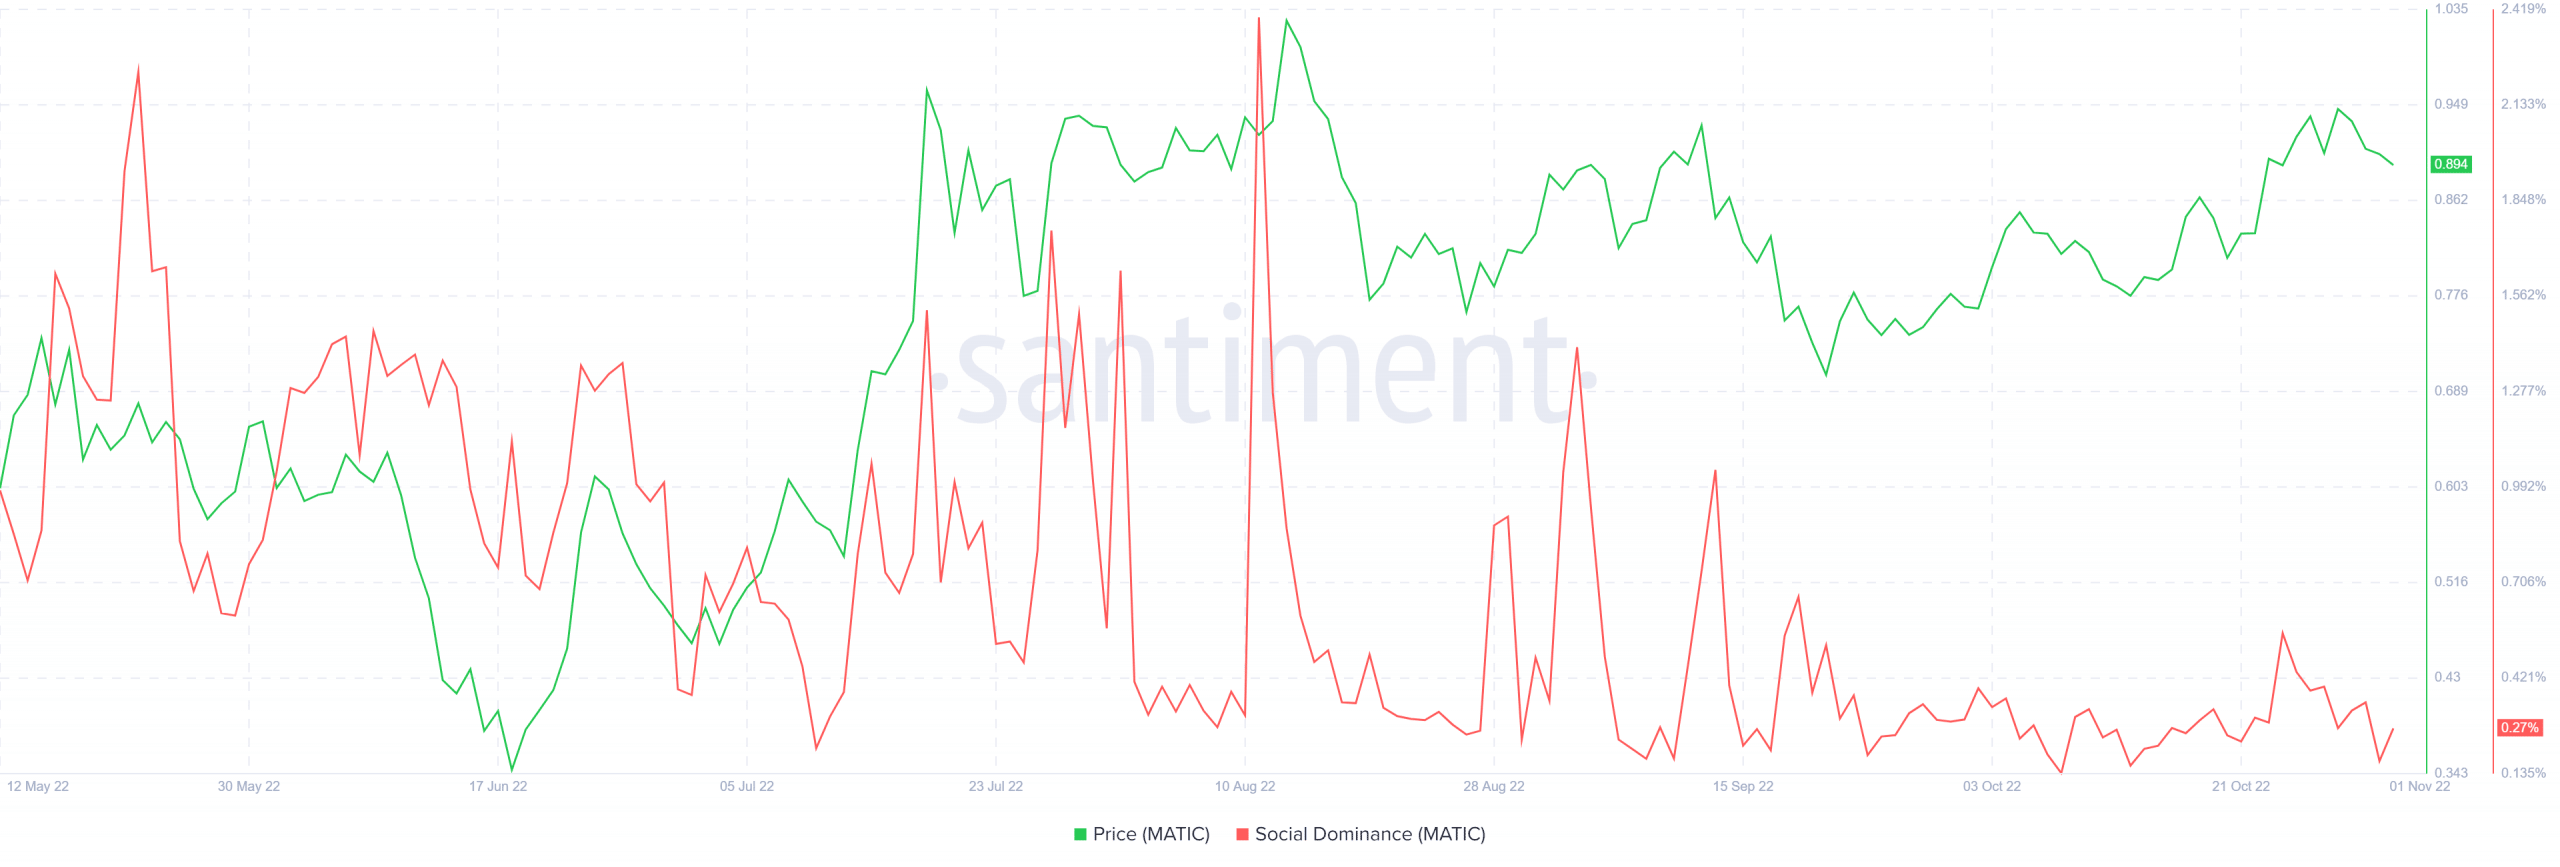
Since mid-September, MATIC’s social dominance marked consistently lower peaks. On the other hand, the price action diverged to depict an incline. Should the price follow, MATIC could see a pullback in the coming sessions.

To top it up, an analysis of the MATIC Futures Open Interest marked a 5.51% 24-hour decrease alongside the decrease in price over the past day. This reading suggested a slight bearish inclination in the futures market.
Finally, investors/traders must keep a close eye on Bitcoin’s movement as MATIC shares a relatively high correlation with the king coin.


