Charting Bitcoin’s road beyond $60K: A 20% surge in coming weeks?
Bitcoin managed to break above a pattern that could result in a 20% rally in the coming weeks.
- Bitcoin’s price increased by over 10% in the last seven days.
- Most metrics were bullish, but a few suggested otherwise.
Bitcoin [BTC] recently managed to break above the $60k barrier, sparking excitement among investors. However, this uptrend might just be the beginning, as a bullish pattern has appeared on the crypto’s price chart.
Bitcoin: A bullish breakout
AMBCrypto’s look at CoinMarketCap’s data revealed that BTC’s price increased by double digits last week. To be precise, its value surged by more than 10%.
At the time of writing, BTC was trading at $63,370.18 with a market capitalization of over $1.25 trillion.
In the meantime, World of Charts, a popular crypto analyst, recently posted a tweet revealing an interesting development.
As per the tweet, a bullish descending channel emerged on Bitcoin’s chart. The king of crypto’s price has been consolidating inside the pattern since May, only to break out a few days ago.
So far, since the breakout, BTC has been up by more than 5%. But if the trend continues, then the coin’s price might witness a 20% pump in the coming days or weeks.

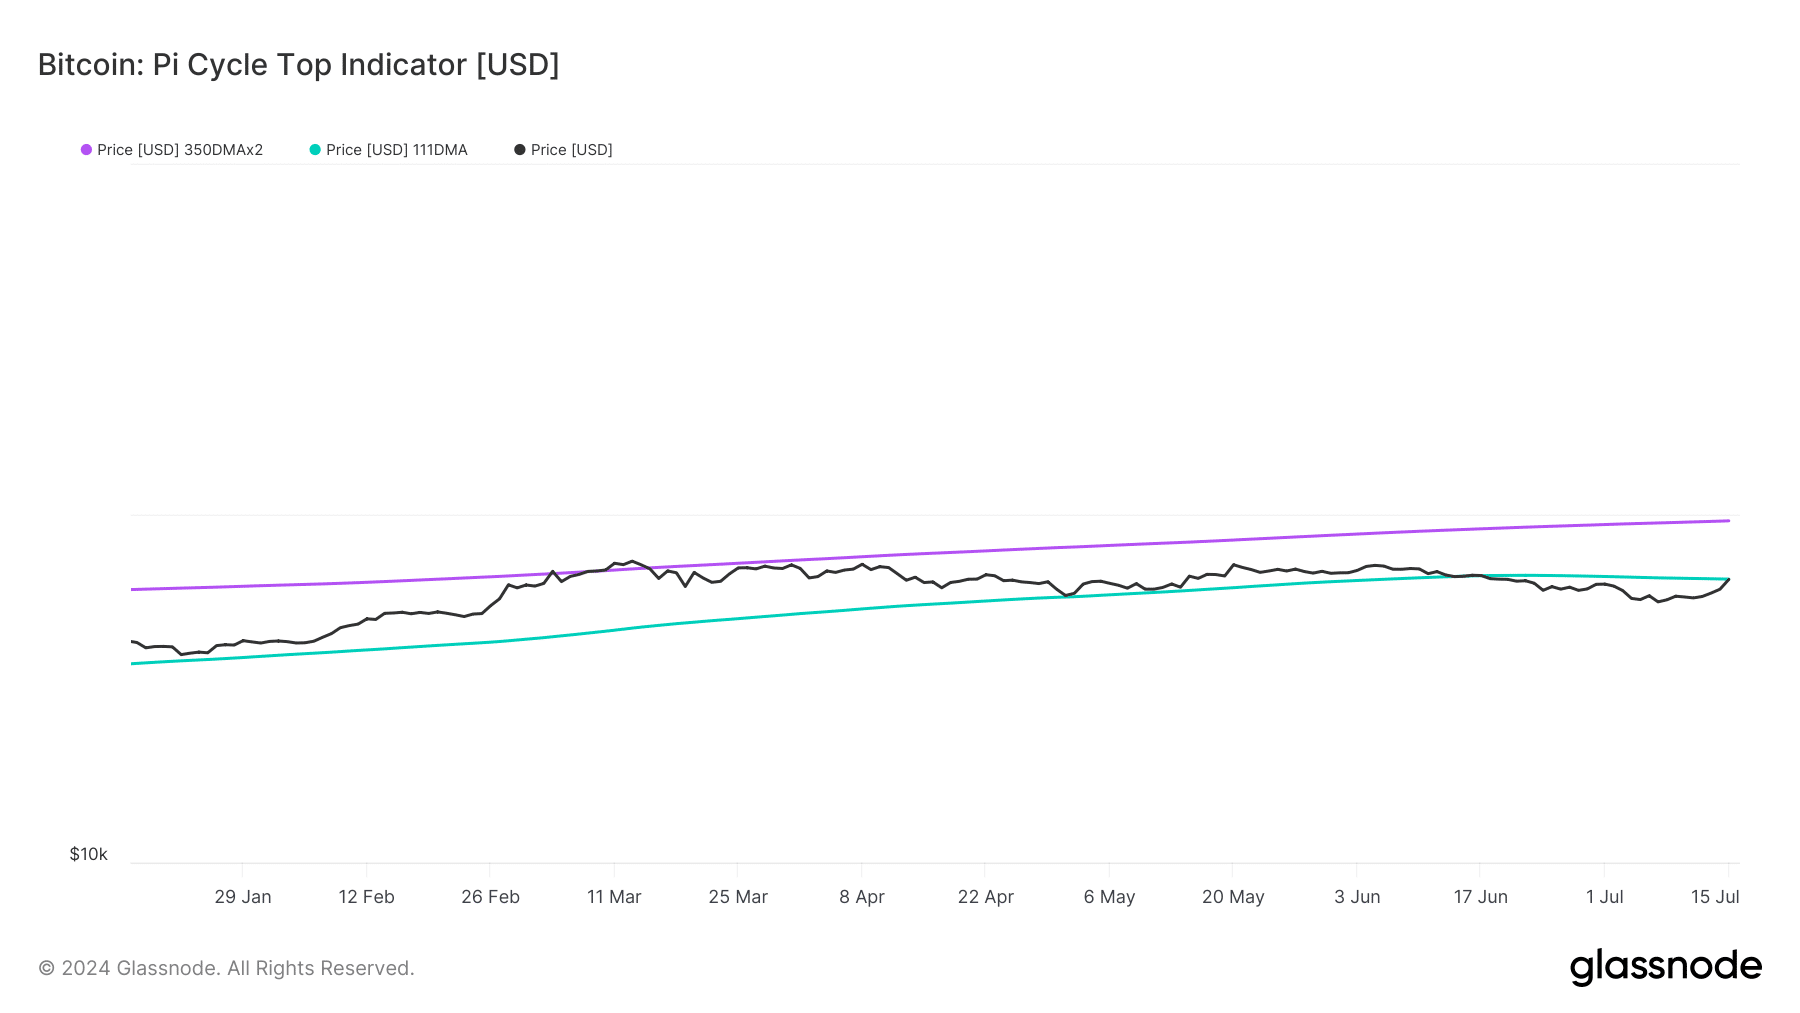
AMBCrypto’s look at Glassnode’s data pointed out yet another positive signal. BTC’s price has been laying under its possible market bottom of $64k for several weeks, as per the Pi Cycle Top indicator.
At press time, it was fast approaching that mark. If the trend lasts, then Bitcoin over the coming months might as well touch its possible market top of $95k.
Will BTC’s bull rally continue?
AMBCrypto then took a look at CryptoQuant’s data to find out what metrics suggested regarding a continued price increase.
We found that BTC’s net deposit on exchanges was low compared to the last seven days’ average, indicating that buying pressure was rising.
Its Coinbase Premium was also green, meaning that buying sentiment was strong among U.S. investors.
Apart from that, Bitcoin’s Funding Rate was also high. This suggested that long-position traders were dominant and were willing to pay short-position traders.

However, not everything was bullish. At press time, BTC’s fear and greed index had a value of 71%, meaning that the market was in a “greed” phase.
Whenever the metric reaches this level, it indicates that there are chances of a price correction.
Read Bitcoin (BTC) Price Prediction 2024-25
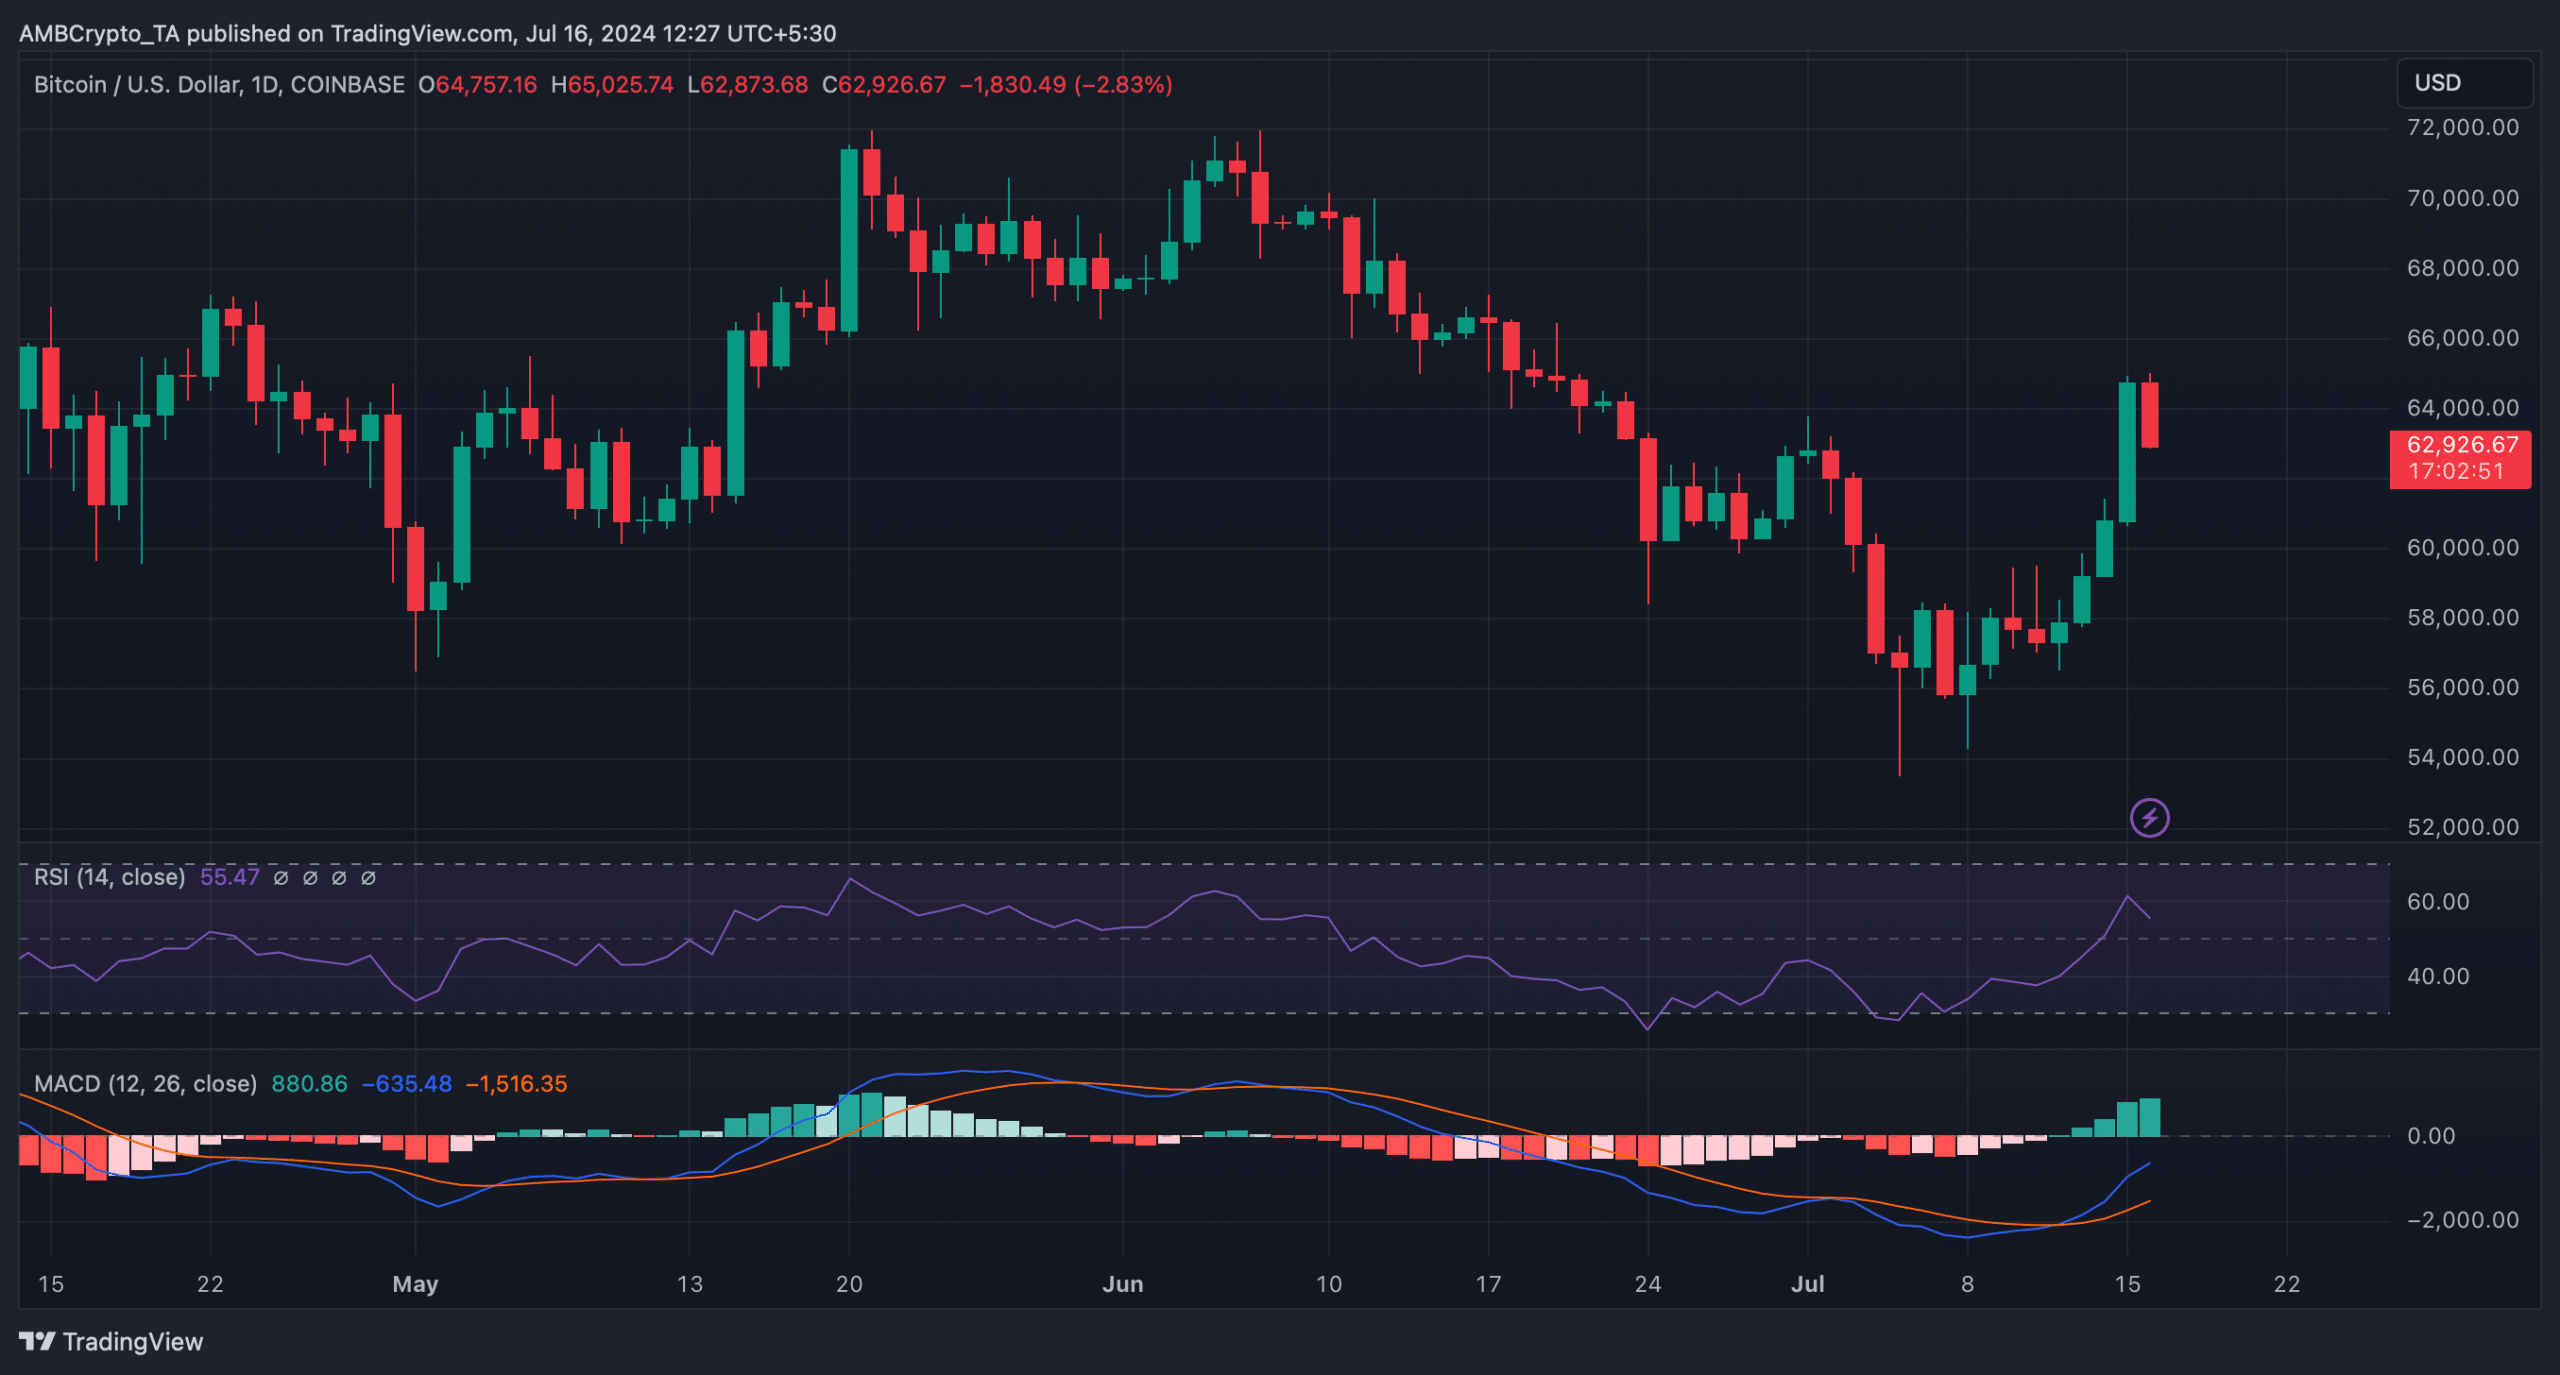
Therefore, AMBCrypto checked BTC’s daily chart to better understand what to expect.
We found that the Relative Strength Index (RSI), after a sharp increase, registered a downtick, which meant that bears might take over soon. Nonetheless, the MACD displayed a bullish advantage in the market.