
What is tokenization?

- Cardano’s NVT ratio indicated that the token was overvalued.
- However, indicators were bullish and suggested a run towards $0.45 soon.
Cardano [ADA] was among the lucky cryptos that managed to paint both its daily and weekly charts green.
But this just might be the beginning for a massive bull rally, as there were chances of ADA beginning a rally towards $1 soon.
Cardano to target $1
CoinmarketCap’s data revealed that ADA’s price increased by more than 1.5% last week. The bulls remained dominant over the bears in the past 24 hours as well, because ADA’s price increased marginally.
At the time of writing, the token was trading at $0.3407 with a market capitalization of over $12.2 billion, making it the 11th largest crypto.
While the bulls controlled the market, World Of Charts, a popular crypto analyst, recently posted a tweet highlighting a bullish pattern on Cardano’s price chart.
The bullish falling wedge pattern emerged in December last year, and since then ADA has been consolidating inside the pattern.
After more than half a year, ADA was finally showing signals of a possible breakout from the pattern. If that happens. Then, investors might witness a major rally, which could push ADA to $1 in the upcoming quarter.

Source: X
Other targets to consider
Though a bullish breakout would suggest a climb to $1, AMBCrypto first planned to assess the Cardano breaking above the resistance.
AMBCrypto’s analysis of Santiment’s data revealed that ADA’s MVRV ratio improved last week. In fact, whale concentration also increased.
As per IntoTheBlock’s data, the percentage of whale concentration went up from 4% in February 2023 to 9% in September 2024.

Source: IntoTheBlock
However, the rest of the metrics looked bearish. For instance, ADA’s Open Interest dropped while the NVT ratio registered a sharp uptick. This suggested that Cardano was overvalued, hinting at a price correction.
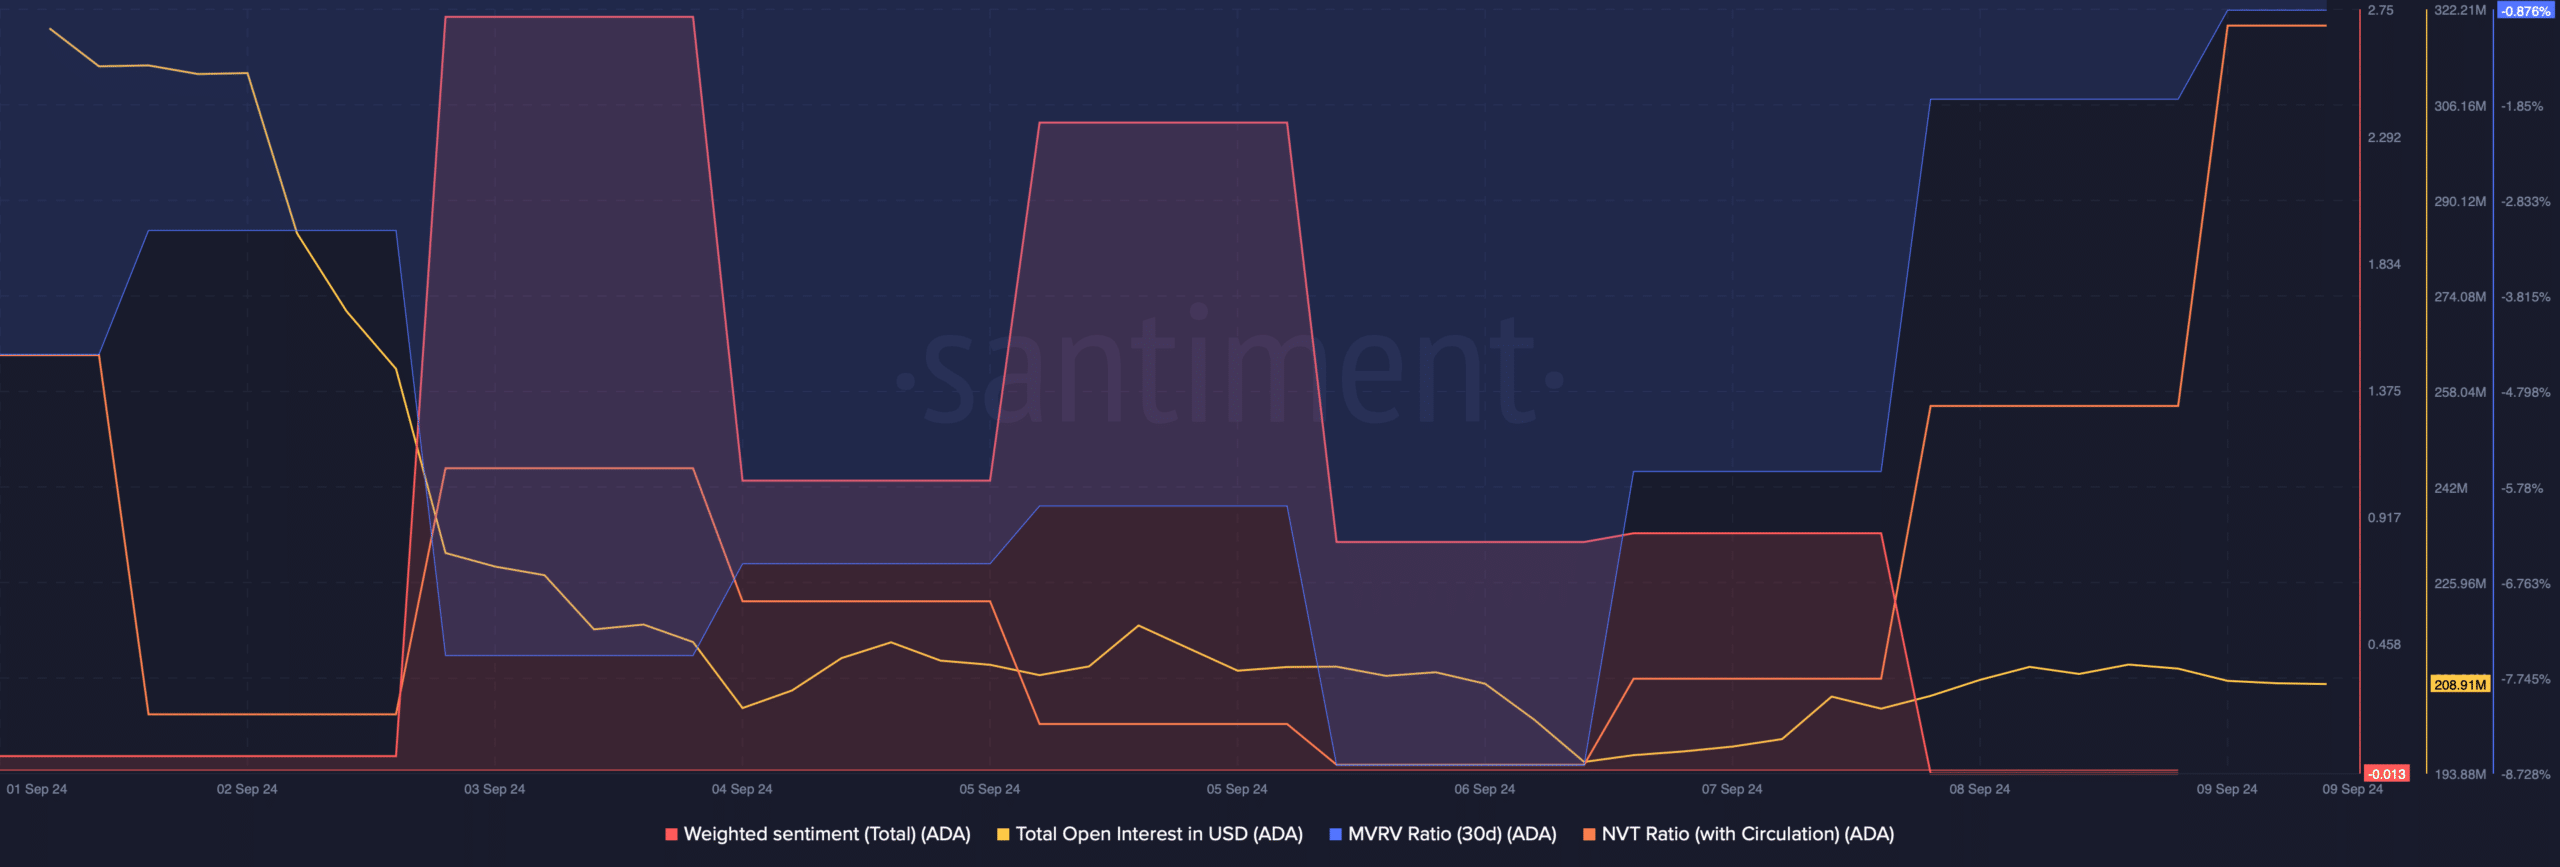
Source: Santiment
Its Weighted Sentiment also declined, meaning that bearish sentiments increased. Apart from that, at press time, ADA’s fear and greed index was in a “greed” zone.
Whenever the metric hits this level, it indicates that the chances of a price correction are high.
Therefore, we then checked ADA’s daily chart. The technical indicator displayed a bullish crossover. The Money Flow Index (MFI) also registered an uptick, suggesting that it was likely ADA to break above the bull pattern.
Realistic or not, here’s ADA’s market cap in BTC’s terms
If that happens, then ADA might first reach $0.45 in the coming days. A slip above that would allow the token to target $0.54. Going further north, the last stop before $1 could be $0.77.
Nonetheless, the Chaikin Money Flow looked bearish as it moved sideways near the neutral mark. In case the bears take back control, then ADA might drop to $0.3 again.
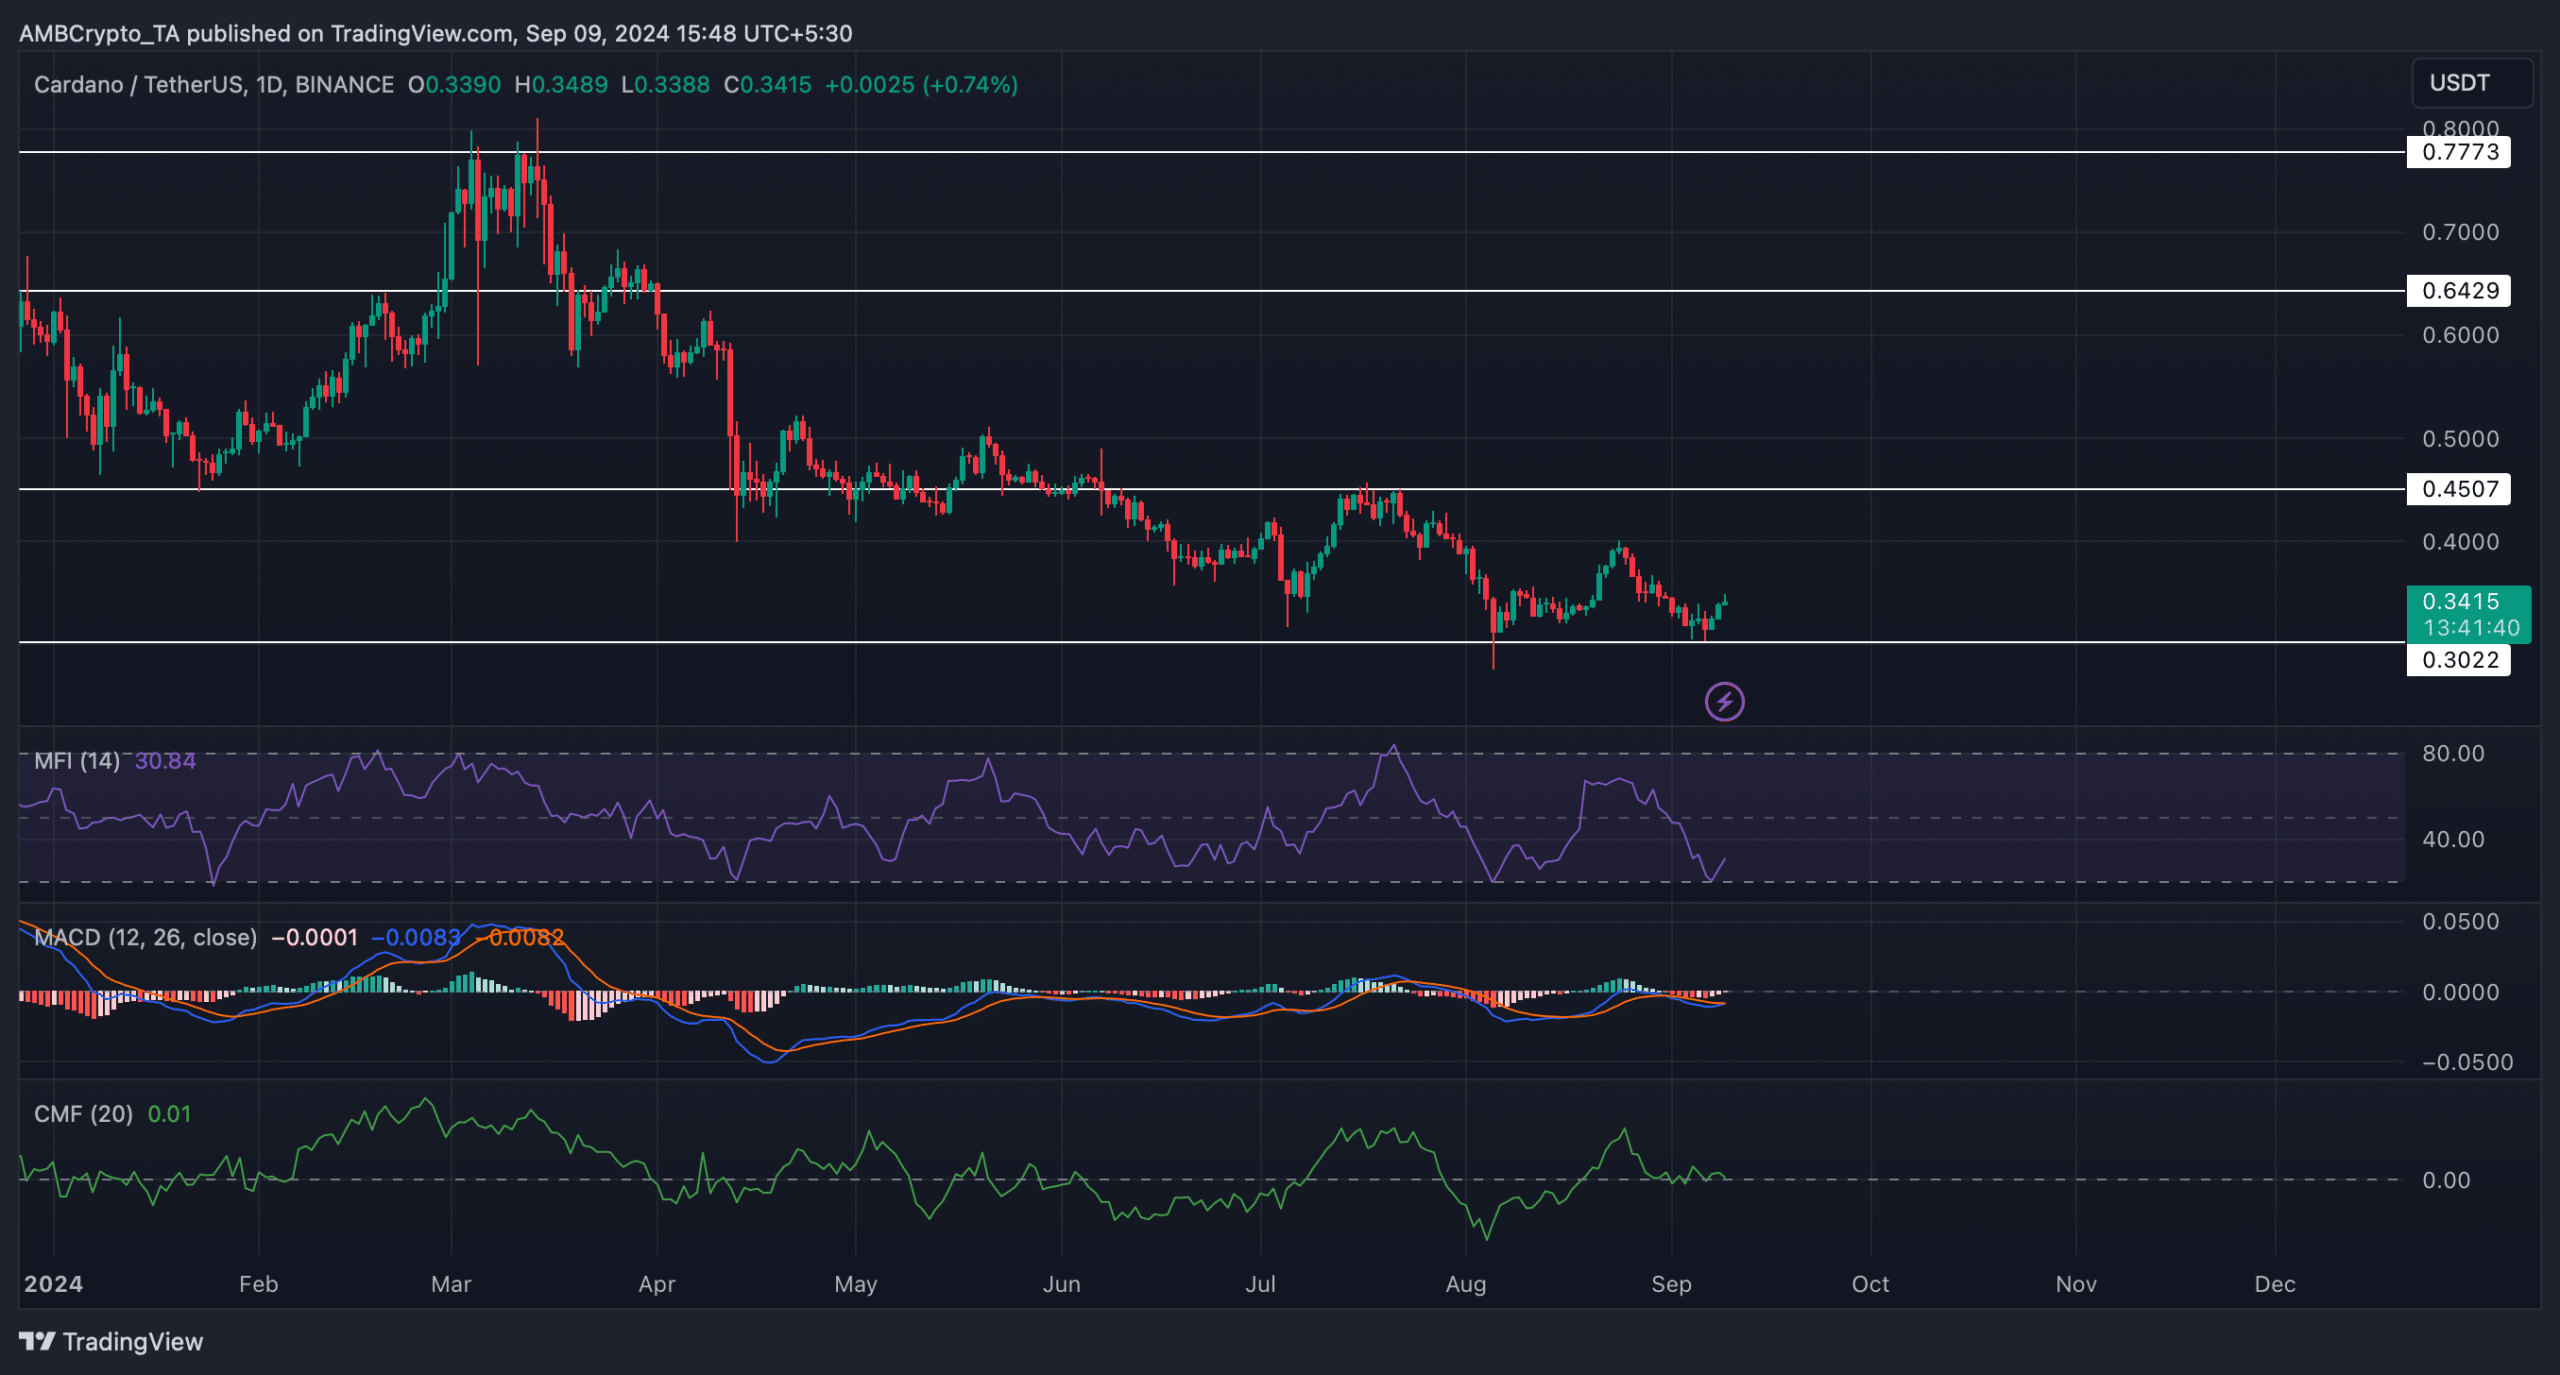
Source: TradingView


