Checking FLOKI’s breakout signs: More gains, or a reversal ahead?
Floki's price rally was accompanied by a surge in Open Interest, suggesting that speculators were eager to long the token.

- FLOKI managed to break its internal bearish structure and had a bullish bias.
- The lack of organic growth and sustainable demand could hinder the bulls’ efforts.
FLOKI [FLOKI] saw a 15 billion token burn proposal passed last week with an overwhelming majority. This encouraged investors about the deflationary nature of the memecoin. The bullish triangle chart pattern was also pointed out by analysts.
A recent AMBCrypto report highlighted the lack of new addresses being created despite the price growth in May. A rise in bearish positions was also spotted, both of which suggested the token lacked true strength.
Does the price action make up for the on-chain shortcomings?
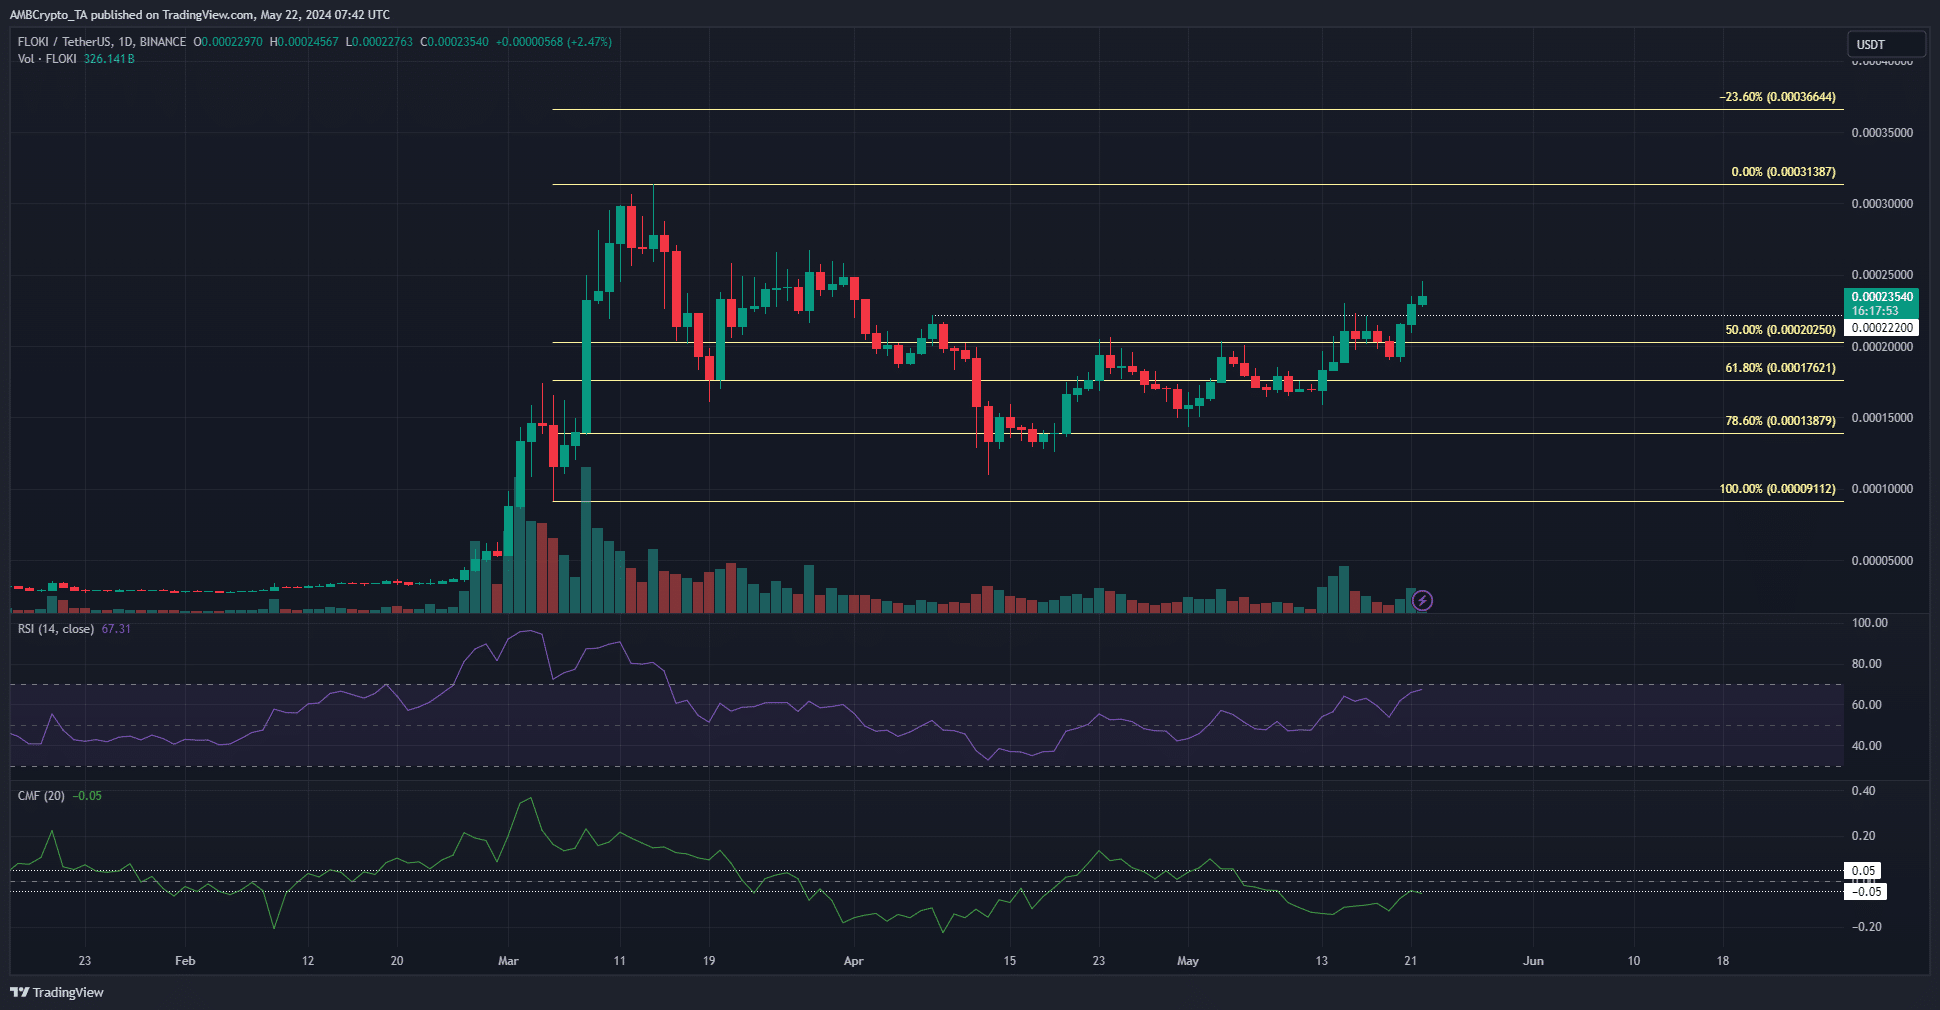
The technical indicators showed mixed signs. The daily RSI was firmly bullish with a reading of 67 but the CMF was below 0. This indicated significant selling pressure over the past ten days.
Despite this, the price was able to break a significant lower high made in April when FLOKI was in a retracement phase. This move was a sign of strength from the bulls and showed a bullish market structure.
The next targets are the $0.000313 and $0.000366 levels. The former is the March high while the latter is a Fibonacci extension level plotted based on the previous impulse move on the higher timeframe.
The short-term metrics signal bullish pressure was increasing
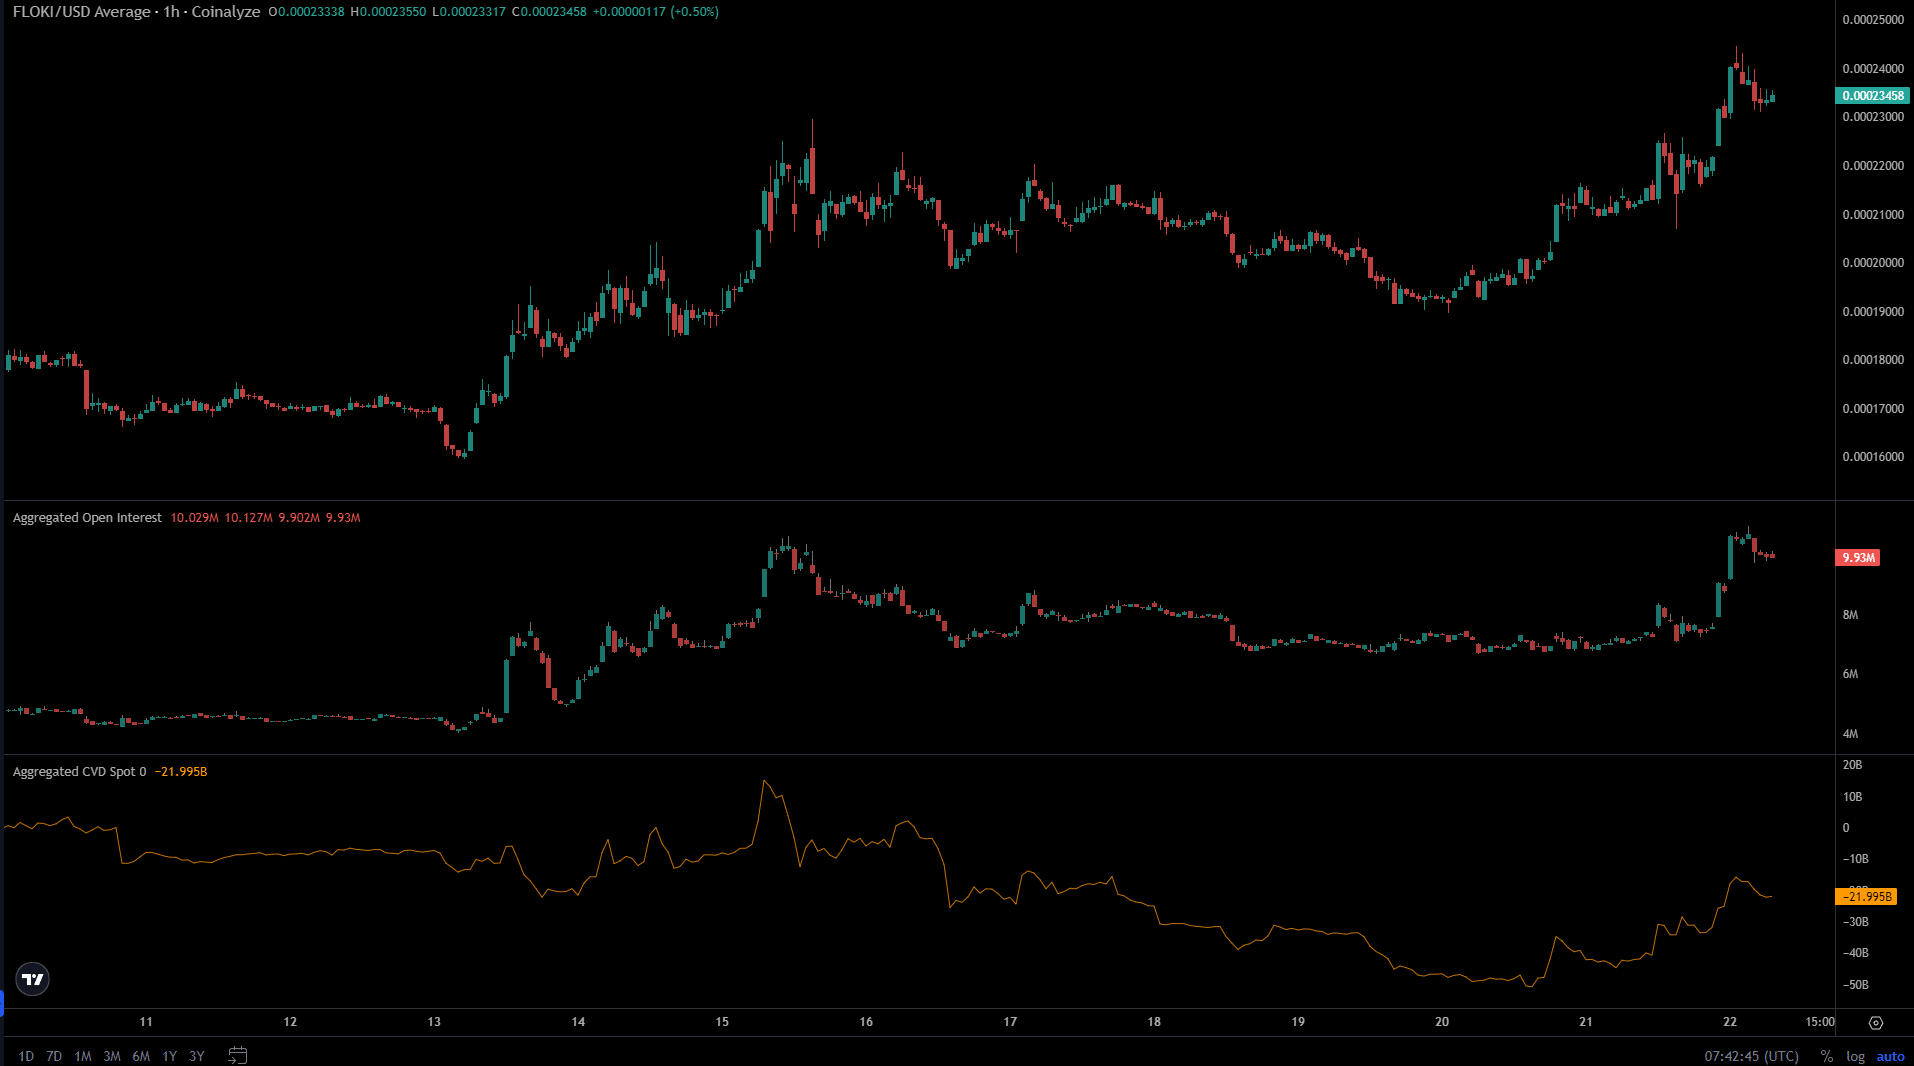
While the Chaikin Money Flow showed bearishness on the 1-day timeframe, the spot CVD on the 1-hour timeframe showed a turnaround was underway. It halted the previous week’s downtrend and has risen higher over the past 48 hours.
Realistic or not, here’s FLOKI’s market cap in BTC’s terms
The price rally from $0.0002 to $0.000234 was accompanied by a surge in the Open Interest as well. This showed speculators were eager to long the token and were convinced of more gains. Hence, the short-term sentiment was bullish.
Ideally, the $0.00021-$0.000225 region is retested as support before the next rally. In that scenario, it would present a buying opportunity. On the other hand, a price drop beneath this area would be a bearish outcome.
Disclaimer: The information presented does not constitute financial, investment, trading, or other types of advice and is solely the writer’s opinion.


