COMP faces critical $46 support – Will bears take over from the bulls?
The recent buying pressure could drive Compound prices higher.

- Compound had a bearish structure on the 1-day chart.
- Despite this, increased buying pressure and signs of accumulation meant a price move upward was possible.
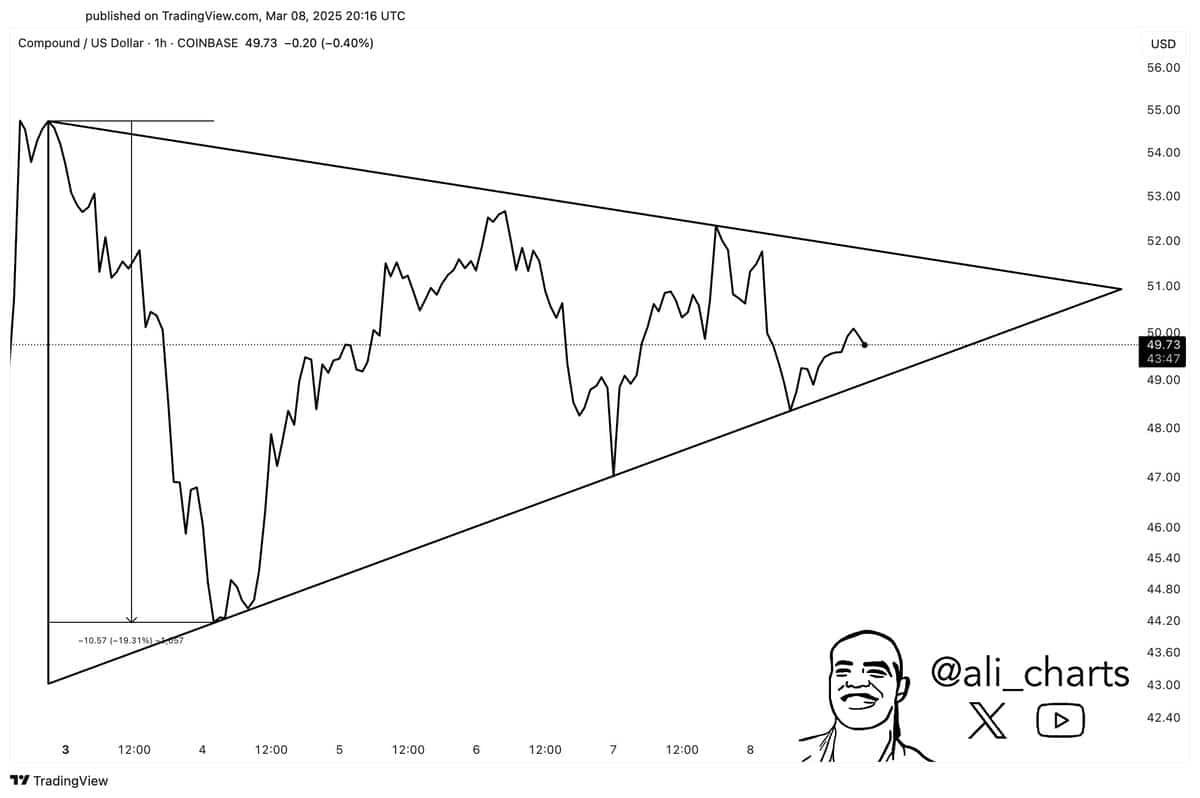
Compound [COMP] formed a symmetrical triangle pattern, observed popular crypto analyst Ali Martinez in a post on X (formerly Twitter).
This observation was based on the 1-hour chart, and a breakout could see a 20% price gain.
While the short-term price gains were promising, the longer-term on-chain metrics would also be of interest to investors. Analysis of the asset on the higher timeframes could also provide actionable insights for investors.
Selling pressure on Compound in decline
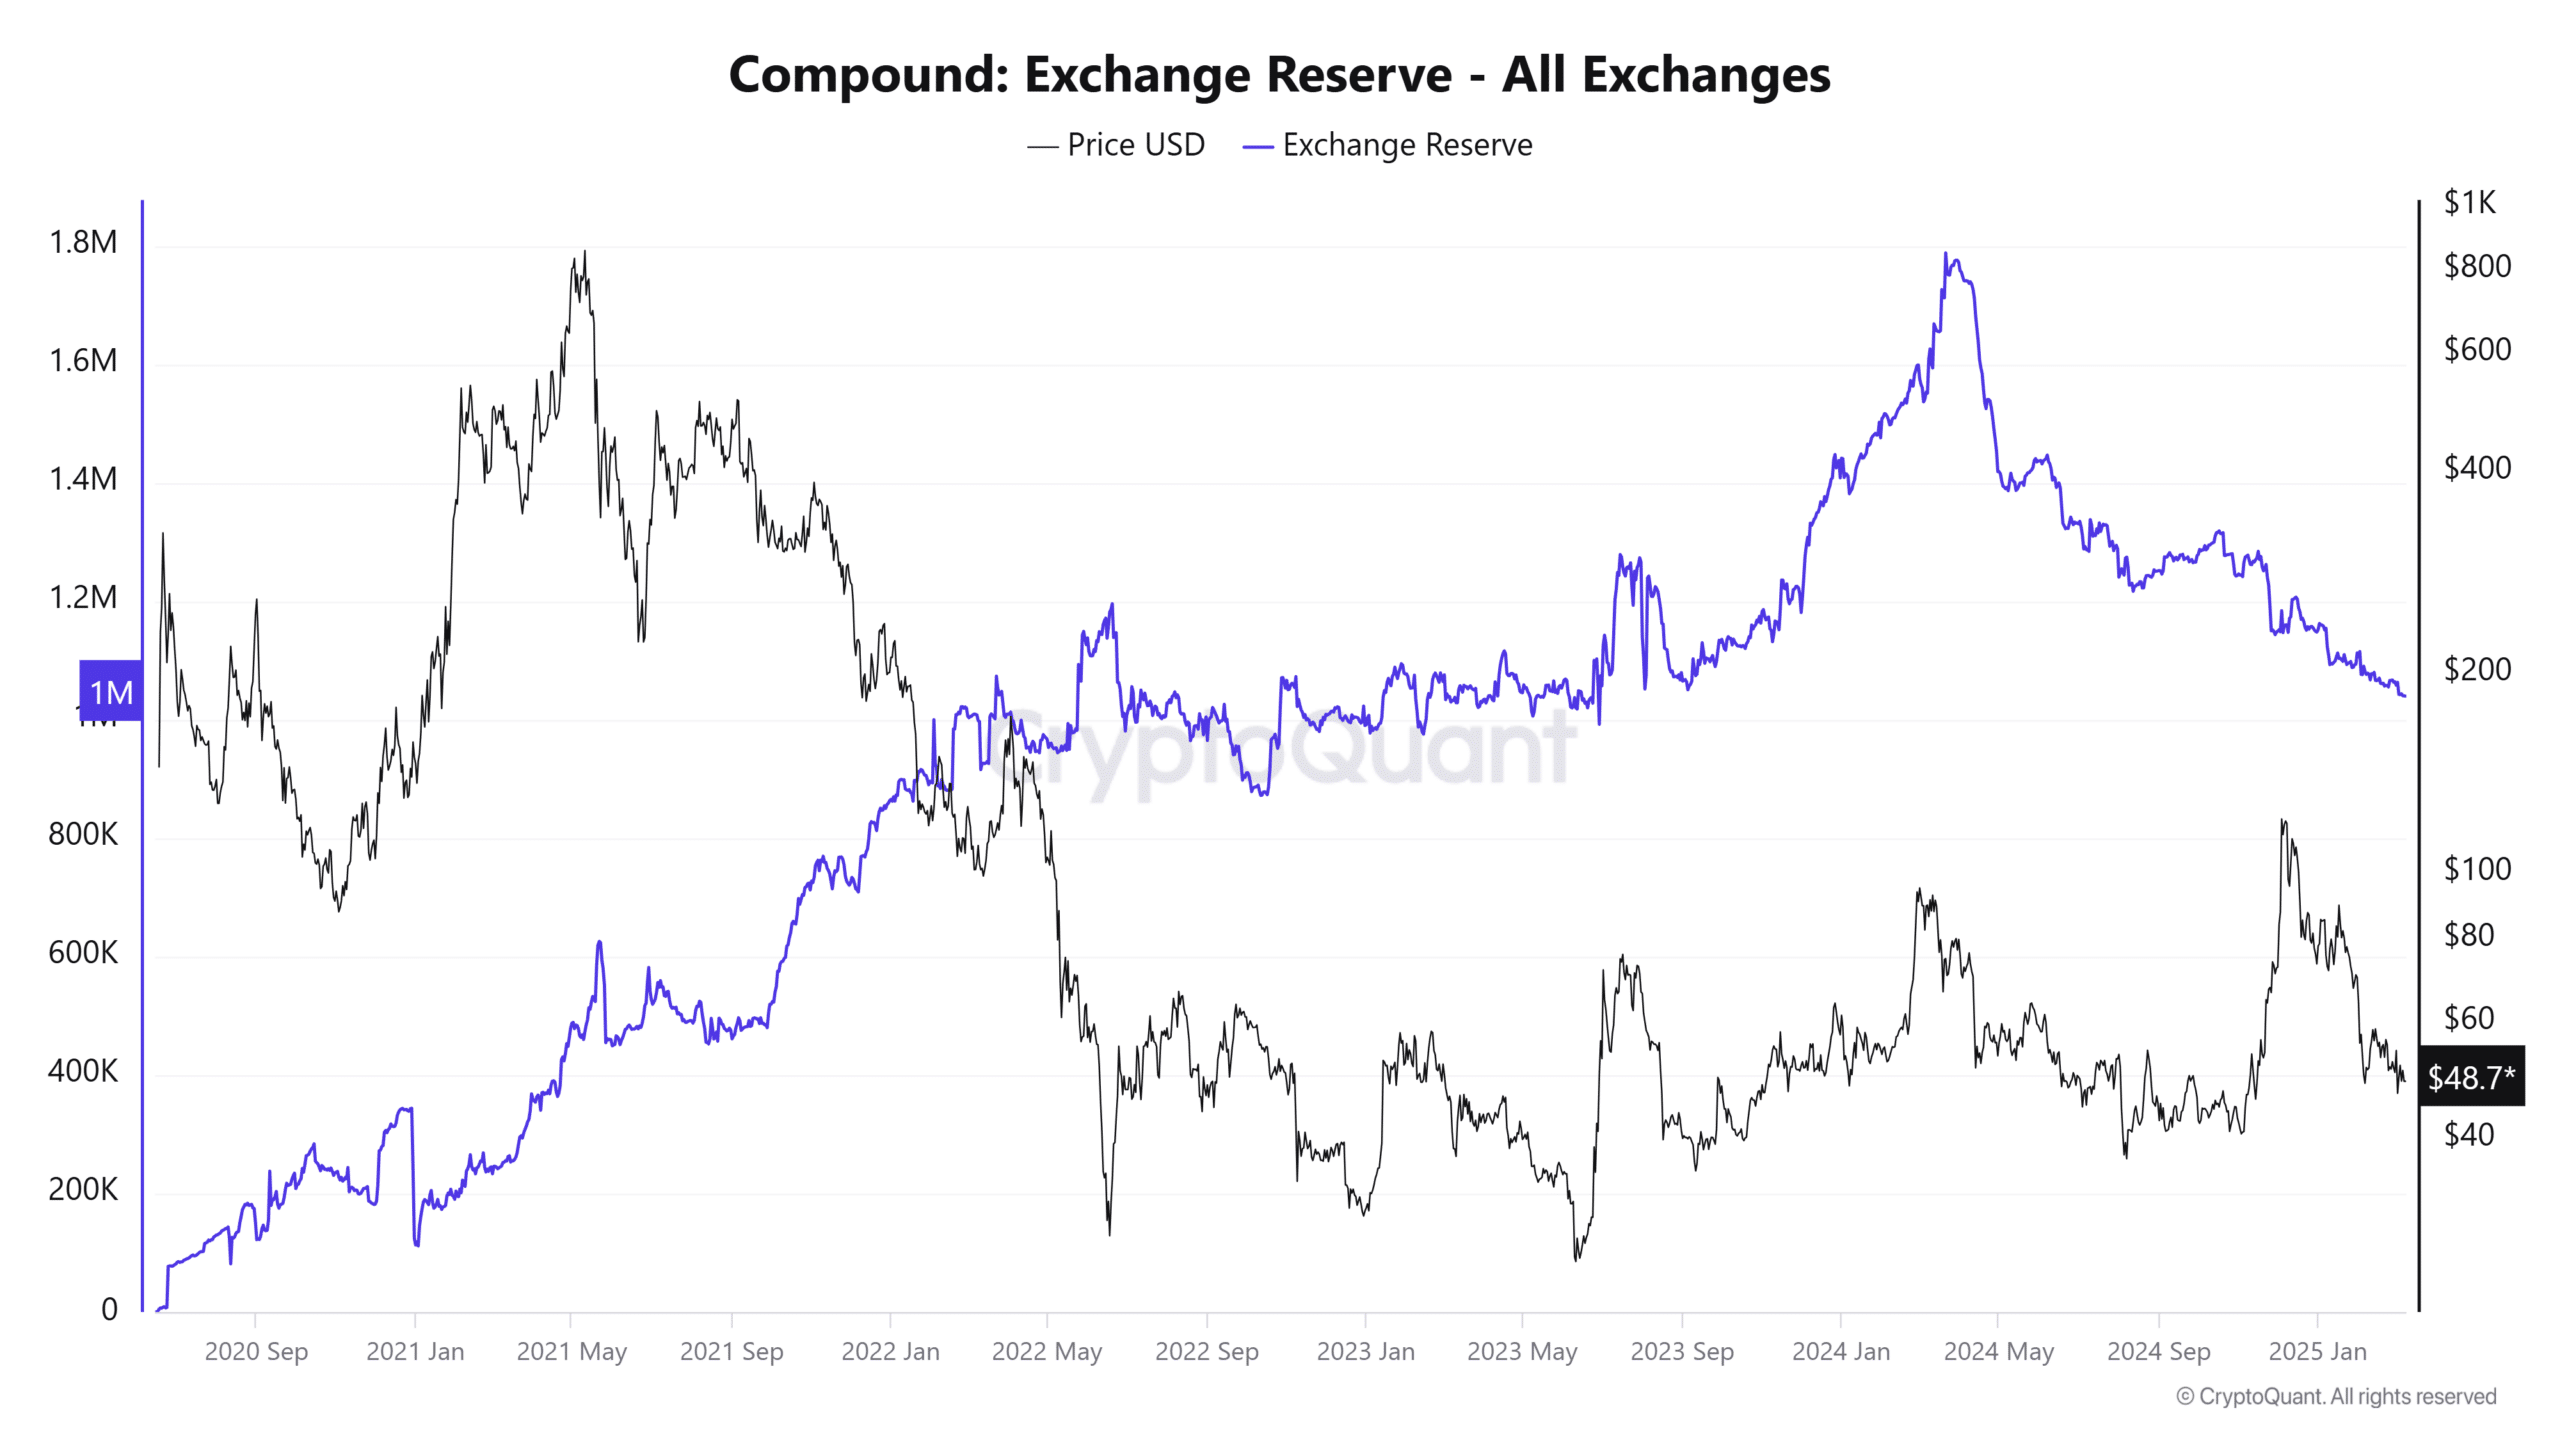
The exchange reserve of an asset gives a good indication of whether there is accumulation or distribution going on.
During the bear market of 2022 and early 2023, the exchange reserves had a slow uptrend. It was accompanied by spikes of COMP withdrawal from exchanges.
These withdrawals indicate token movement out of exchanges and likely into cold wallets, which would be a long-term bullish sign. In 2024, the exchange reserve of Compound has fallen lower.
This was a strongly bullish sign. Even during the swift rally in November, the reserves were falling. They continued to fall over the past three months as well, which can be taken as a sign of accumulation.
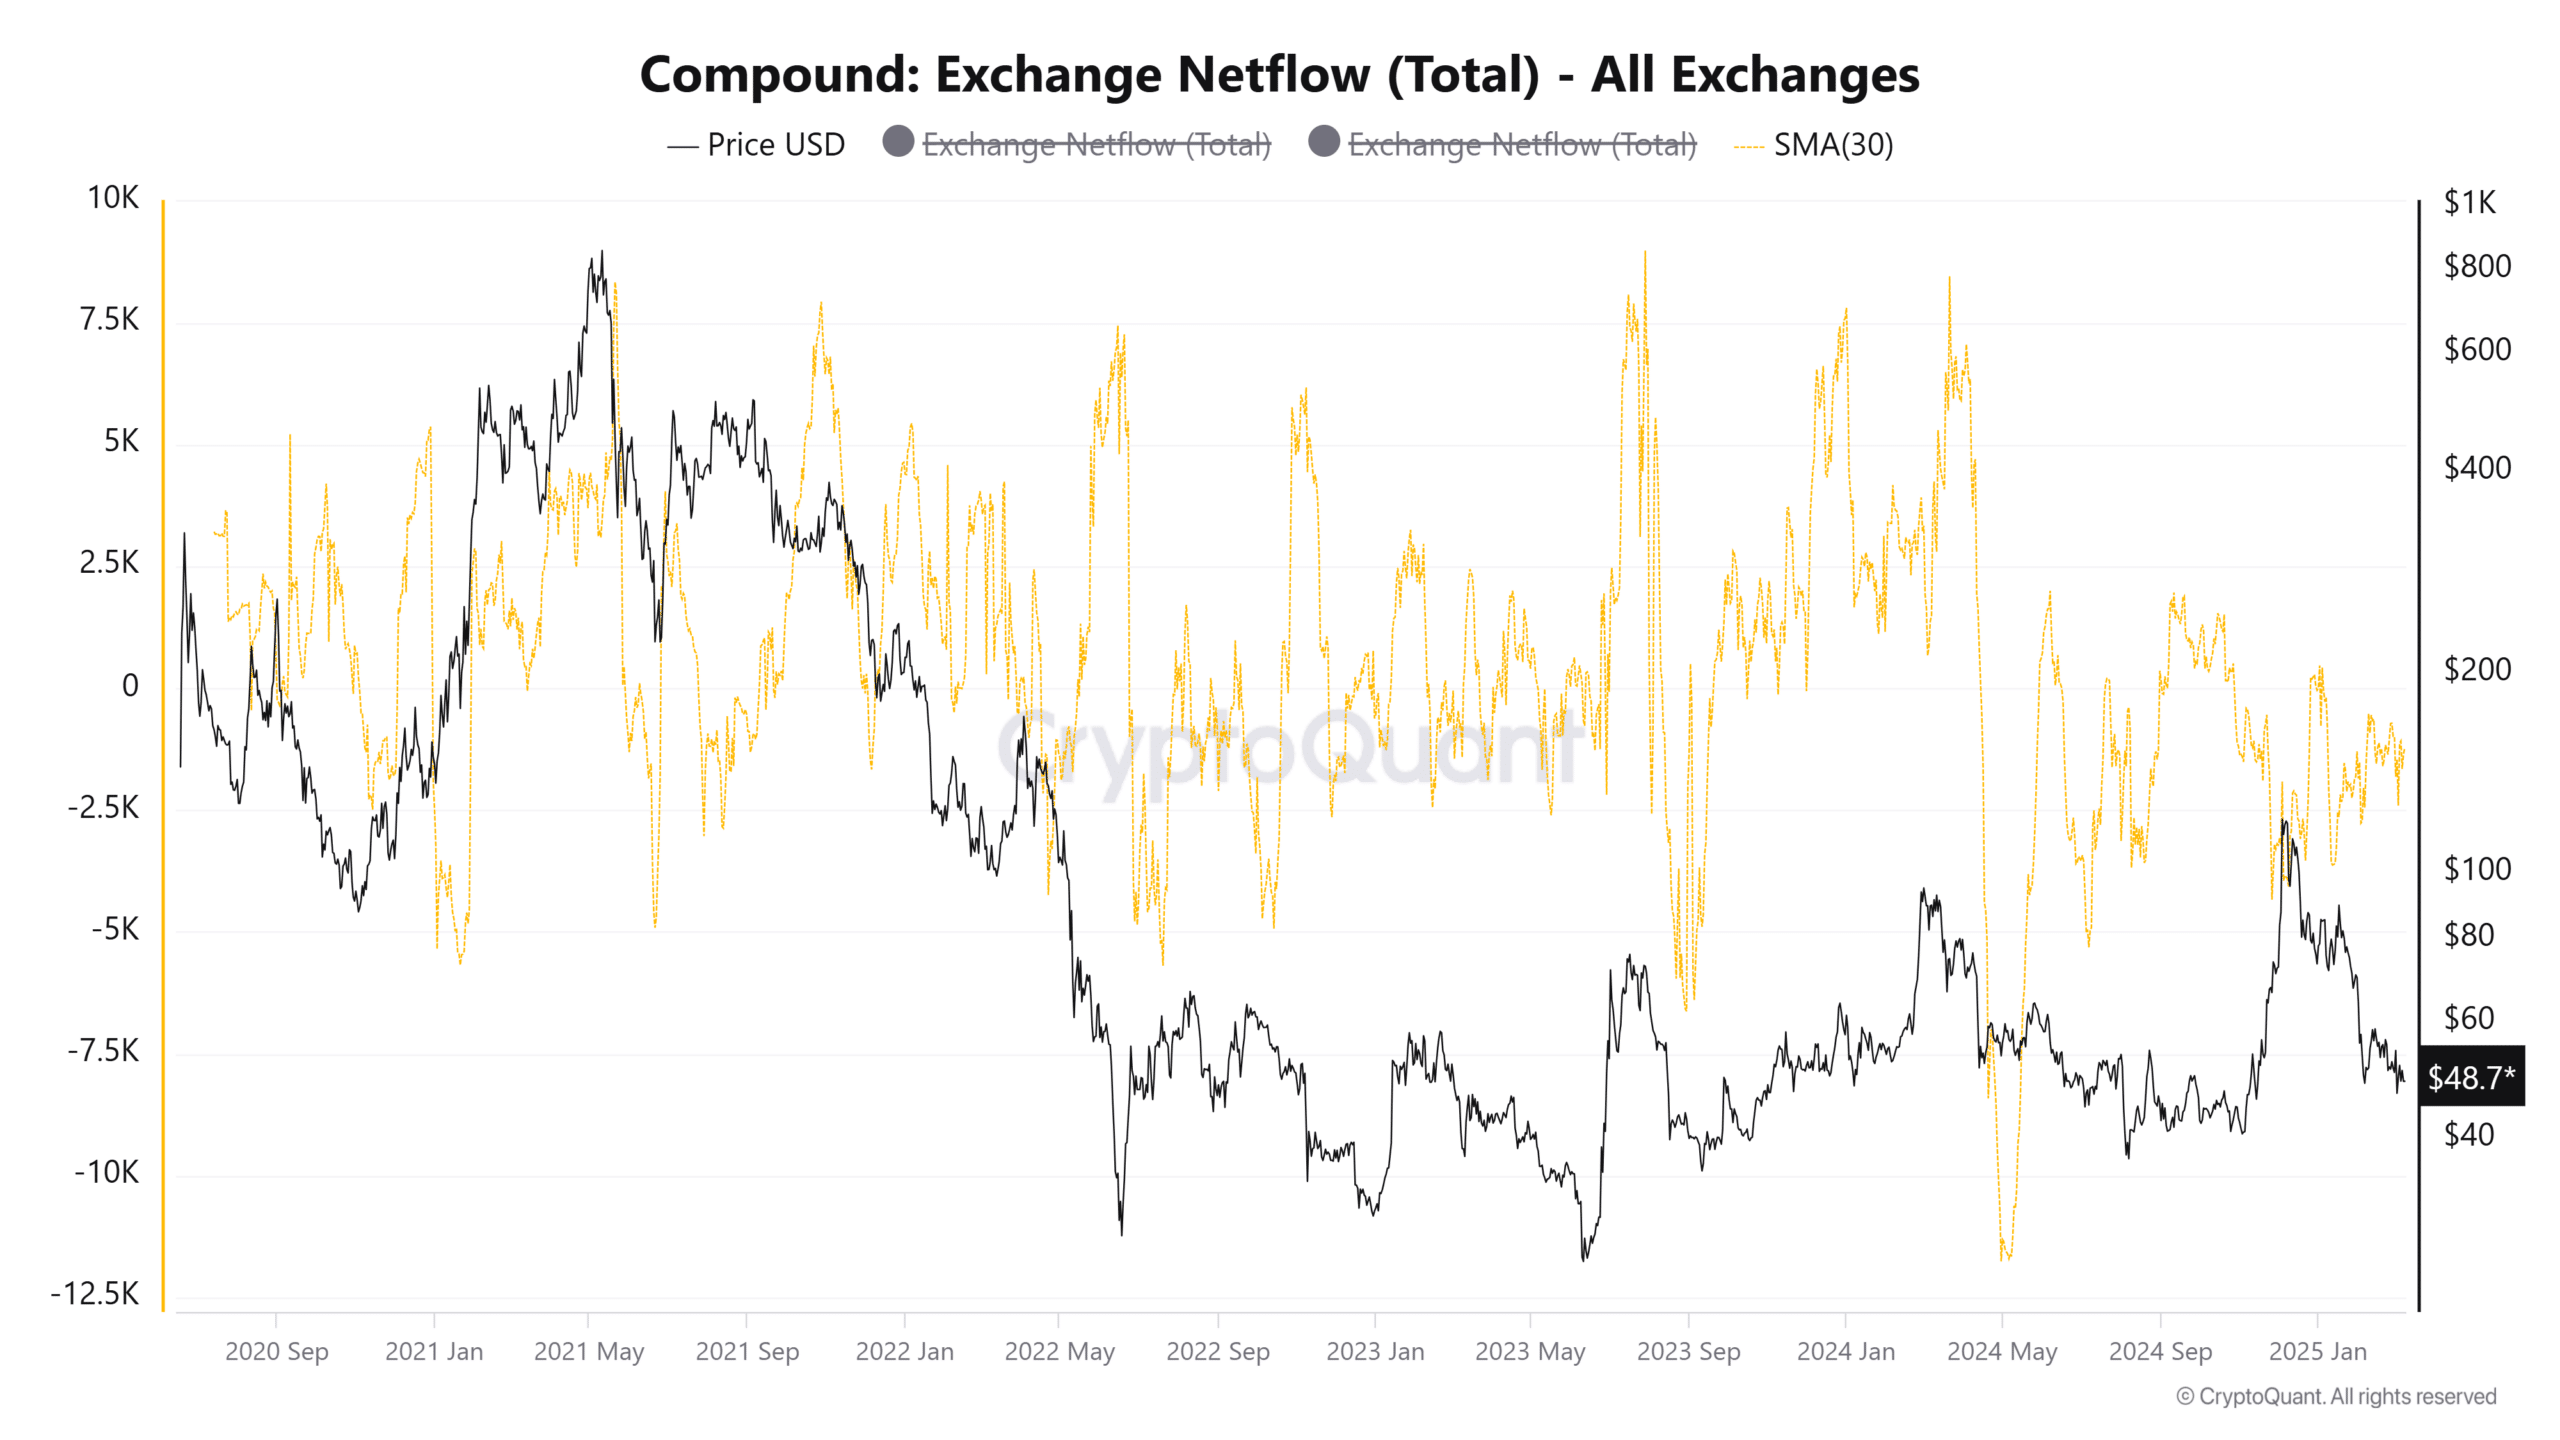
The 30-day SMA of the exchange netflows showed that September-early November 2024 saw strong inflows of Compound to exchanges.
This reflected rising selling pressure, on average, as coins are moved on exchange to sell or to be used as collateral for coin-margined derivative trades.
Since then, the trend has shifted toward outflows. Starting in the second week of January, the netflows have been negative, with most days seeing at least 1k COMP leaving exchanges.
This corroborates the exchange reserves finding.
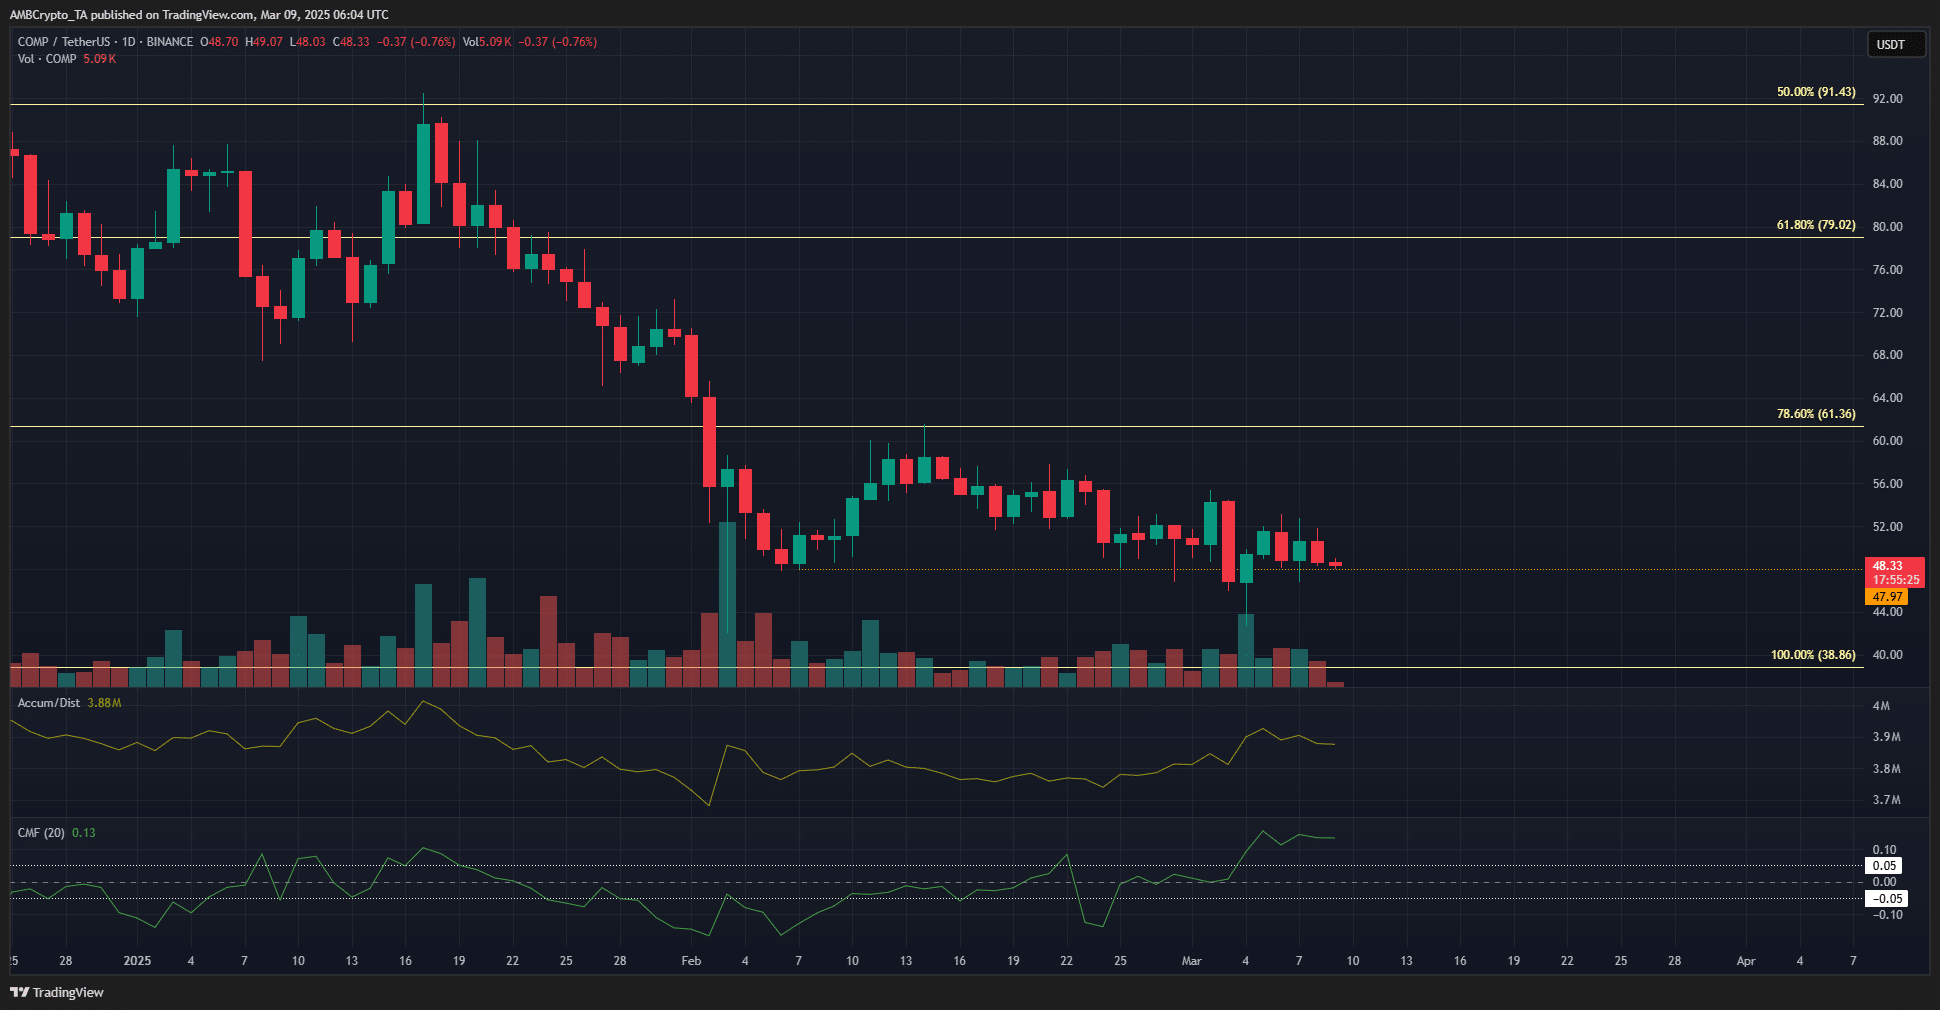
The COMP price action on the daily chart reflected a bearish outlook. The DeFi token has not made a new higher high since mid-January. At press time, it was trading just above the $48 support level.
A drop below $46 would signal an impending bearish move.
However, the A/D indicator has slowly crept higher over the past five weeks. The CMF burst above +0.05 to show significant capital inflows over the past week.
Together, the buying pressure could drive Compound prices higher.