
- CORE rallied beyond the $0.4775 resistance earlier.
- The rally was unlikely to last, despite the surge in trading volume.
Core [CORE] rallied 33% in 11 hours from the low on the 29th of March at $0.39 to $0.52 on the 30th of March. This brought many speculative traders to the CORE markets.
Data from Coinalyze showed that the Open Interest behind the token rose 116% in the past 24 hours.
Whether this rally can last was unclear. The higher timeframe charts remained firmly bearish. Usually, such strong rallies over a weekend imply a liquidity hunt.
Why CORE bulls would struggle
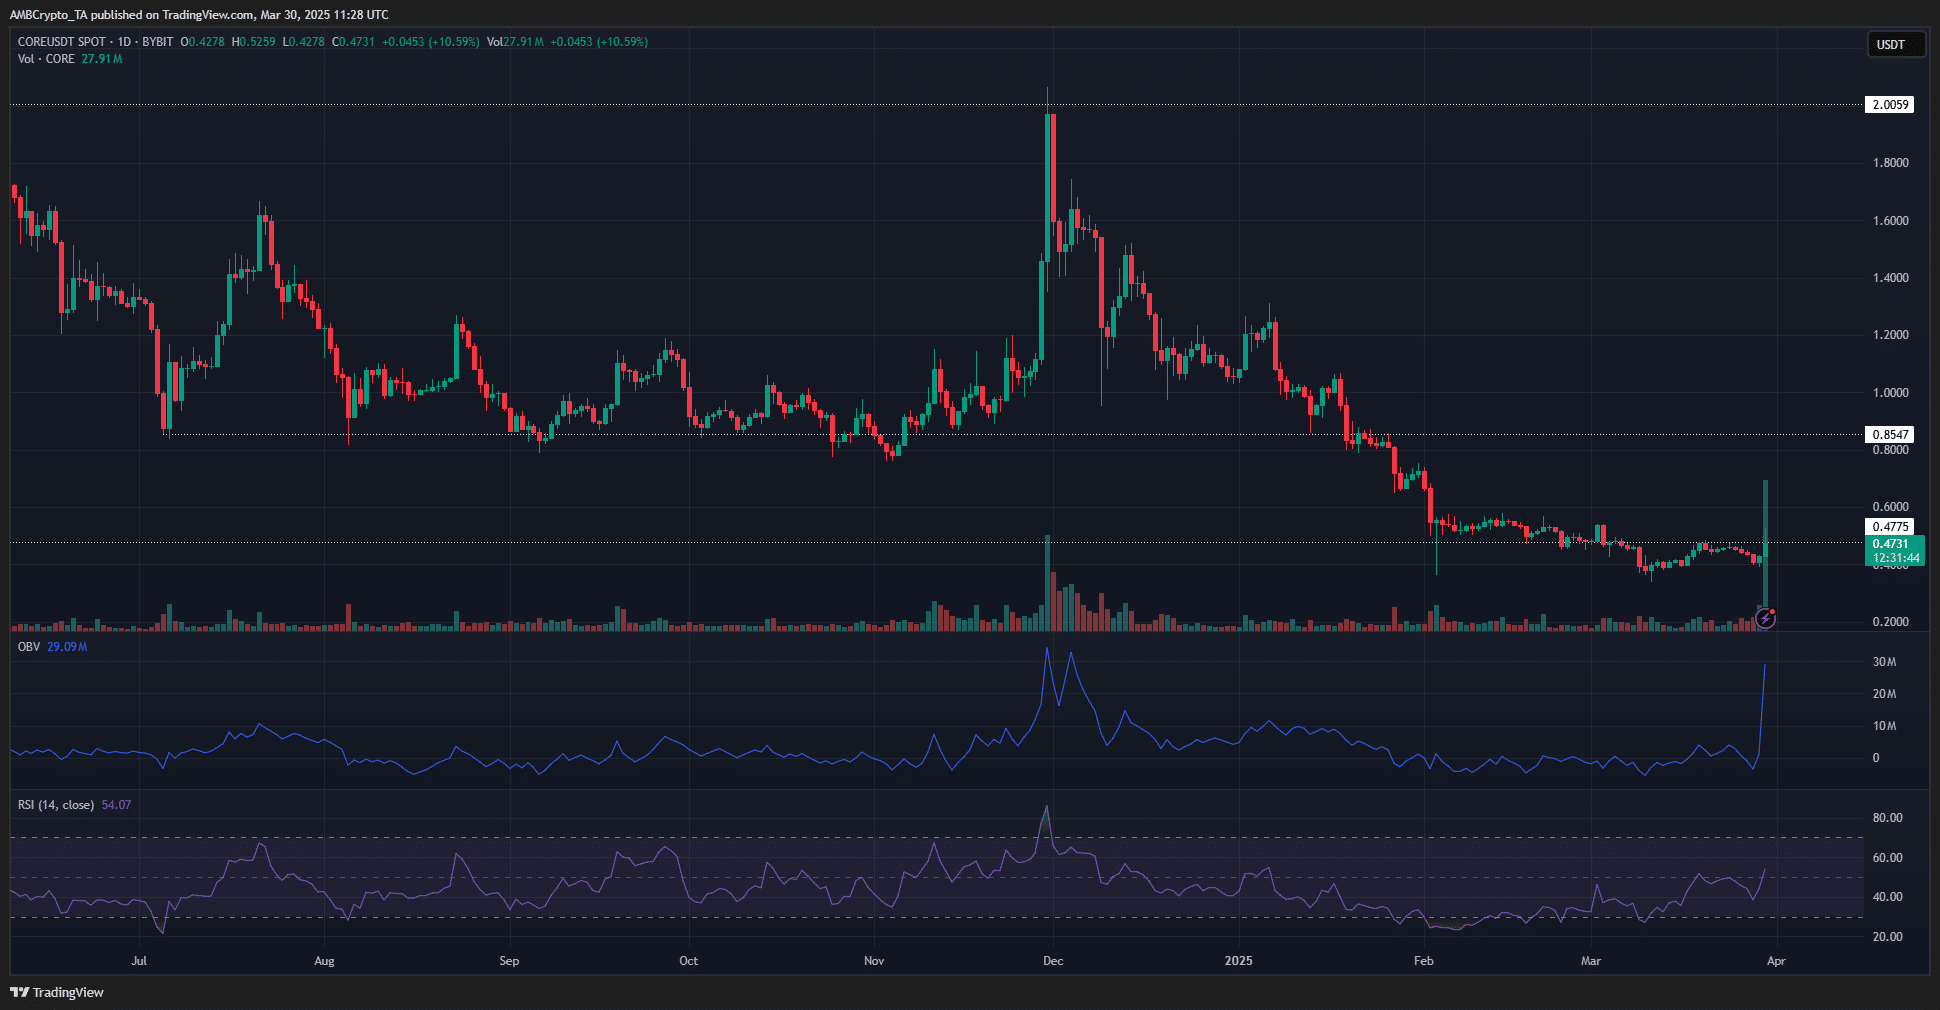
Source: CORE/USDT on TradingView
On the 1-day chart, CORE was obstinately bearish. Its recent rally retested the $0.4775 resistance level. This level served as a support in February, and before that, in February 2024 as well.
The bearish retest of this long-term S/R level meant it was likely that the Core DAO token price would fall lower in the coming days. However, its trading volume was extremely high over the weekend.
This caused the OBV to surge toward the December highs.
Meanwhile, the RSI was on the verge of closing a daily session above neutral 50. This would be another signal of a shift in momentum, but it might not mean an uptrend was imminent.
The higher timeframe trend must be respected, and investors would likely be better off being suspicious of this rally than giving in to FOMO.
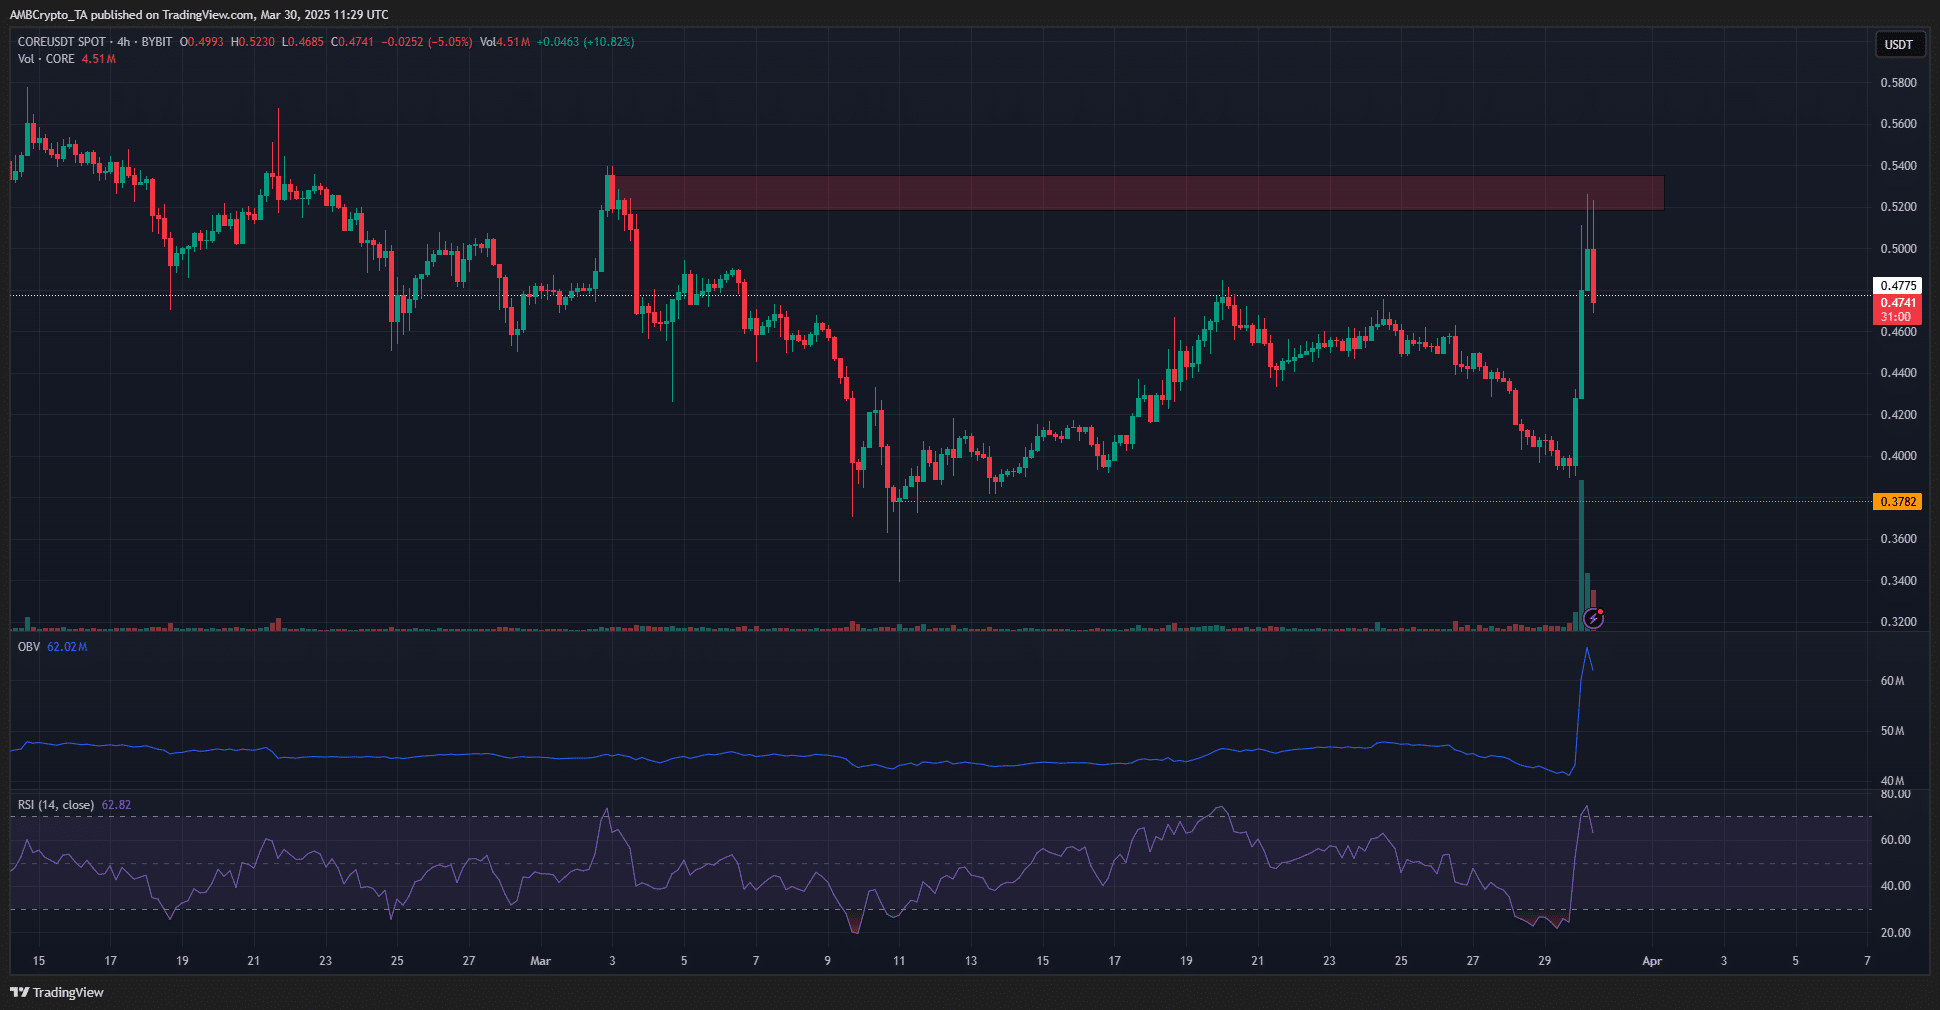
Source: CORE/USDT on TradingView
On the H4 chart, a clean rejection from the bearish order block from earlier in March at $0.52 was seen. The price was retesting the $0.4775 level as support, but it might not hold out.
Quick gains over the weekend, when trading volumes are usually low, meant the price action was more susceptible to the actions of larger market participants.
The $0.378 was the next support level to watch. A move beyond $0.52 would give CORE bulls some more food for thought.
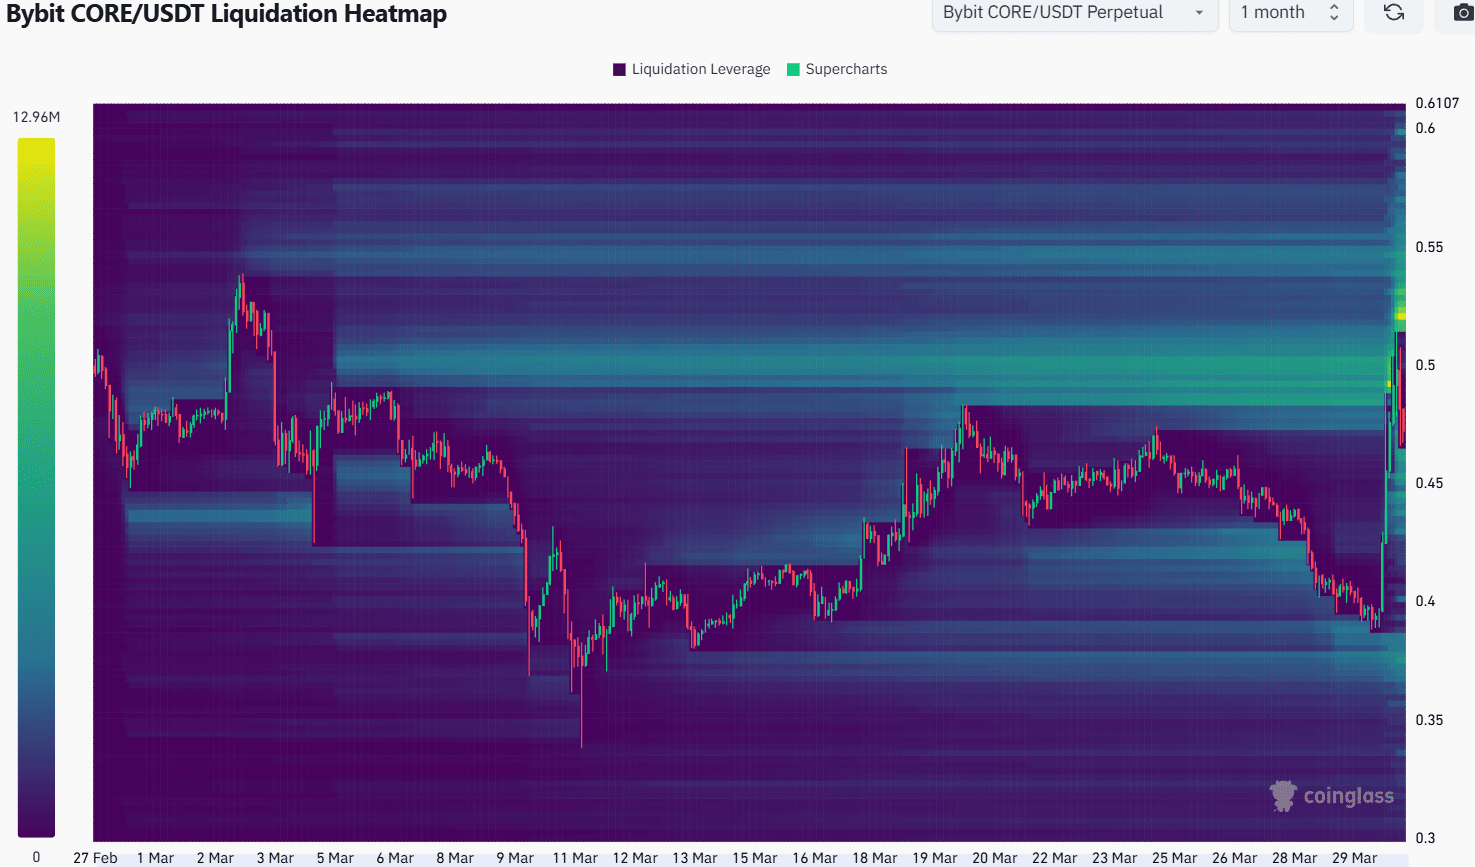
Source: Coinglass
The liquidation heatmap highlighted the $0.5 region as a magnetic zone over the past month. The recent price action saw this liquidity pocket swept.
In the process, a stronger magnetic zone filled with short liquidations cropped up at $0.52.
Therefore, it was likely that CORE would see more volatility in the coming days. Another test of the $0.52-$0.53 area would likely offer an opportunity to short-sell CORE.
Disclaimer: The information presented does not constitute financial, investment, trading, or other types of advice and is solely the writer’s opinion