Cosmos, Chainlink, GALA Price Analysis: 24 January

As Bitcoin struggled to cross its 4-hour 20-SMA, Cosmos, Chainlink, and Gala continued to flash bearish near-term technicals. After a huge spike in selling volumes, Chainlink had to defend the $15.16-zone to prevent a further breakdown.
Cosmos and Gala’s RSI saw reversal patterns while their prices still swayed below the 20-50-200 SMA.
Cosmos (ATOM)
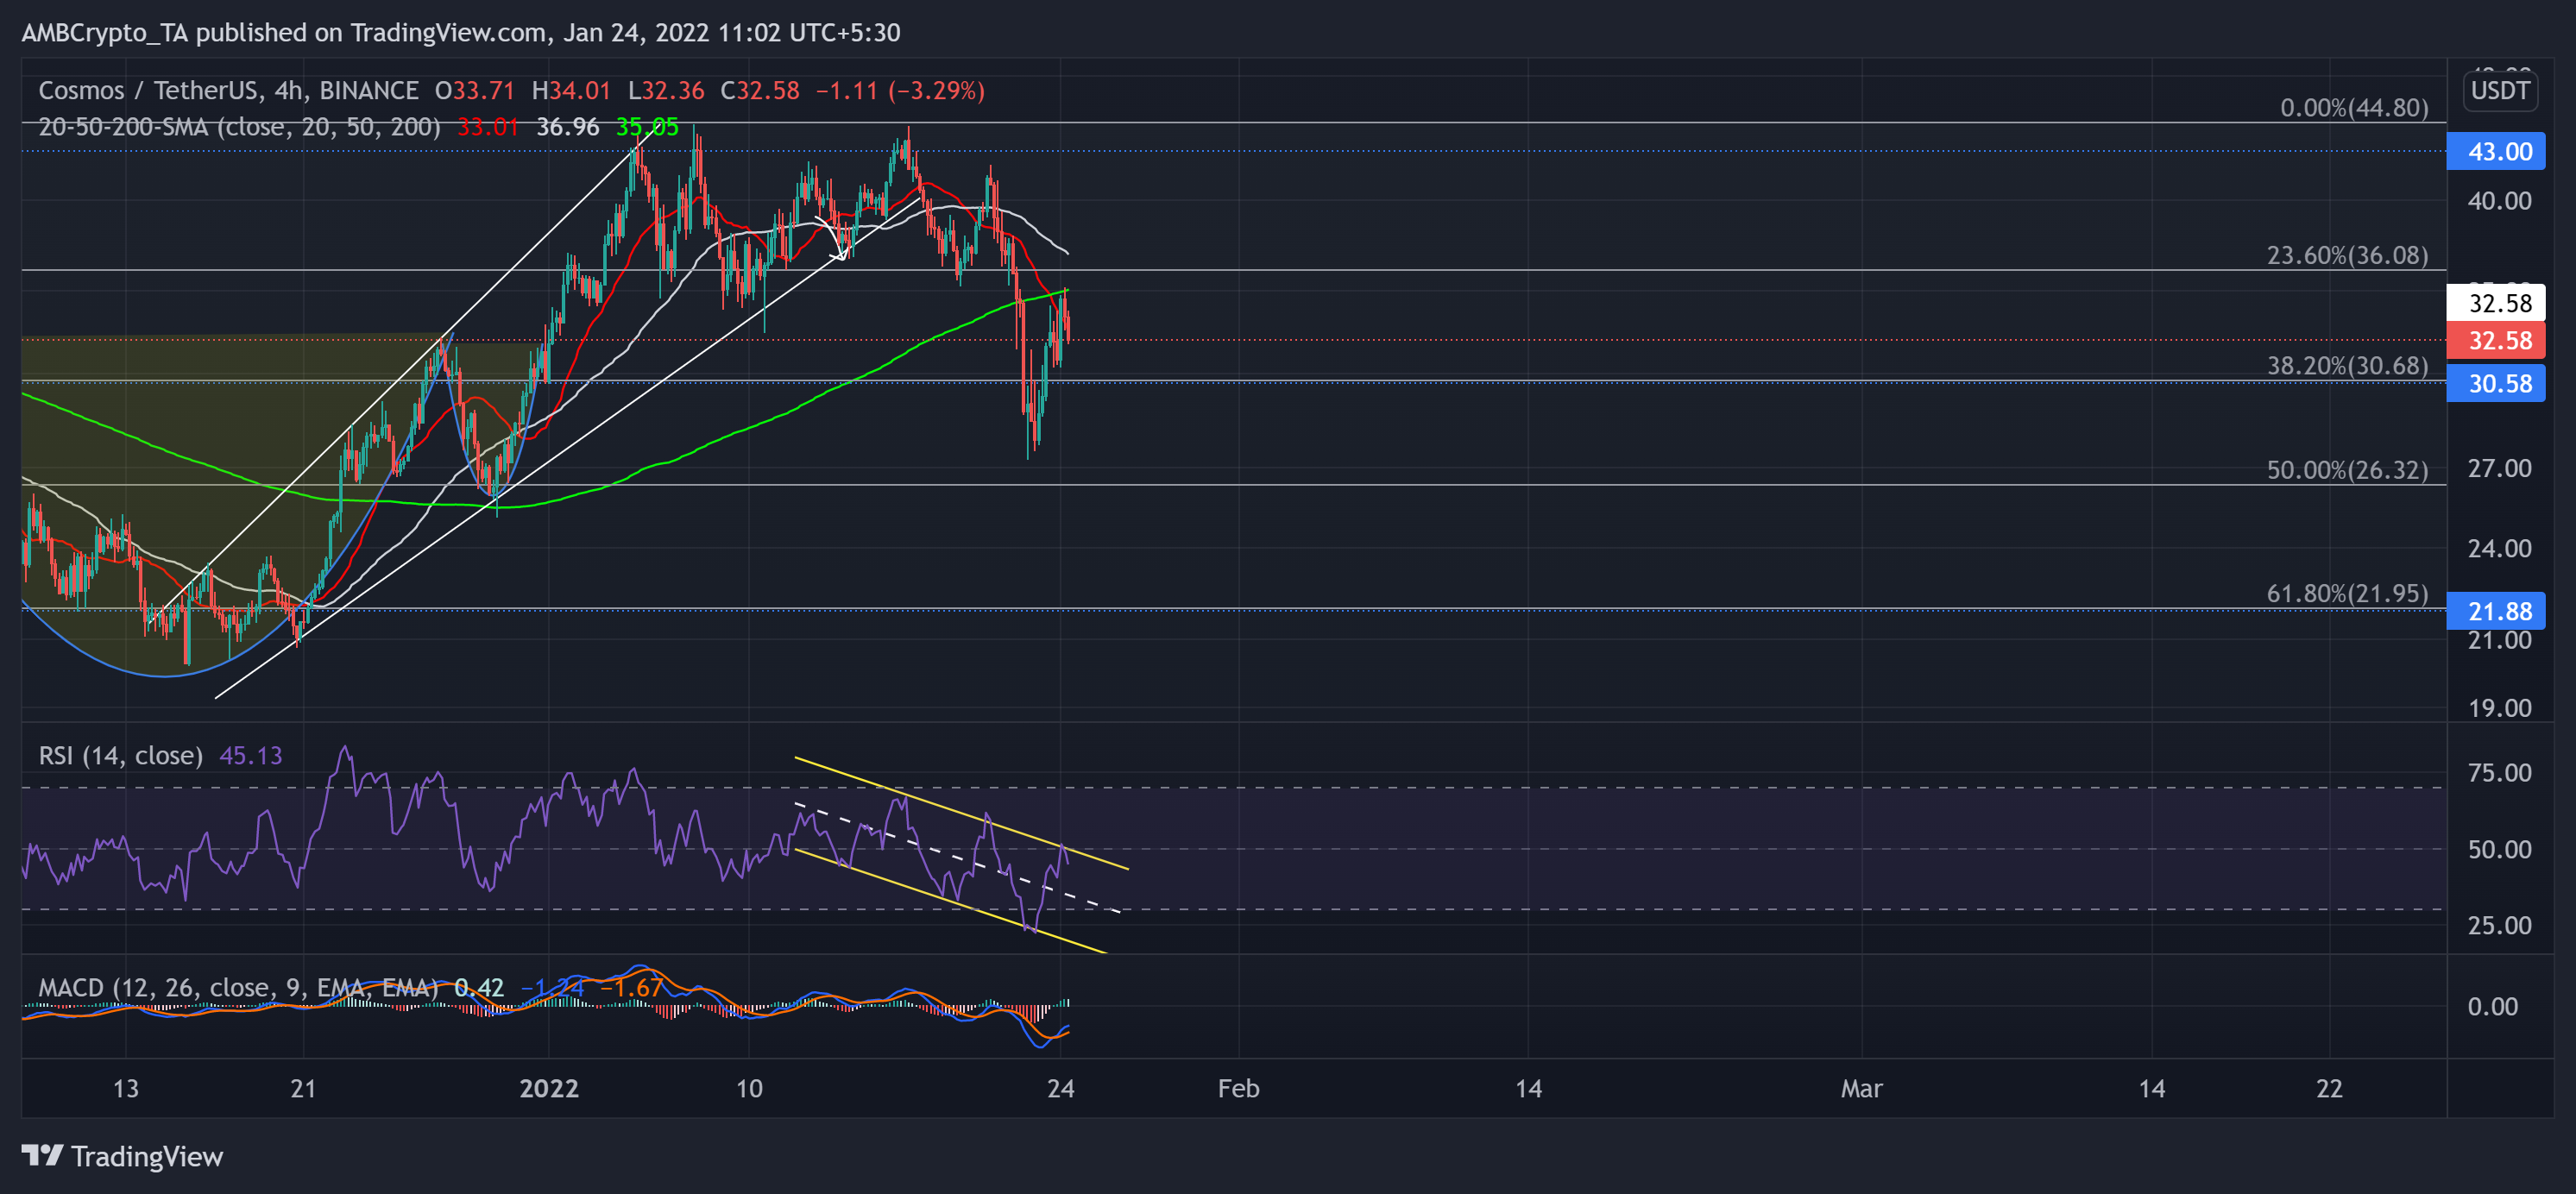
After retesting the $32.58-level for over seven weeks, the bulls finally initiated an inverse head and shoulder breakout on 1 January. The alt saw a staggering 79.61% ROI (From its 29 December low) and rallied toward its 5-week high on 7 January.
While the bears ensured the $43-mark resistance, the bulls kept defending the 23.6% Fibonacci support until 21 January. The recent sell-off led ATOM to lose 35.6% of its value and 38.2% support.
Meanwhile, the 20 SMA (red) plunged below the 50-200 SMA, confirming the increasing selling influence. Over the past day, bulls reclaimed the 38.2%-level, but could not cross the 200-SMA.
At press time, ATOM was trading at $32.58. The RSI saw a down-channel (yellow) after finding resistance at the midline. It exhibited a bearish edge in the near term. On the other hand, the MACD’s histogram found a close above the equilibrium, but its lines still chose the sellers.
Chainlink (LINK)
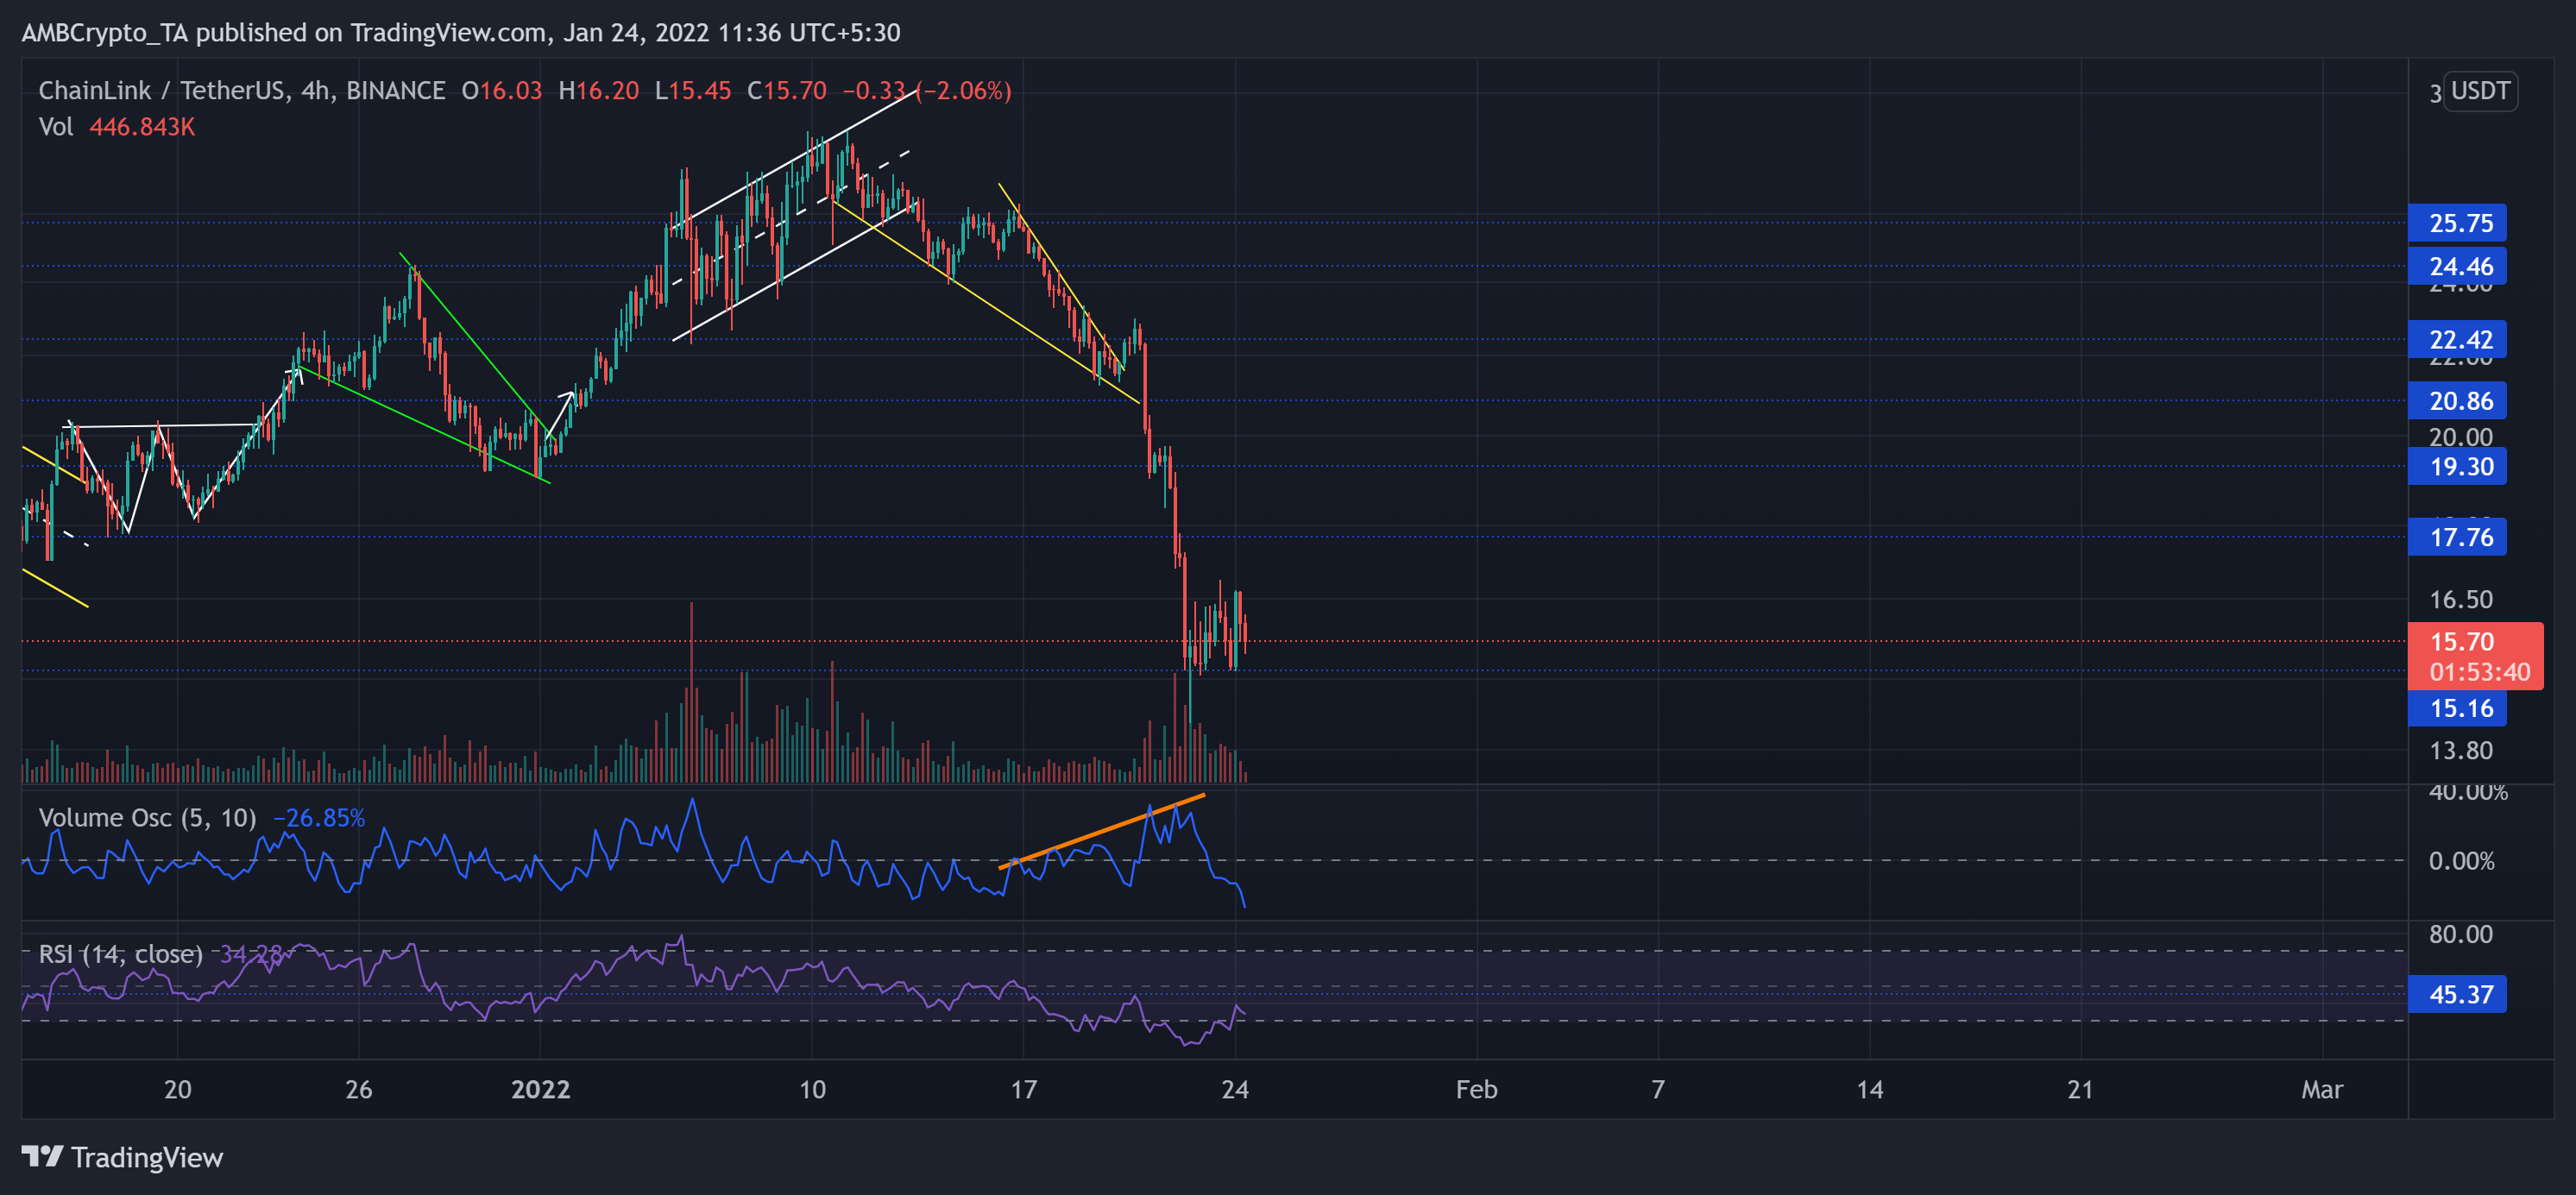
LINK’s bulls breached multiple resistance levels at $20.86, $22.42, and $24.46 until the sellers stepped in at the $25.75-mark on 16 January. As a result, the alt marked a falling wedge (yellow) on its 4-hour chart. It lost 45.67% of its value (From 16 January) and poked its six-month low on 22 January.
The recent bearish candlesticks were supported by high volumes, as evidenced by the Volume Oscillator. This reading entailed a strong selling influence. Now, the $15.16-zone becomes vital for the buyers to step in and stall the sell-off.
At press time, LINK was trading at $15.7. The alt’s RSI still hovered in the oversold region. Crossing the 45-mark is crucial for the bulls to support the recovery phase.
GALA
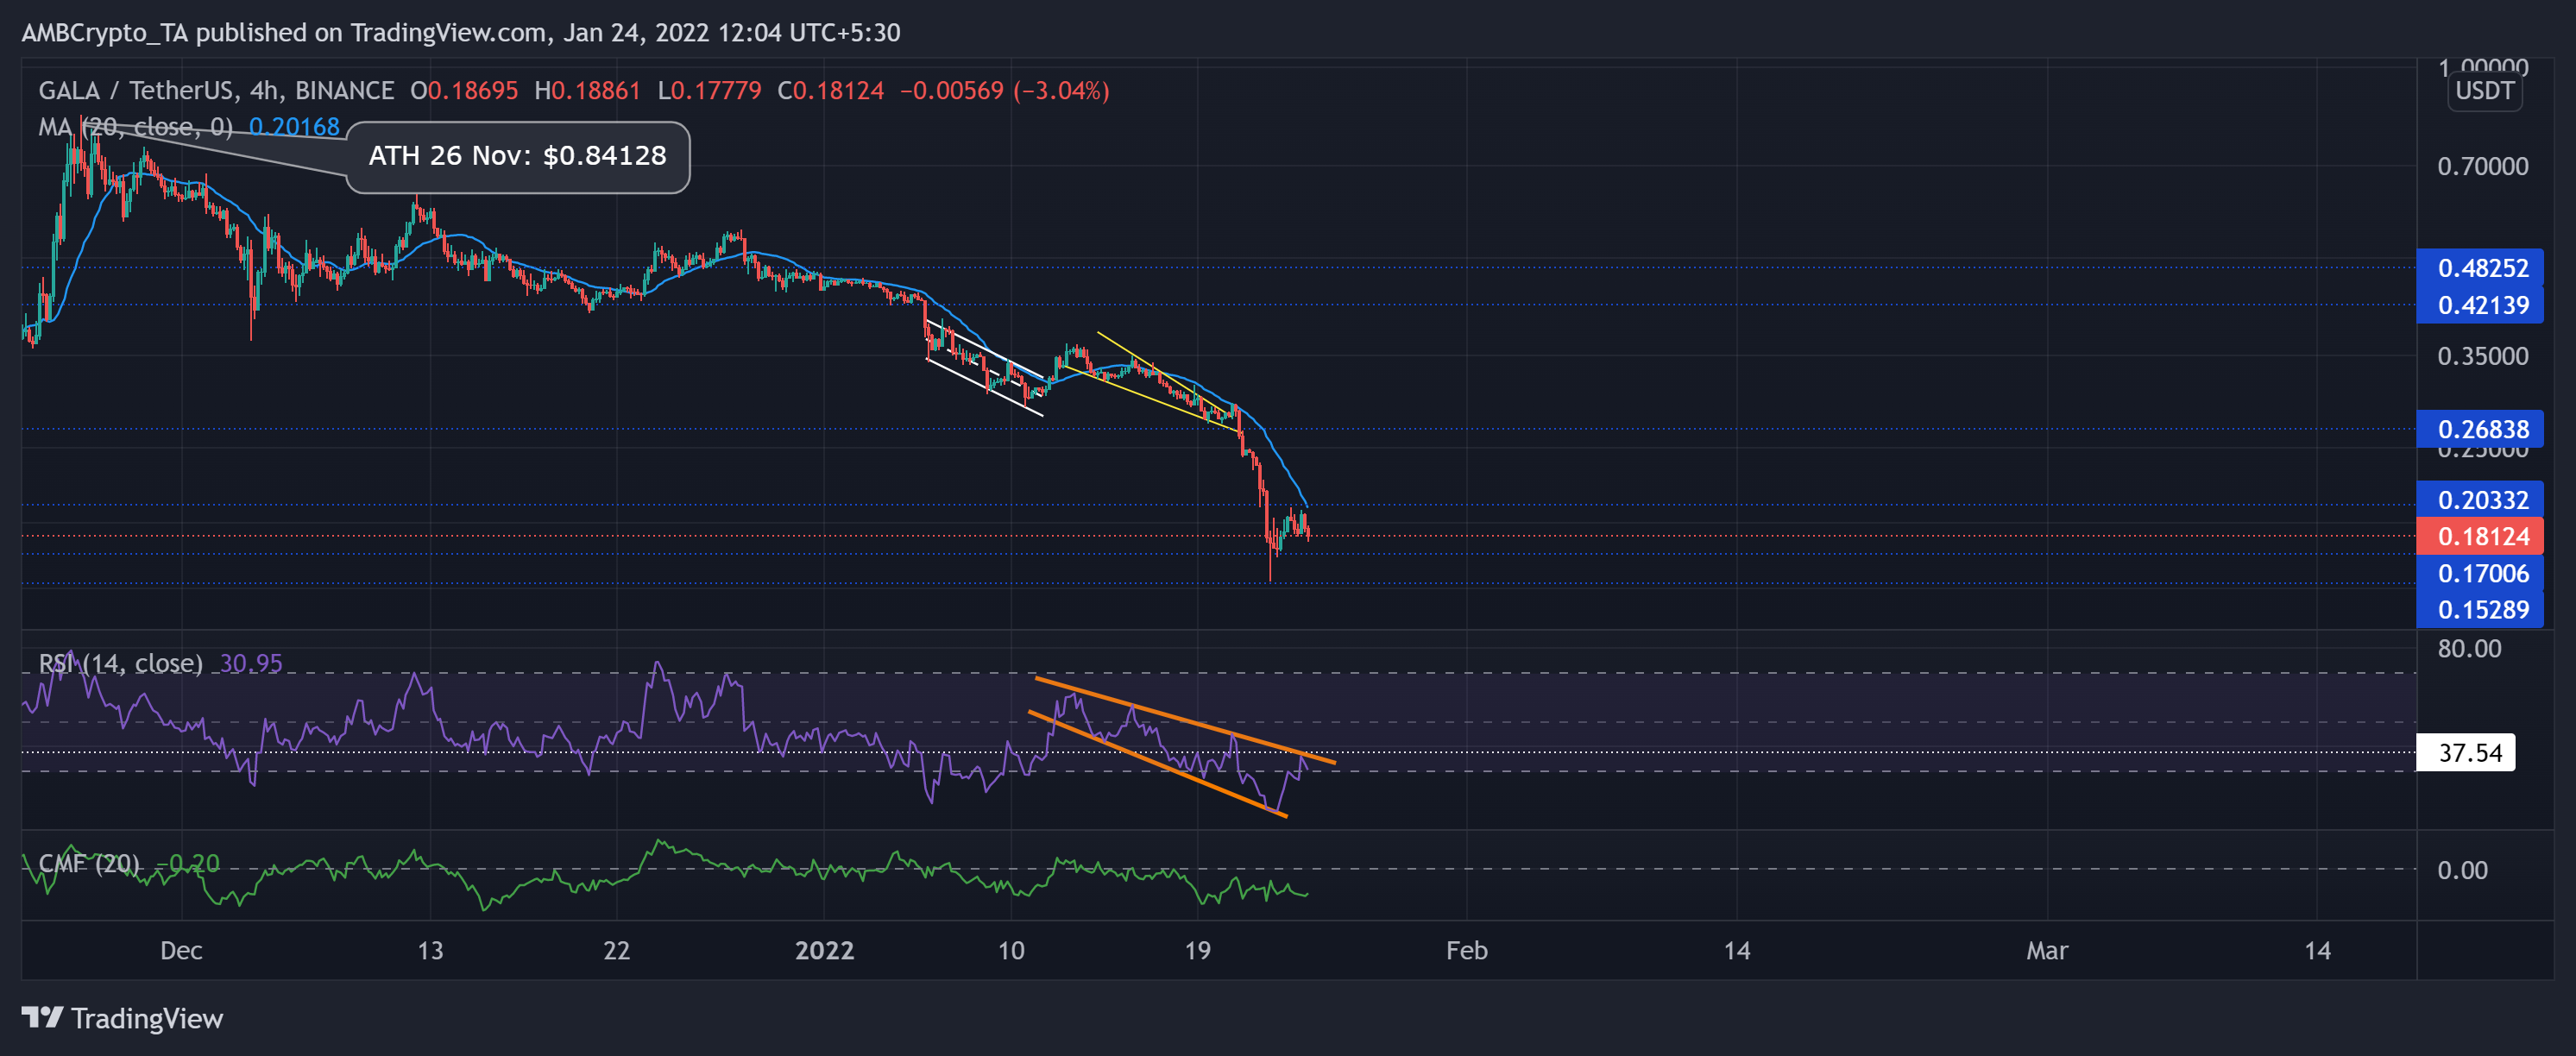
Since hitting its ATH on 26 November, GALA persistently marked lower peaks and troughs while losing the $0.421-mark support on 5 January. Then, it formed a down-channel and a falling wedge only to witness another sell-off on 21 January.
GALA lost 63.98% of its value from (5 January) until it touched its two-month low on 22 January. Now, the immediate testing point for the bulls stood at the 20-SMA (cyan).
At press time, GALA was trading 78% below its ATH at $0.18124. The RSI oscillated in a descending broadening wedge for the past 12 days. A sustained close above the 37-level could propel a patterned breakout. The CMF continued to depict weak signals as it refused to cross the zero line for a while now.