Cosmos, Fantom, and Chainlink Price Analysis: 21 May

Bitcoin was indecisive as it traded just above the $29k mark, and the altcoin market has been trading sideways in the past few hours as well. Cosmos rose above the $11.06 support level and held on, while Fantom and Chainlink appeared to trade within a range.
Cosmos (ATOM)
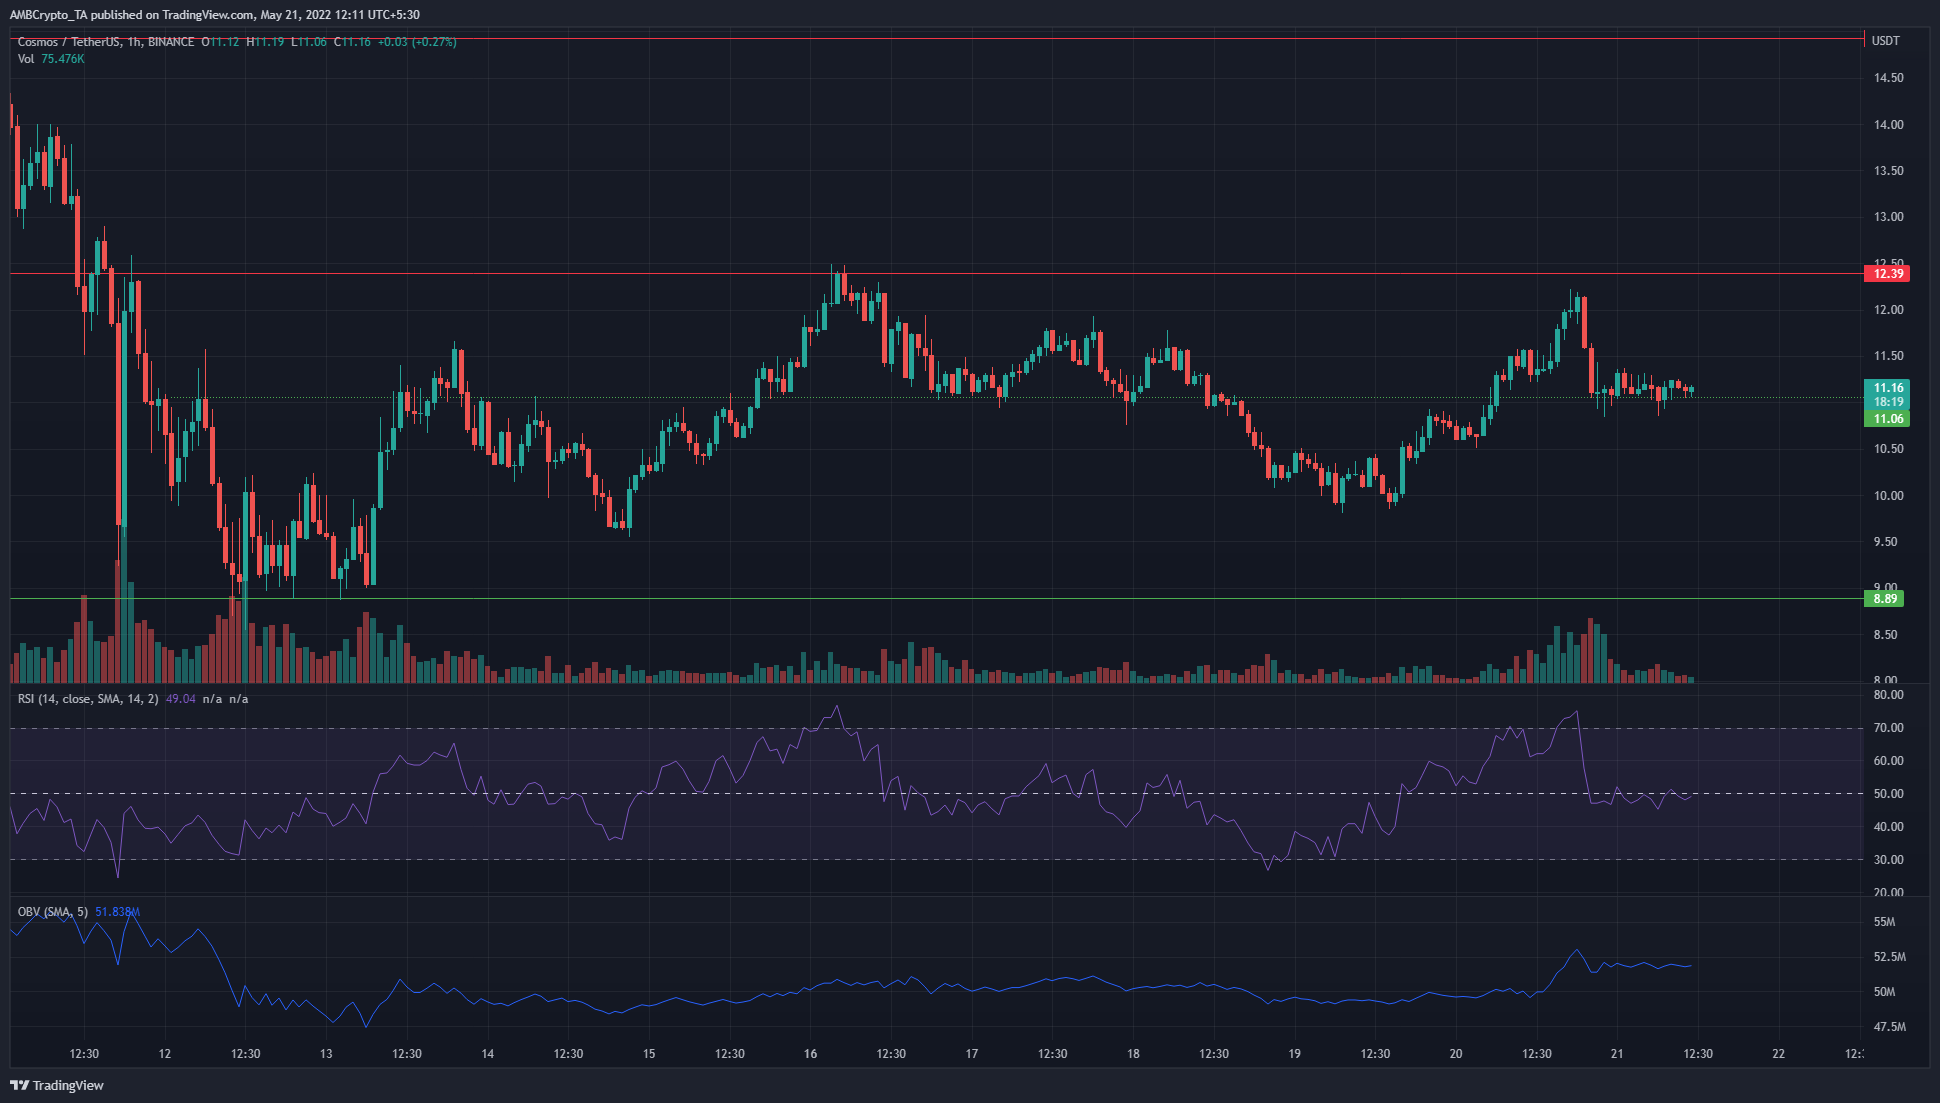
In the past week, the OBV has been climbing slowly but steadily, while LINK also posted a series of higher lows on the chart. In the past couple of days, a spike in buying volume was seen, and the price also pushed past the $11.06 level and flipped it to support.
The RSI was at 49 and has hovered just below the neutral 50 line in the past few hours as there was a lack of momentum on the charts. A short-term resistance level for LINK is at $12.39, while support is at $11.06 and $10.
Fantom (FTM)
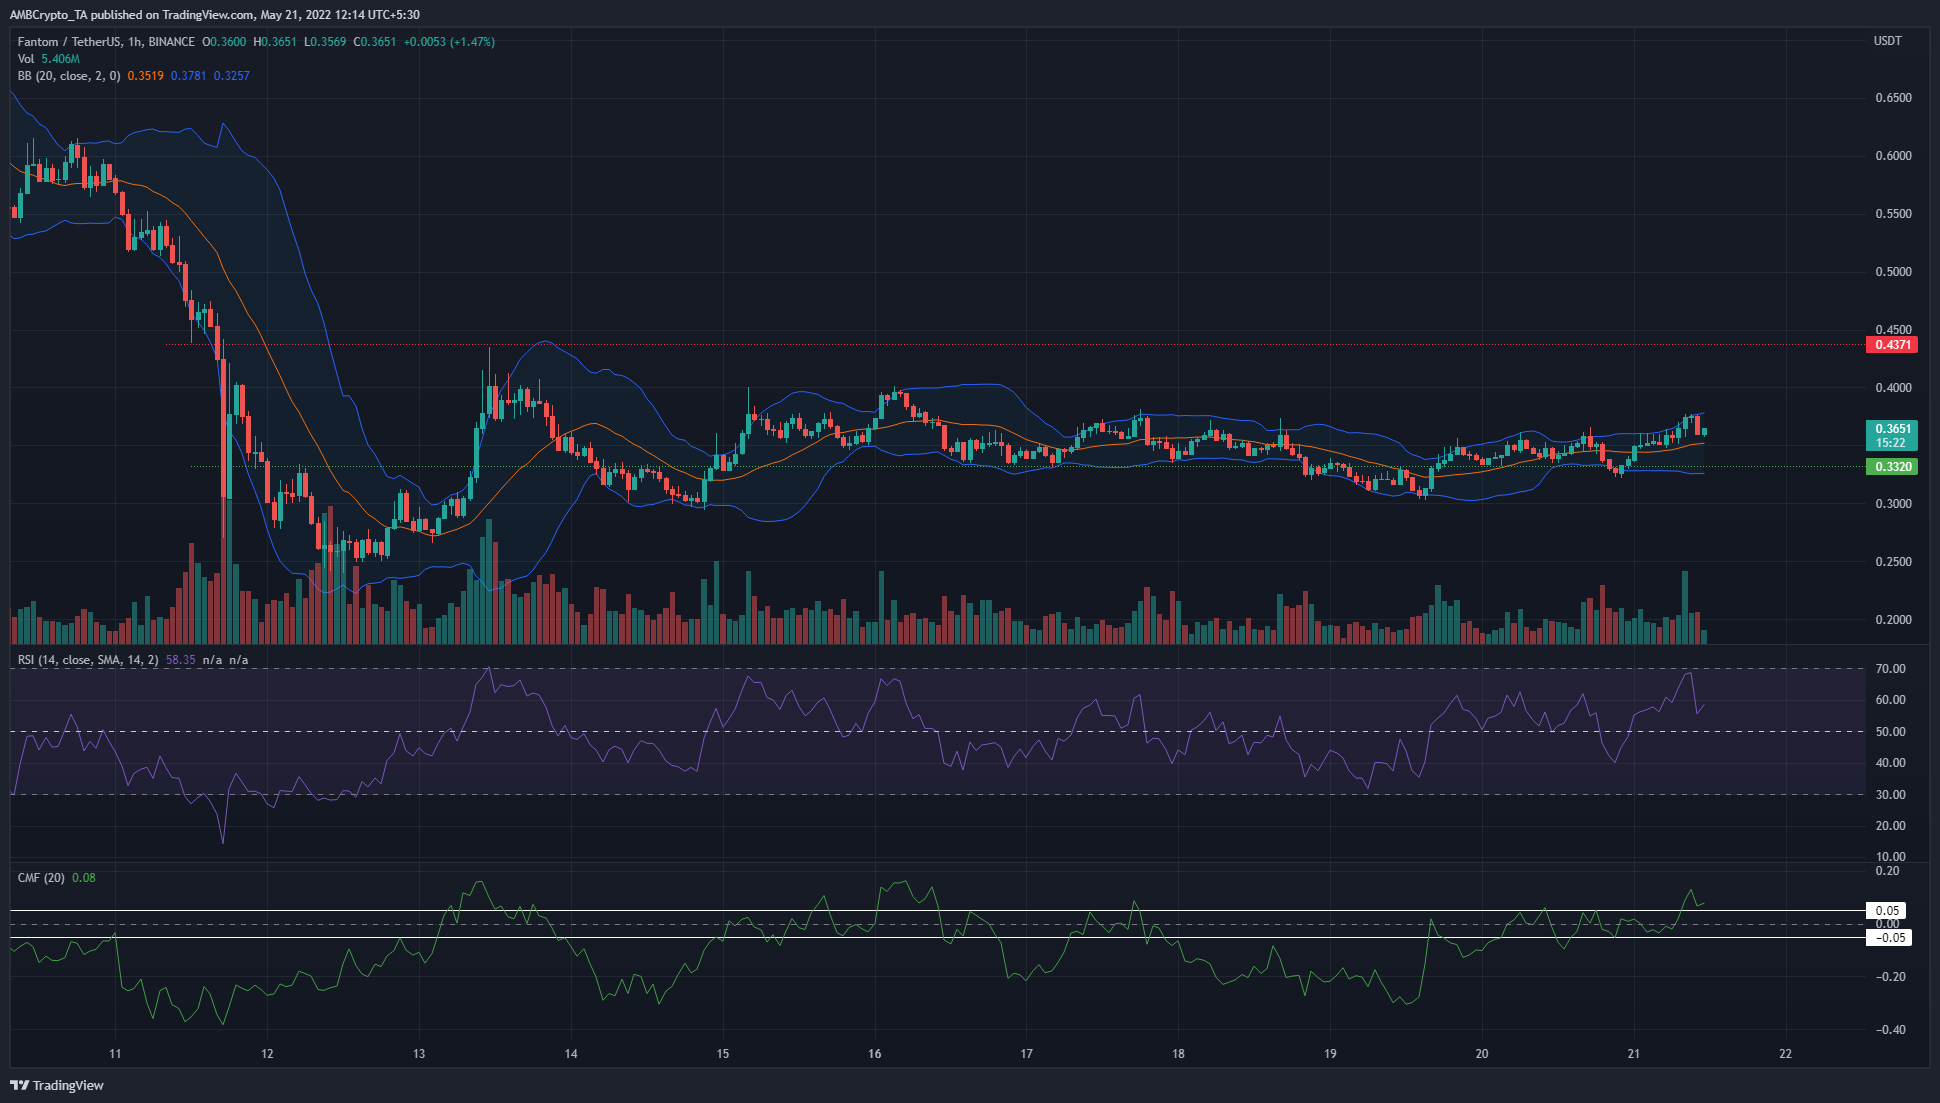
In the past week, the price of FTM has hugged the $0.33 level progressively tighter, and the Bollinger Bands were quite close to the movement of the price as well. This pointed toward a lack of volatility and momentum behind FTM in the past few days.
Within the past 12 hours, however, FTM posted gains of around 12% as it bounced from $0.332 to $0.372. The Bollinger Bands widened in response to this strong move, and the CMF also climbed above the +0.05 mark to show buying pressure.
The RSI was also above the neutral 50 mark to show bullish momentum. However, Bitcoin could have a large impact on FTM.
Chainlink (LINK)
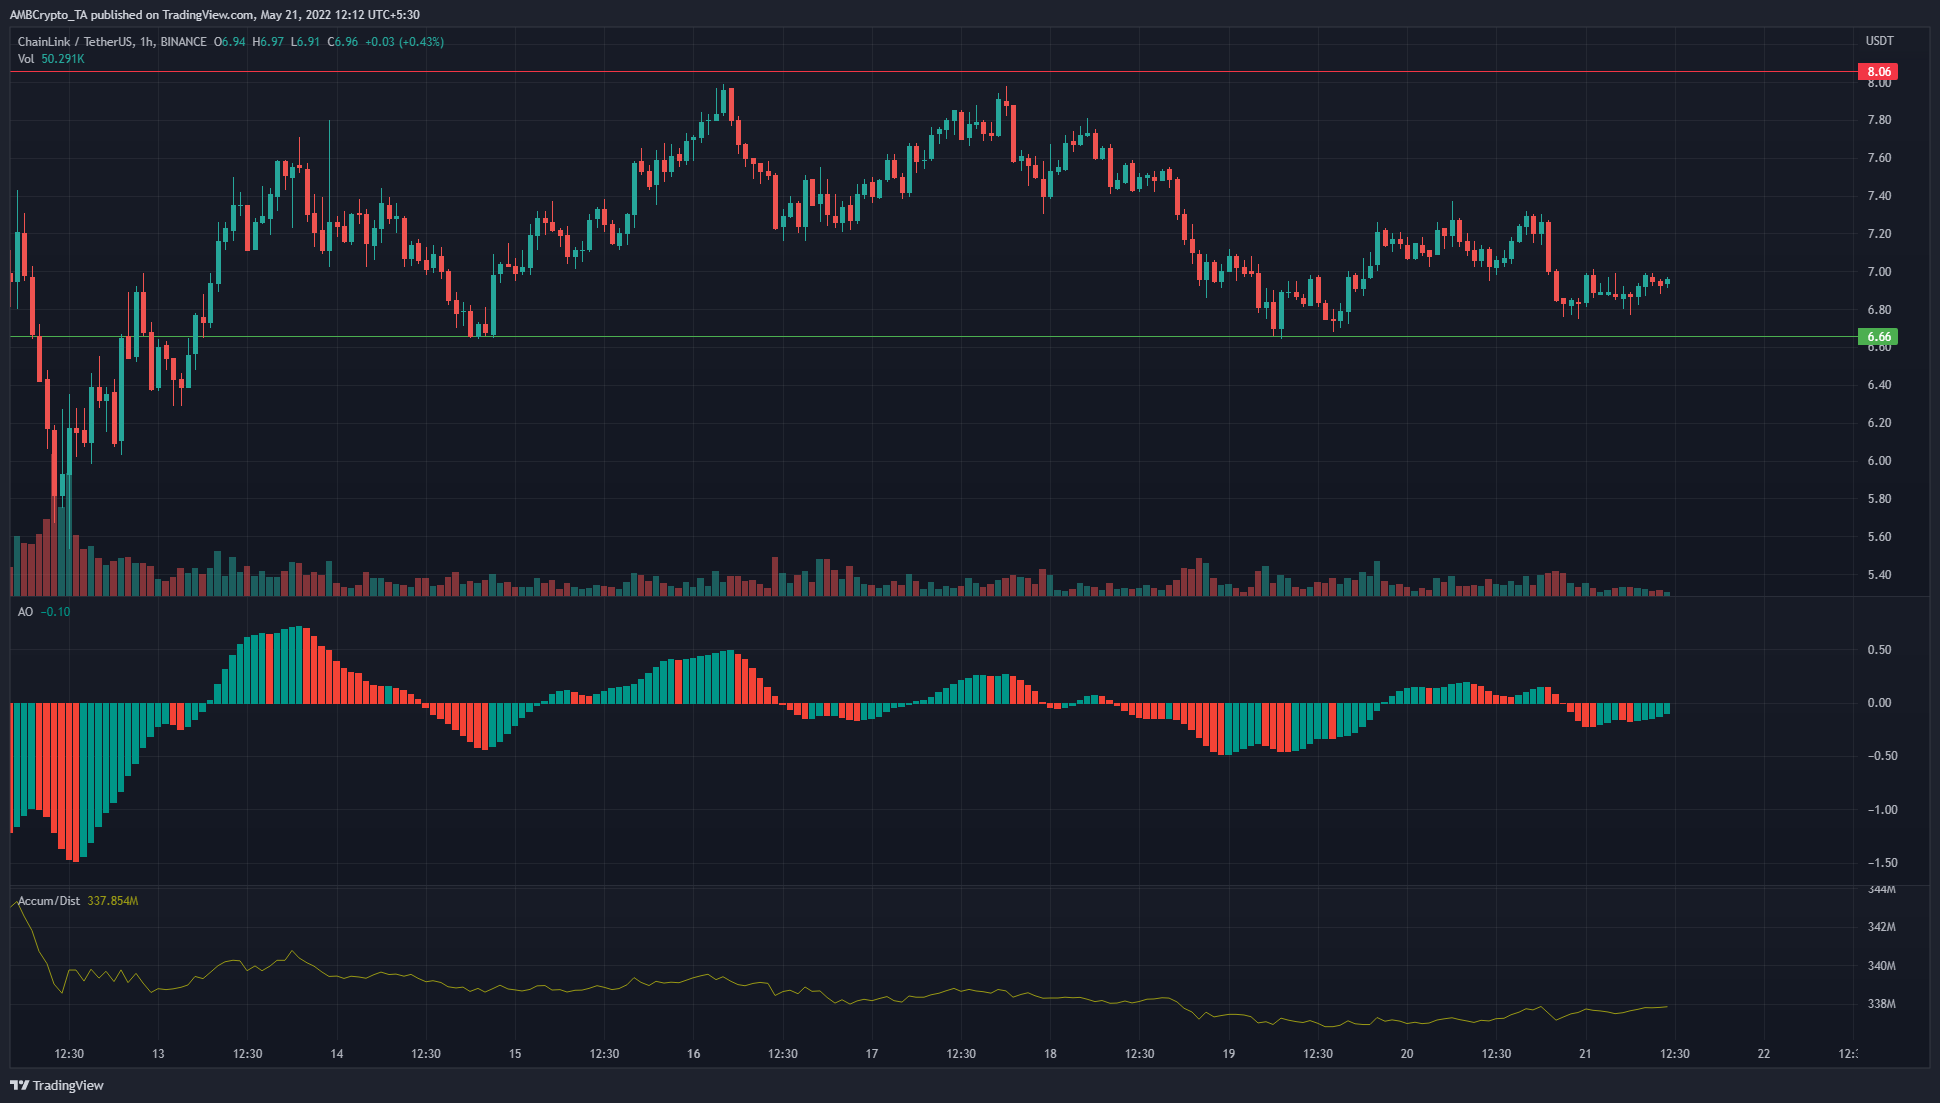
Similar to ATOM, LINK was also unable to climb past a level of resistance to the north at $8. However, unlike ATOM, LINK formed equal lows in the past week at the $6.66 support level. The trading volume was quite low in recent days.
The Awesome Oscillator dipped below the zero line the previous day to suggest bearishness after LINK dropped from $7.33 to $6.8, a 6% drop. The A/D line was inching lower over the past week, and buying volume appeared to be weak.


