Analysis
Cosmos: Risk-averse traders have reason to overlook ATOM’s bullish crossover
Disclaimer: The information presented does not constitute financial, investment, trading, or other types of advice and is solely the writer’s opinion
- Cosmos [ATOM] witnessed a bullish MACD crossover – a buy signal
- ATOM saw improved development activity and funding rates, but the sentiment is still negative
Cosmos [ATOM] rebounded after Bitcoin [BTC] reached $16.19K on 22 November. Notably, BTC’s decline from $16.60K between 27 and 28 November led to the price correction of ATOM.
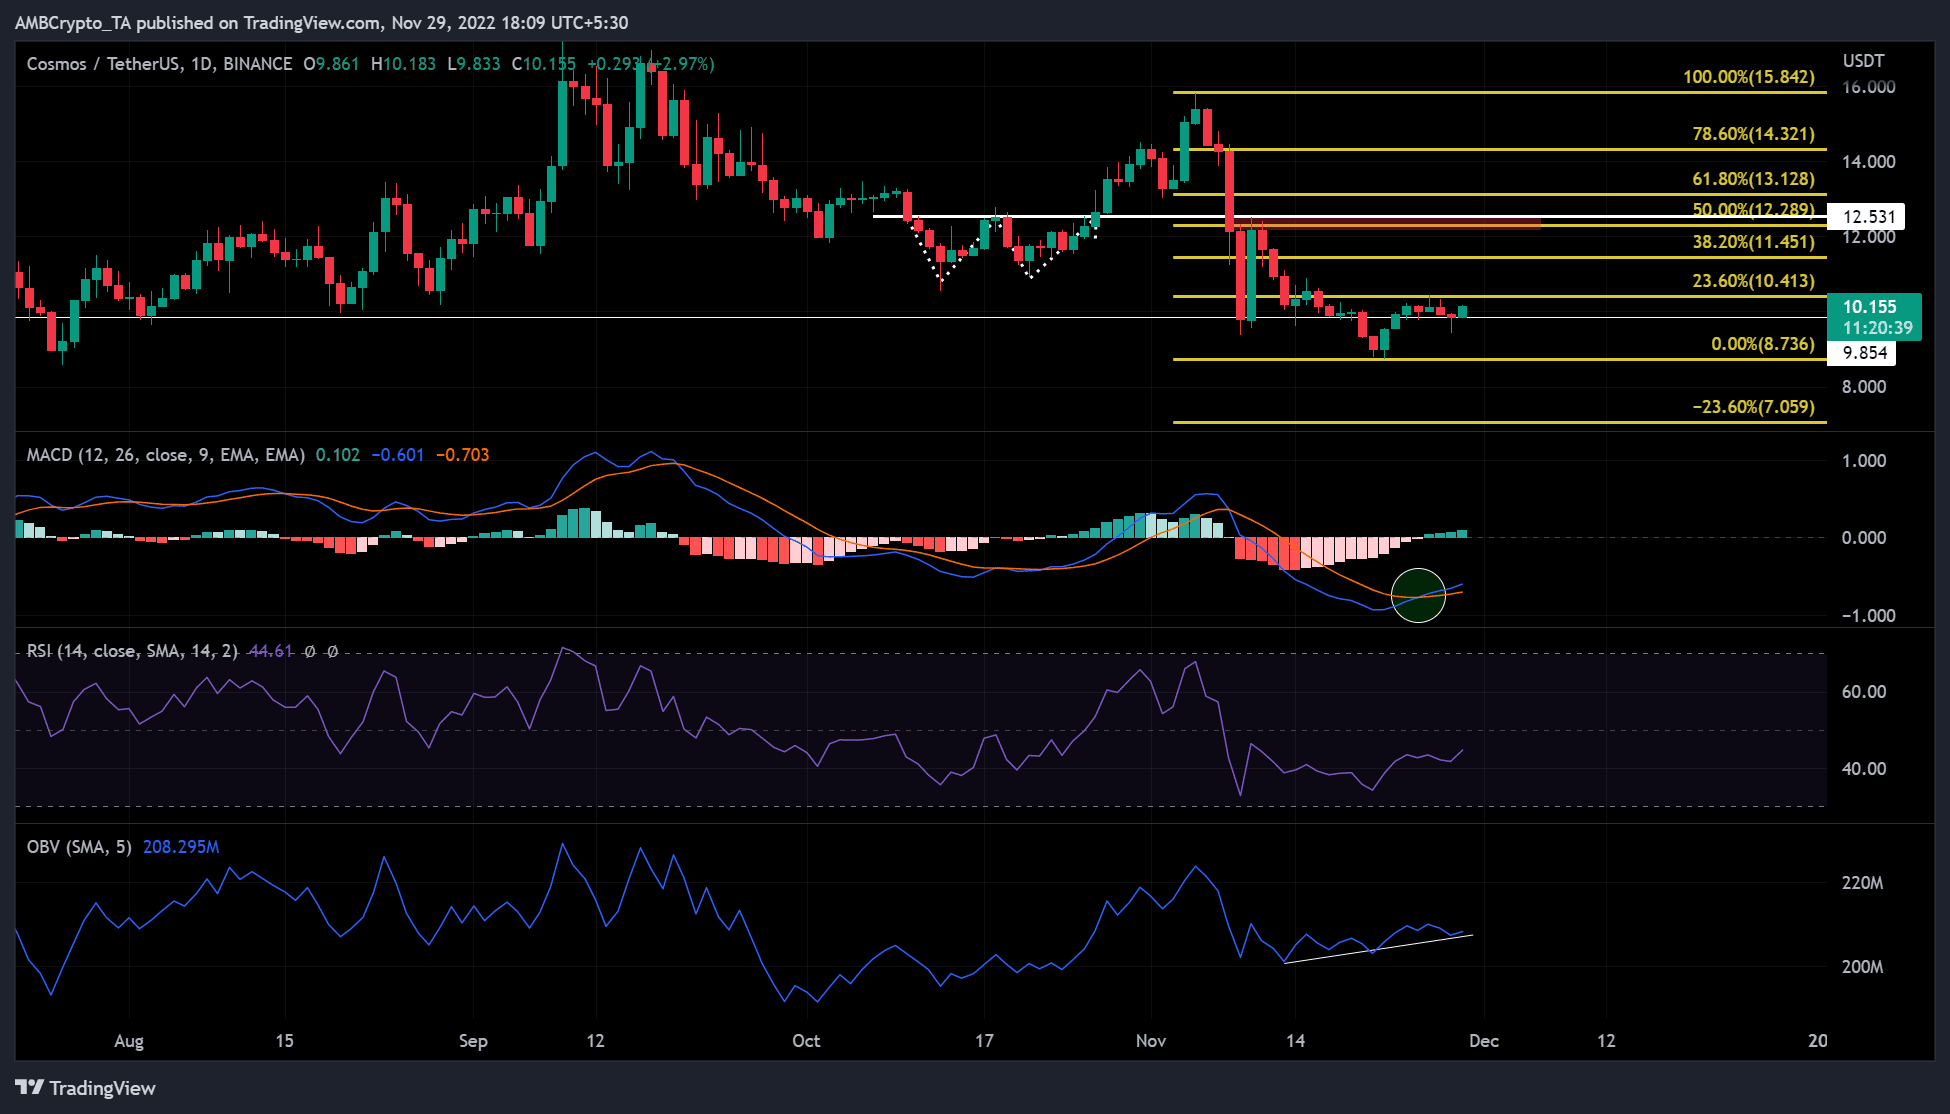
At the time of writing, ATOM was trading at $10.155, up 4% in the last 24 hours. Following a confirmed bullish Moving Average Convergence Divergence (MACD) crossover on 25 November, ATOM investors saw a buying opportunity ahead of them.
Read Cosmos’ [ATOM] price prediction 2023-2024
However, ATOM’s market structure was still bearish at press time. Therefore, risk-averse traders could be looking for buying opportunities after a breakout and retest of this Fib level in a day or two.
A bullish MACD crossover: can the bulls sustain the upside momentum?
Source: TradingView
The bullish MACD crossover could be considered as the buy signal that coincided with a developing uptrend. However, the plotting of the Fibonacci retracement tool between the highest and lowest ATOM price points in November led to results that weren’t convincing.
ATOM didn’t break above the 23.6% Fib level ($10.413) – a significant resistance. If the bulls break the 23.6% Fib level and retest this level or confirm it as support, investors can take positions for a long trade as support at $9.854 can be considered as stable.
In this case, the target for a long position would be the bearish order block at the 50% Fib level ($12.289). Key technical indicators point toward this inclination.
The Relative Strength Index (RSI) retreated from the lower ranges bordering the oversold territory. It showed that the selling pressure was easing. This also meant that the bulls were slowly gaining influence.
Accordingly, the On-Balance Volume (OBV) reached some new highs since mid-November. It showed that trading volumes were increasing, which could increase buying pressure and help the bulls to break through resistance targets.
However, an intraday close below $8.736 would invalidate the above inclination. In this case, another downtrend could find new support at $7.059 or below.
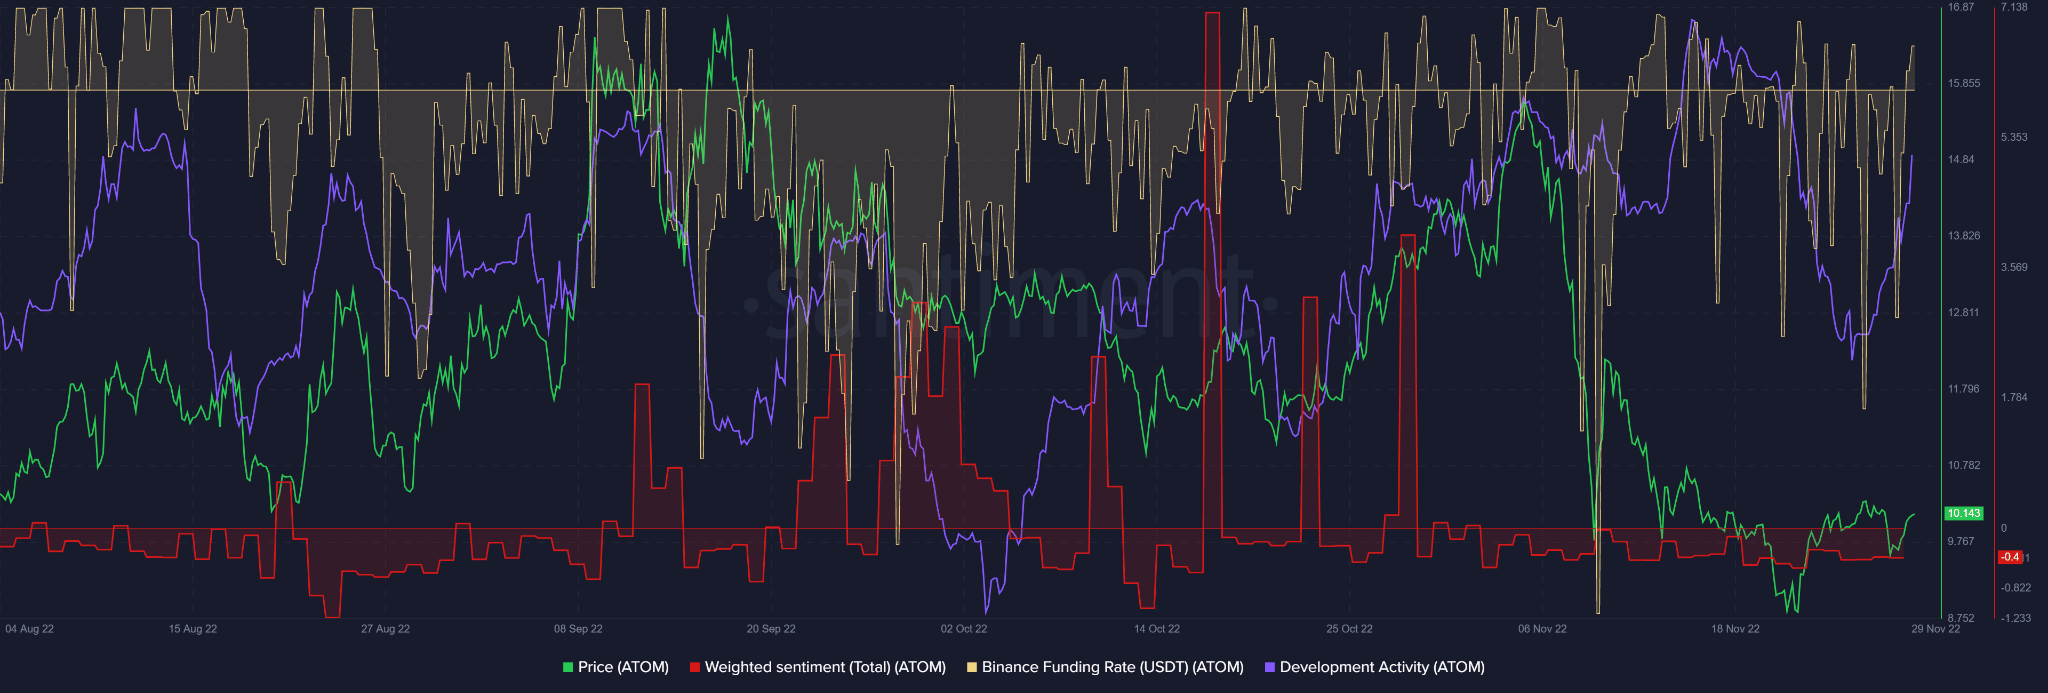
Improved development activity, but the sentiment remains negative
Source: Santiment
According to Santiment’s data, ATOM saw a steady increase in development activity from October. However, development activity fell in mid-November, only to rise steadily again thereafter.
Interestingly, ATOM’s development activity correlated positively with its price performance. Therefore, the increase in development activity at the time of the press release could indicate a likely increase in ATOM’s price.
However, the weighted sentiment of ATOM remained worryingly negative throughout November. As it also directly impacts the price of ATOM, this could complicate ATOM’s ongoing price recovery.
Therefore, risk-averse traders shouldn’t rush to buy the bullish MACD crossover. Waiting for a break of the 23.6% Fib resistance level and a retest would be a sure sign to initiate a move. However, waiting for a retest could lead to a missed opportunity if the uptrend continues without retesting the level.
Thus, cautious traders should wait for a convincing breakout above the 23.6% Fib level. In addition, you should monitor BTC’s performance and sentiment on ATOM.