Cosmos, SAND, Bitcoin Cash Price Analysis: 10 January

Bitcoin Cash and SAND correlated with the broader market trajectory and declined below their 4-hour 20-50-200 SMA. They poked their multi-week lows on 8 January while the 20 SMA stood as an immediate hurdle.
On the other hand, Cosmos touched its 15-week high on 7 January. However, over the past few days, it formed a double top and hinted at decreasing buying influence.
Cosmos (ATOM)

After an inverse head and shoulder, ATOM saw an expected breakout from the $32.5-mark. The alt jumped by over 35% (from 1 January) and poked its 15-week high on 7 January. This incline helped ATOM reclaim its 23.6% Fibonacci support at the $36-mark.
After retesting the $32.5-support for over seven weeks, the bulls finally initiated a sustained breakout for the past four days.
However, the alt formed a double-top over the past five days while the bears ensured the $43-resistance. Now, as the 20 SMA (red) fell below the 50 SMA (grey), the bears seemed to increase their influence.
At press time, ATOM traded 17.9% below its ATH at $36.79. The RSI consistently marked lower peaks and dipped below the midline. The AO stayed below the midline after forming bearish twin peaks above the zero line.
The Sandbox (SAND)

SAND bulls crossed the 38.2% Fibonacci resistance as it reclaimed the crucial $6.03 support after forming a rising wedge (green, reversal pattern). As the 61.8% Fibonacci stood as a strong resistance, an expected breakdown occurred from the reversal pattern.
Since then, SAND saw a 35.75% retracement until it poked its three-week low on 8 January. Any further pullout would find support at the $4.44-mark. The 20-SMA (red) acted as an excellent resistance for the past week as the bulls struggled to counter it.
At press time, the alt traded at $4.6783. The RSI was at the 41-mark and continued to find resistance near the equilibrium for the past 13 days. While the DMI hinted at a bearish preference, the ADX displayed a weak directional trend for SAND.
Bitcoin Cash (BCH)
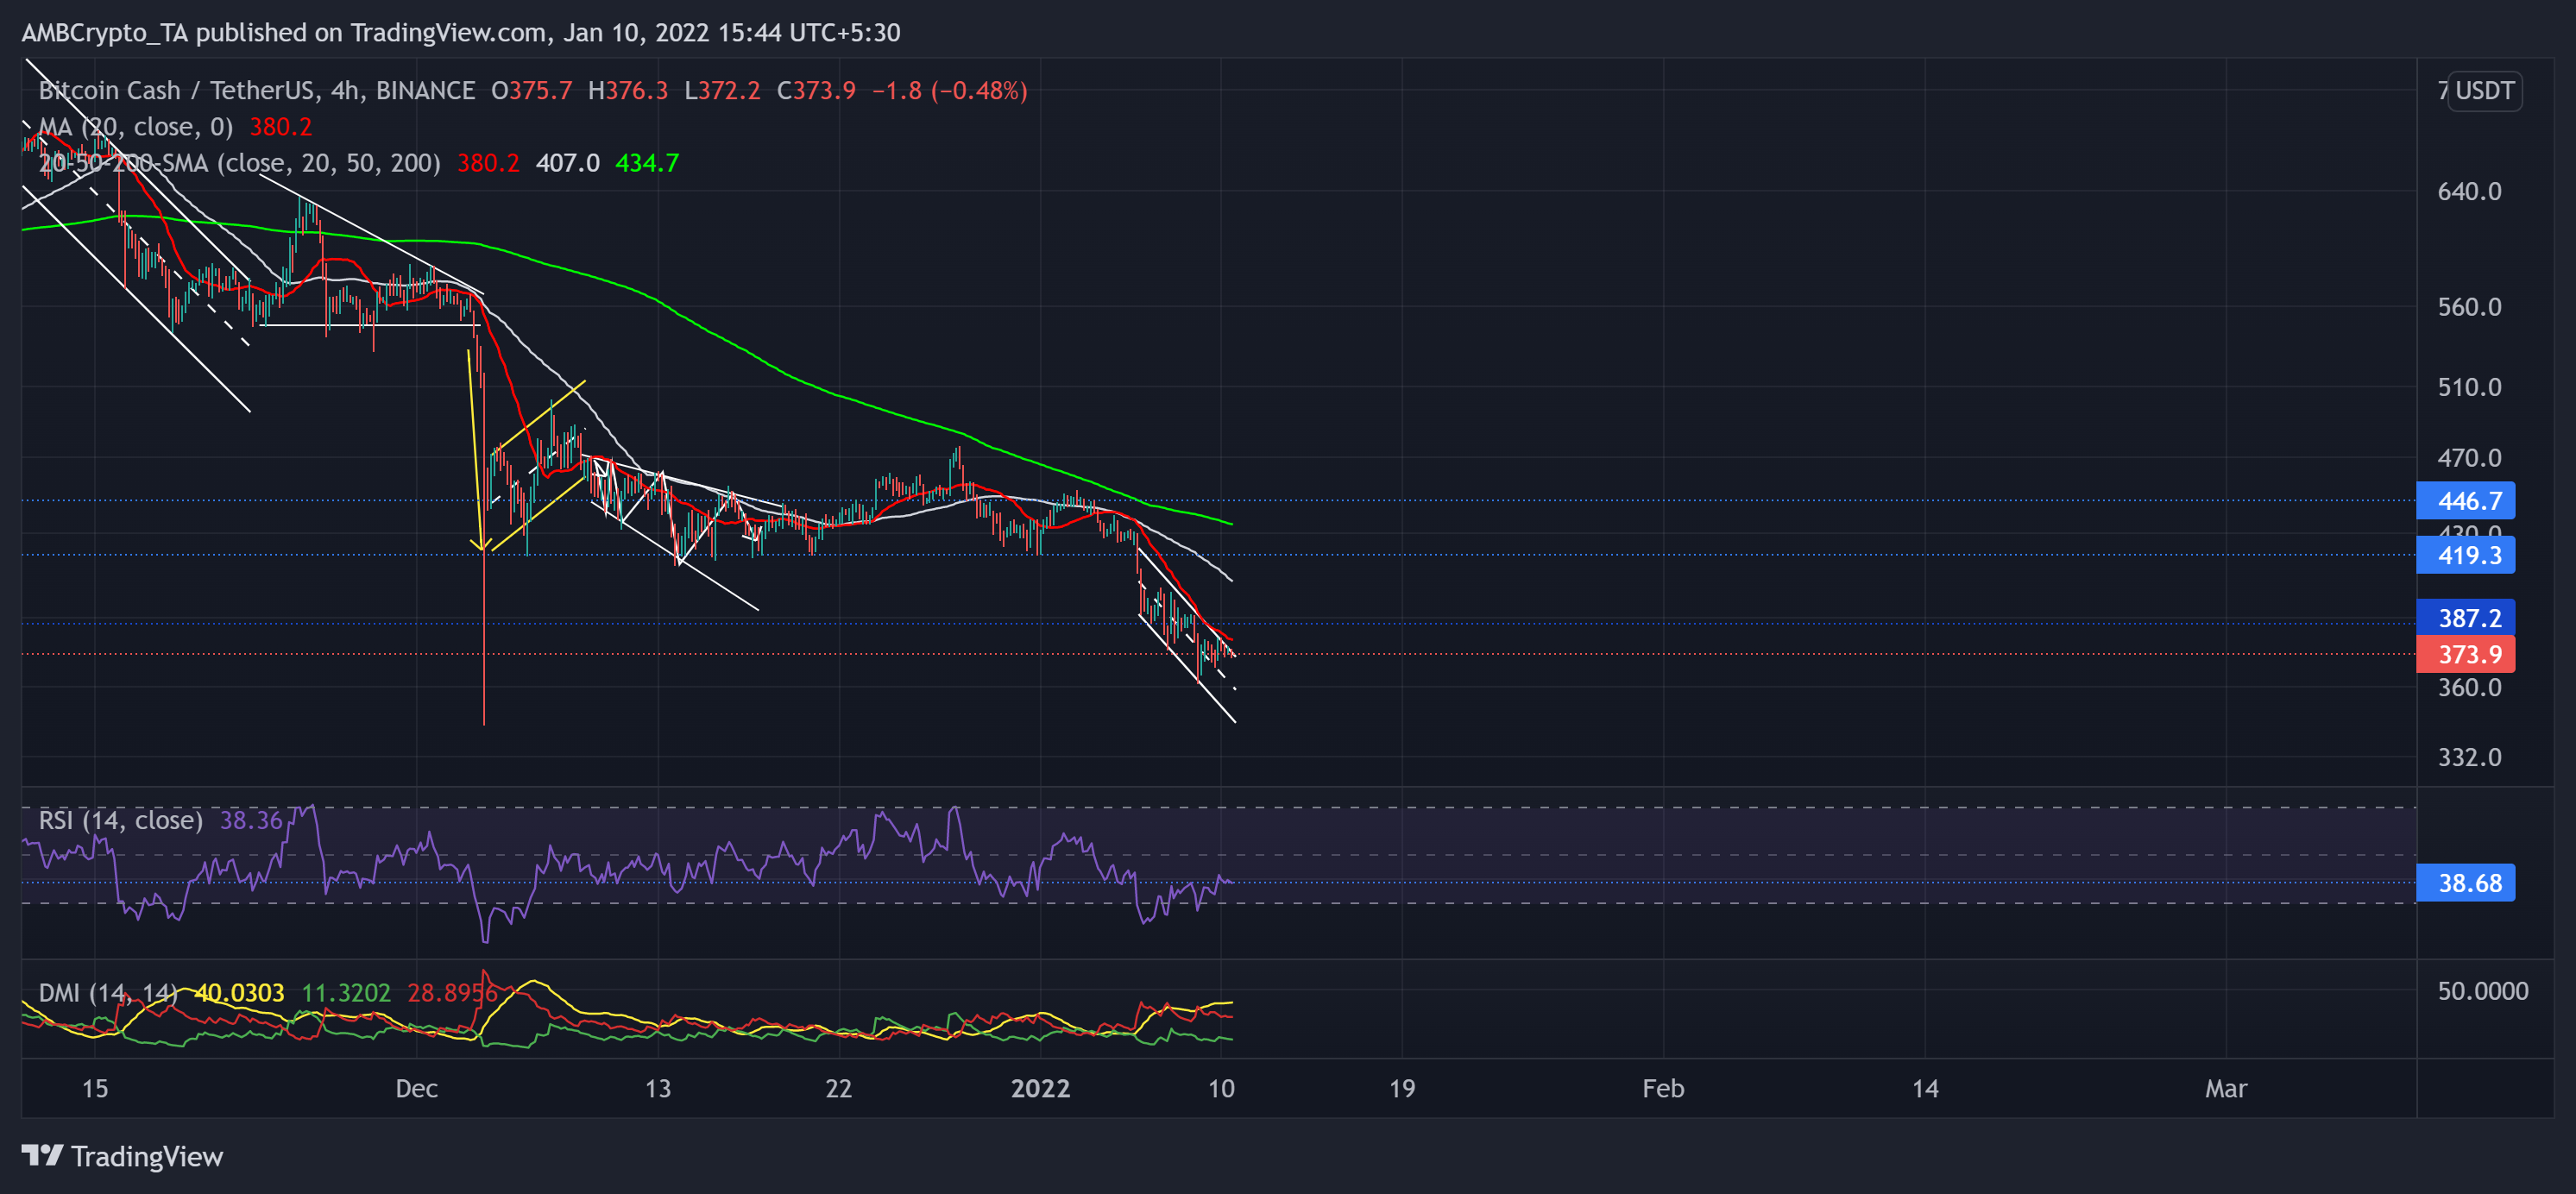
The bearish flag (yellow) breakdown pushed BCH’s price below the 38.2% resistance. The bulls failed to uphold the $419-support while bears retested it multiple times. The price action saw a sustained dip below this level for the first time in over a year now.
The alt oscillated in a down-channel (white) and further lost the vital $387.2-resistance (previous support) to poke its five-week low on 8 January. The immediate testing level for the bulls stood at the upper channel that coincided with the 20 SMA (red).
At press time, BCH traded below its 20-50-200 SMA at $373.9. The RSI struggled to find a convincing close above the 38-point resistance. Also, the DMI confirmed the previous analysis by flashing a bearish bias.


