Could Aptos [APT] get more gains after surging past $13 resistance?

Disclaimer: The information presented does not constitute financial, investment, trading, or other types of advice and is solely the writer’s opinion.
- A move downward to $12.15 was a likelihood for Aptos.
- The bias would remain bullish until a key support level was broken.
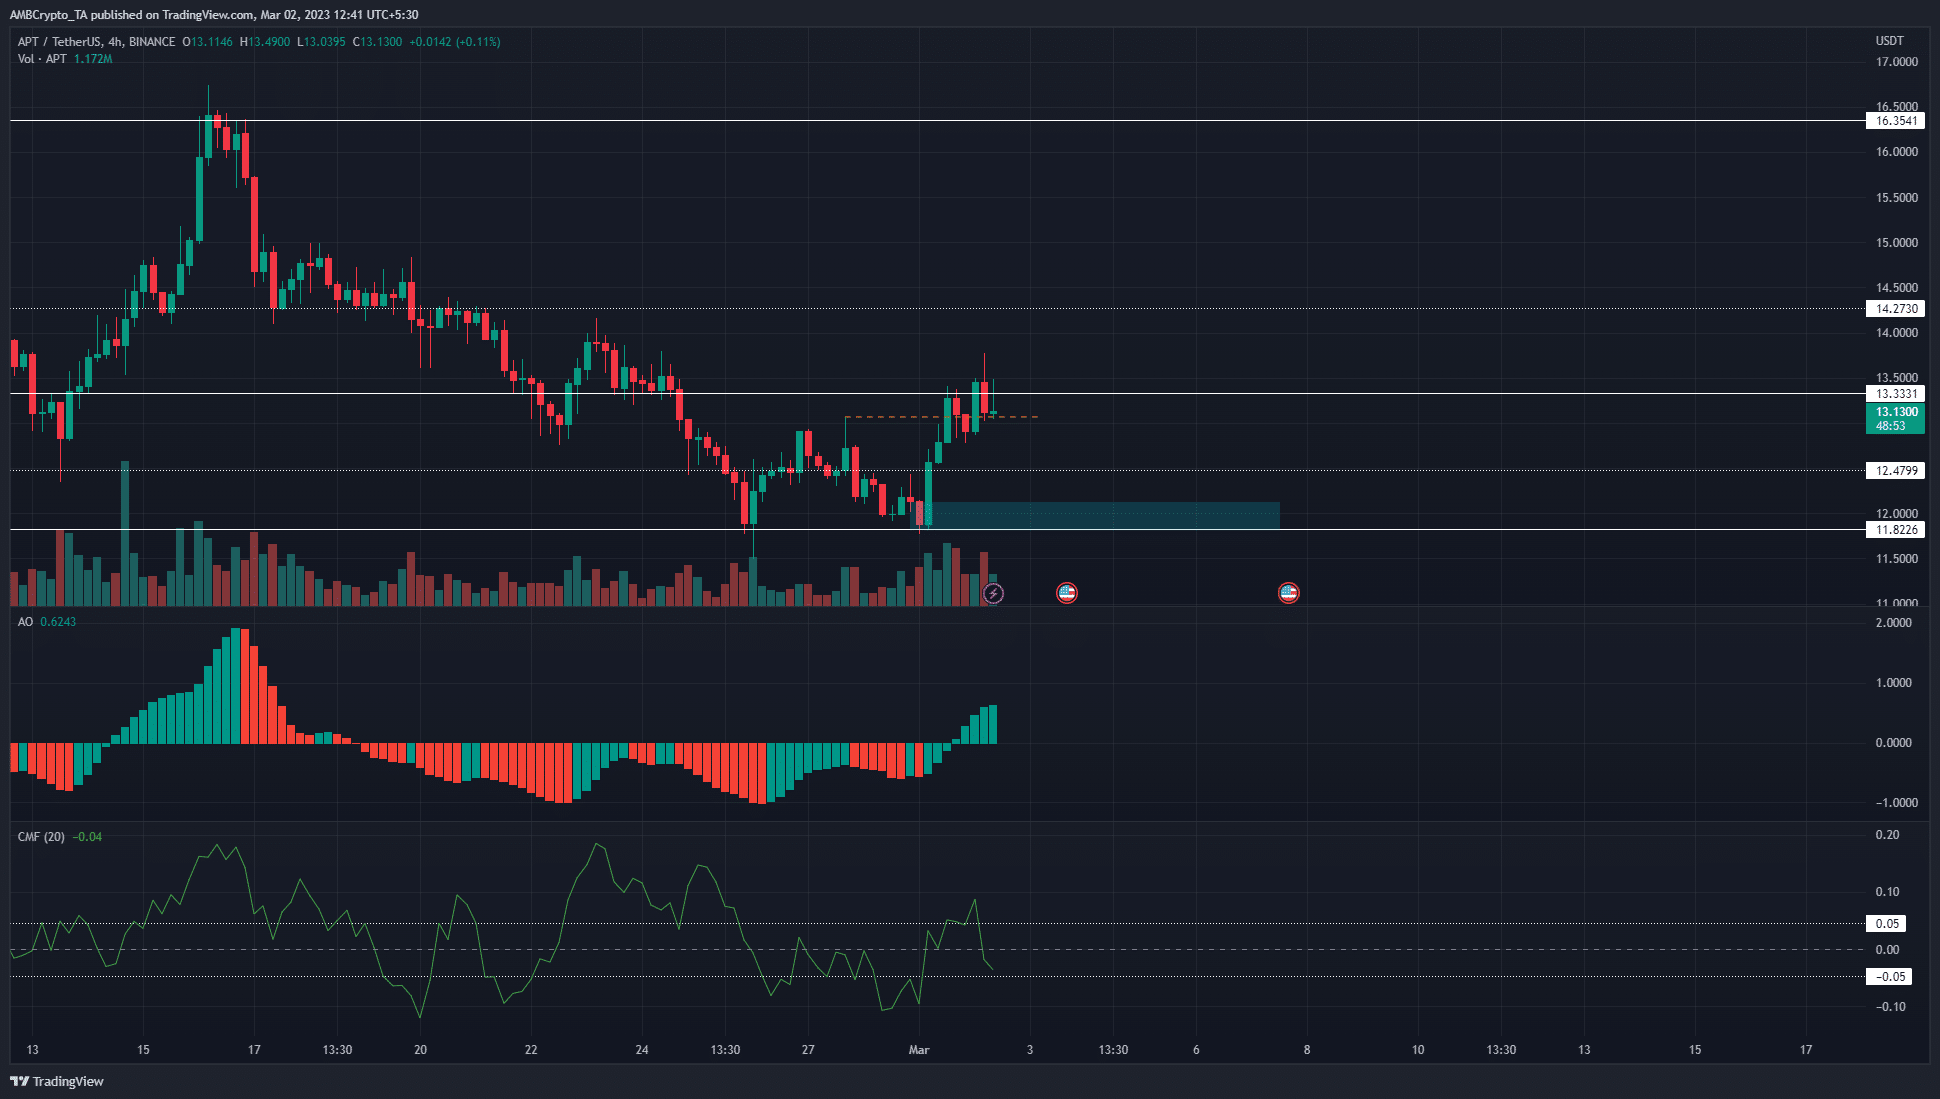
Aptos [APT] saw a strong move upward push on heavy trading volume on 1 March on the price charts. This was a shift in favor of the bulls and a welcome change for the buyers after the downward move from 16 February.
Read Aptos’ [APT] Price Prediction 2023-24
Bitcoin [BTC] itself sat atop some support around the $23k area. However, the king of crypto was pointed downward, although another move up to $24k was also possible. This meant that both buyers and sellers in the near term could wait for a retest of a significant area before entering trades.
The bullish market structure break was quick and more gains can follow
The bounce in prices from $11.8 to $13 was quick. APT gained nearly 12% within 20 hours. However, Aptos sellers forced a near-term rejection in the $13.7 area, and the token stood at $13.13 at press time. Due to the break in structure, further near-term losses could follow. This was because, after a strong surge, the price can see a retracement to fill any imbalances on the chart.
Aptos had a fair value gap on the four-hour chart that extended from $12.15 to $12.5. Therefore, the price could get pushed toward this area in the coming days. That would not be a bearish scenario, as the prices would continue to have a bullish structure.
This upward bias will be invalidated if the price fell beneath the $12.15 level. The Awesome Oscillator also showed bullish momentum after crossing above the zero line. However, the CMF continued to move in the neutral region.
How much are 1, 10, 100 APT worth today?
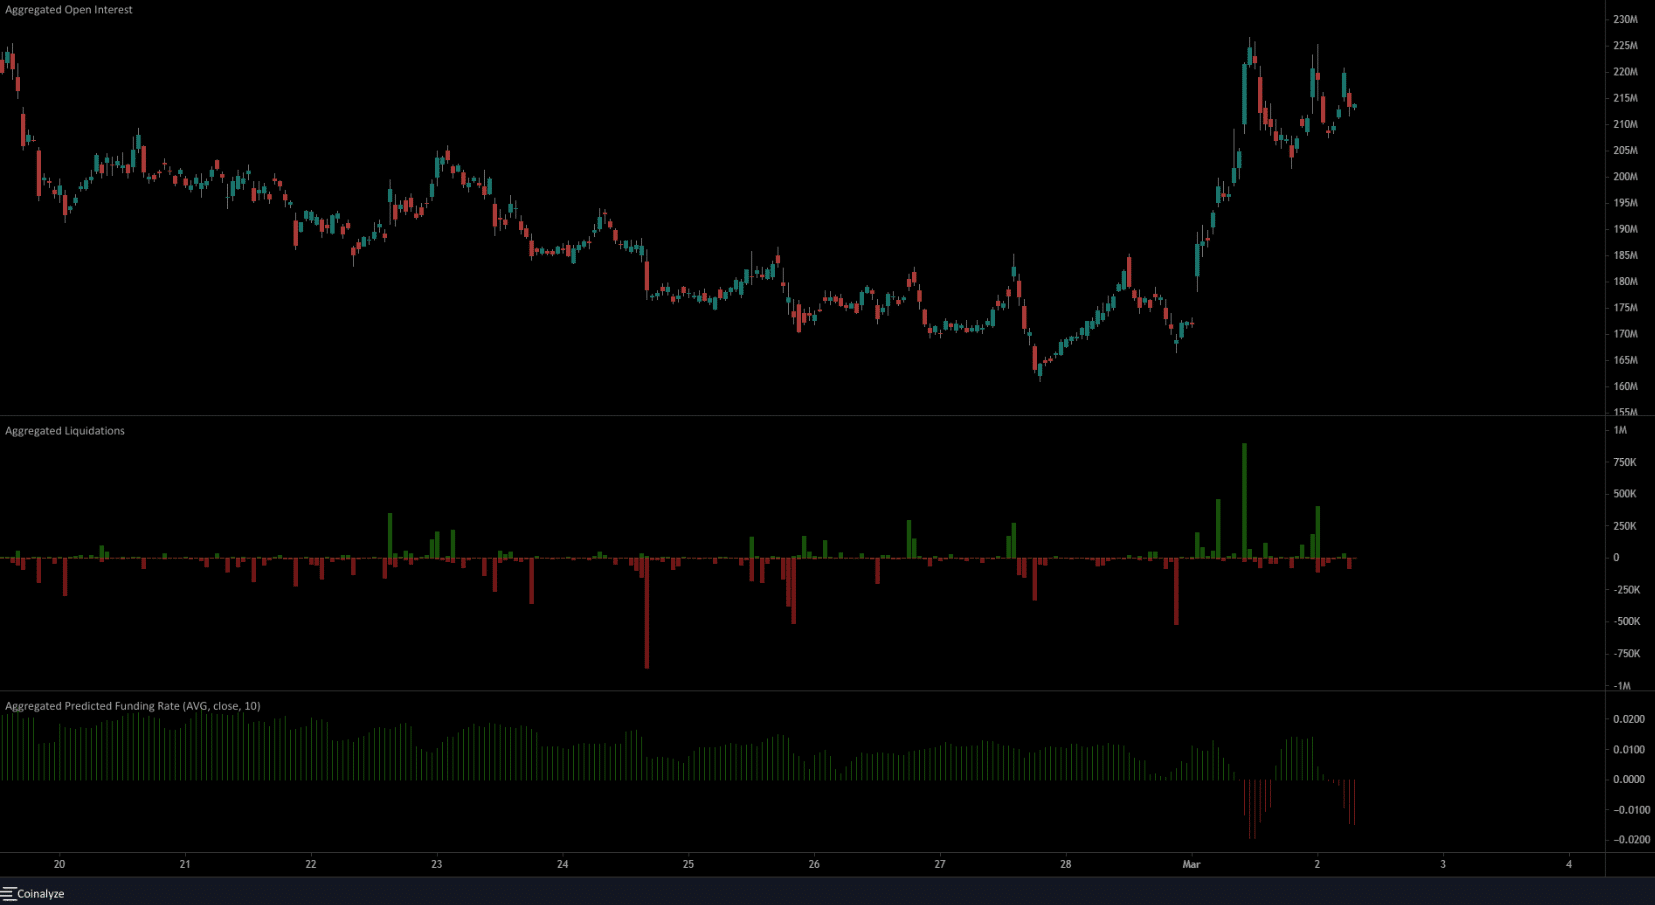
The Open Interest catapulted higher during the shift in bias

Source: Coinalyze
The one-hour chart above showed the Open Interest surged higher when the market structure was flipped to bullish. Alongside the rise in volume seen in the price charts, the inference was that the move higher was fueled by strong demand, and further gains were a possibility for APT.
The liquidation chart showed short positions worth $890k were liquidated within an hour on 1 March, when the price broke out above $13. This showed that $13 is a significant level. After the large move upward, the funding rate flipped negative, which showed long positions were paid funding for maintaining their positions.


