
Ethereum – Institutions scoop up $946M, but watch THIS metric for a shakeout!

- The token holders were at a large loss, making recovery extra hard.
- The network MDIA showed stagnancy has begun to creep in.
Polygon [MATIC] was in a strong downtrend. It began in early April on the daily timeframe with a drop below $0.91. At press time, MATIC was trading below 2023’s yearly low at $0.492.
The bulls were battling the bears with little to show for it. The 2022 yearly low at $0.316 was nearly retested on the 5th of August, with the token falling to $0.334 on the day.
Network activity, accumulation not enough to halt the downtrend
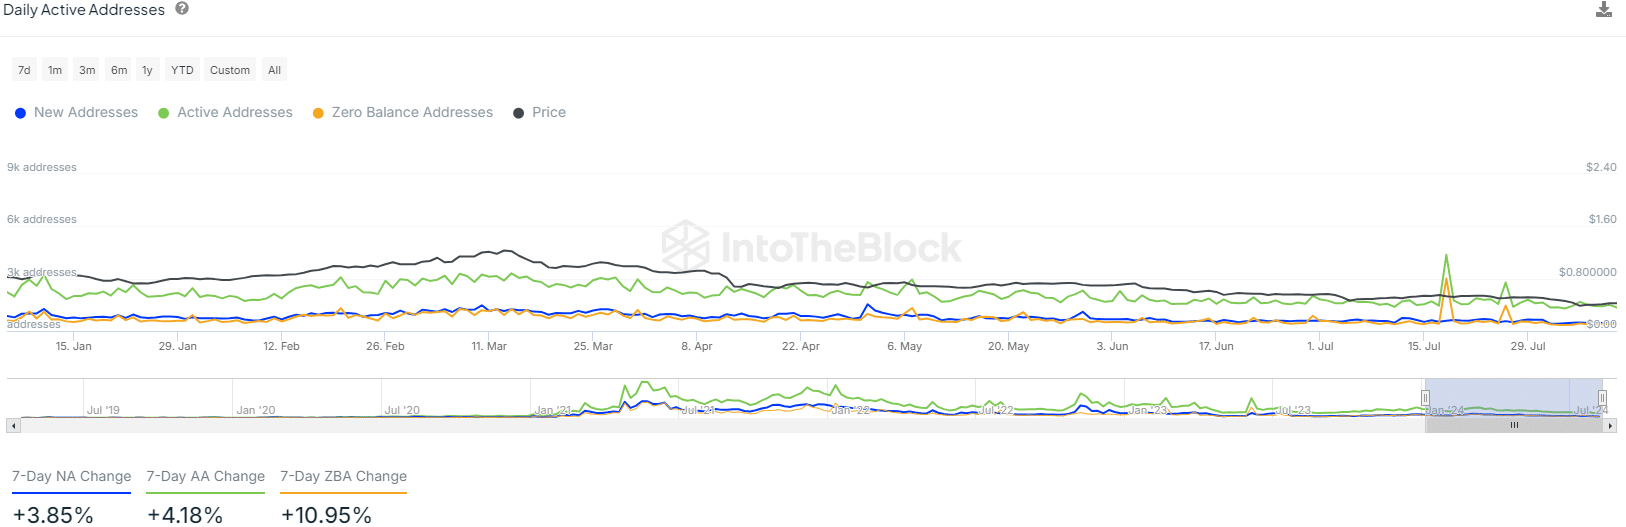
Source: IntoTheBlock
The number of new addresses created has dropped in the past two weeks. It held steady around the 600 figure in June and much of July, but faltered in August.
The active addresses were marginally lower than in the second half of July but have increased slightly over the past week.
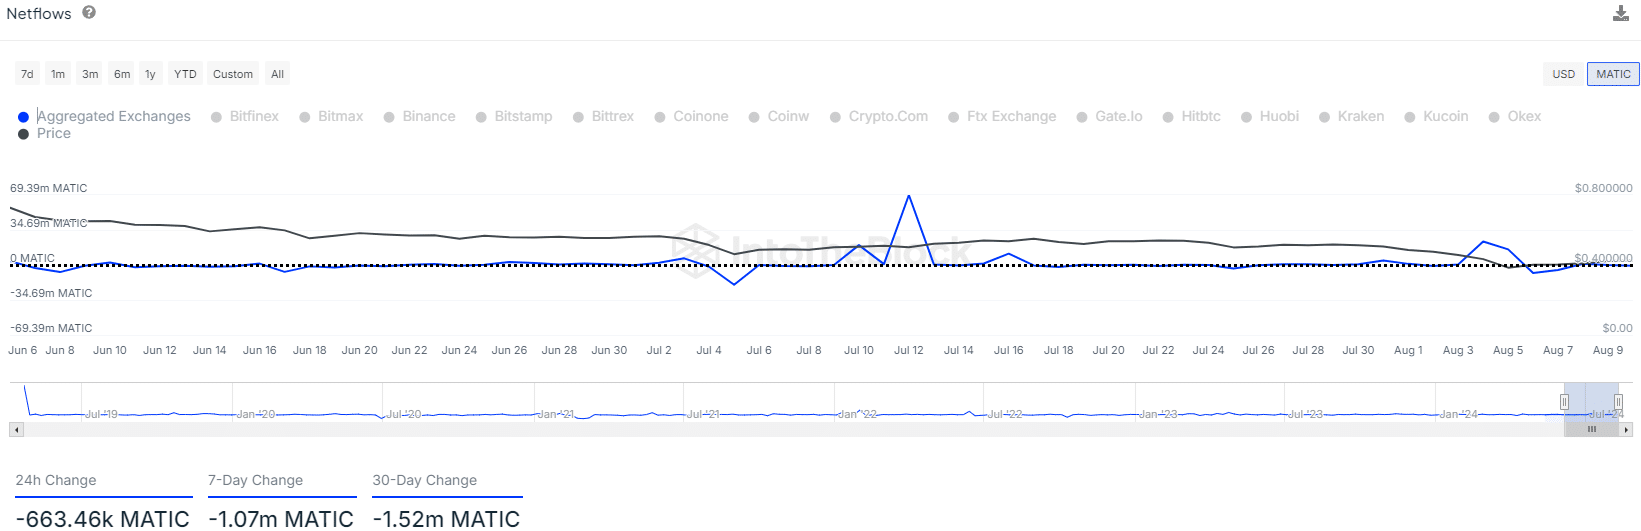
Source: IntoTheBlock
The negative flows showed MATIC moving out of exchanges in the past month. The USD figure is around $660k. For comparison, the market cap of MATIC and its 24-hour trading volume the previous day were $4.16 billion and $130 million respectively.
Why is it extra hard for MATIC bulls to initiate a recovery?
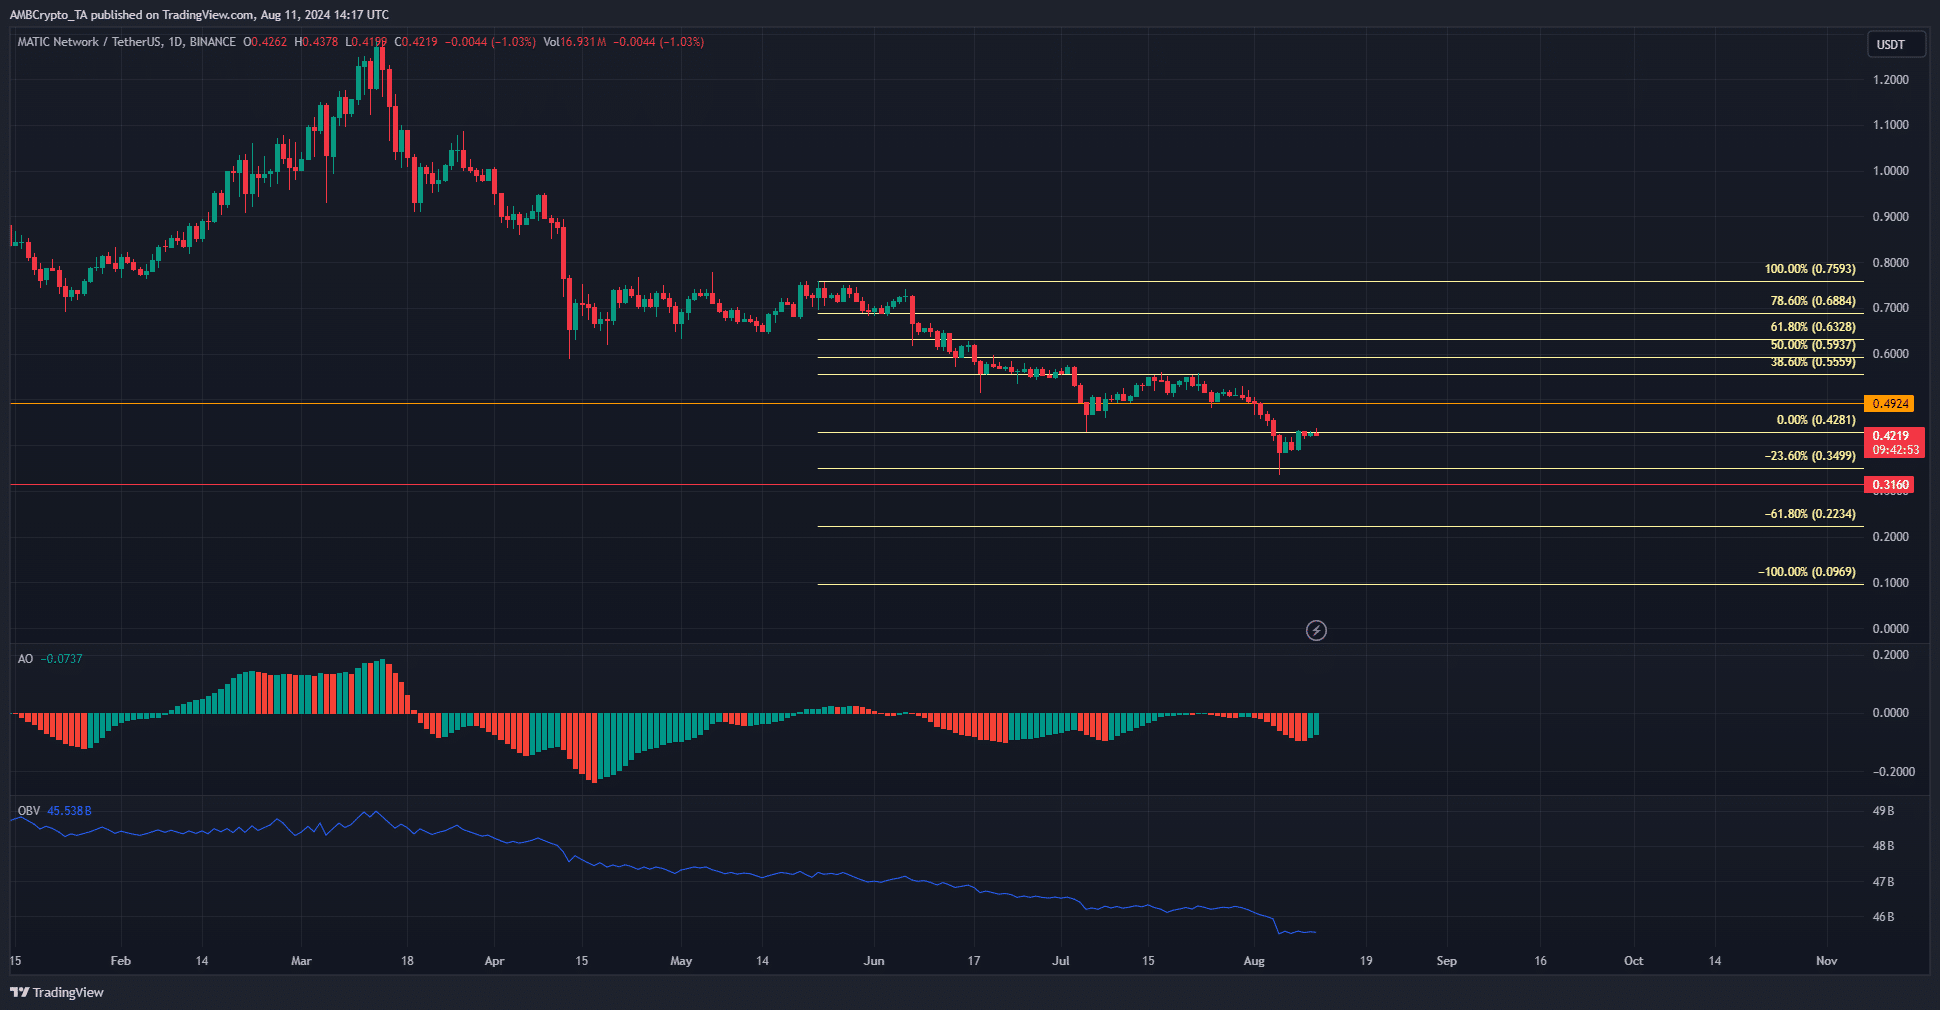
Source: MATIC/USDT on TradingView
The persistent downtrend since March meant that holders were at a loss. Each minor rally is an opportunity for holders to get out of their unprofitable venture. The OBV reflected this constant selling pressure.
The Awesome Oscillator has been below the zero line for two months, showing bearish momentum was dominant.
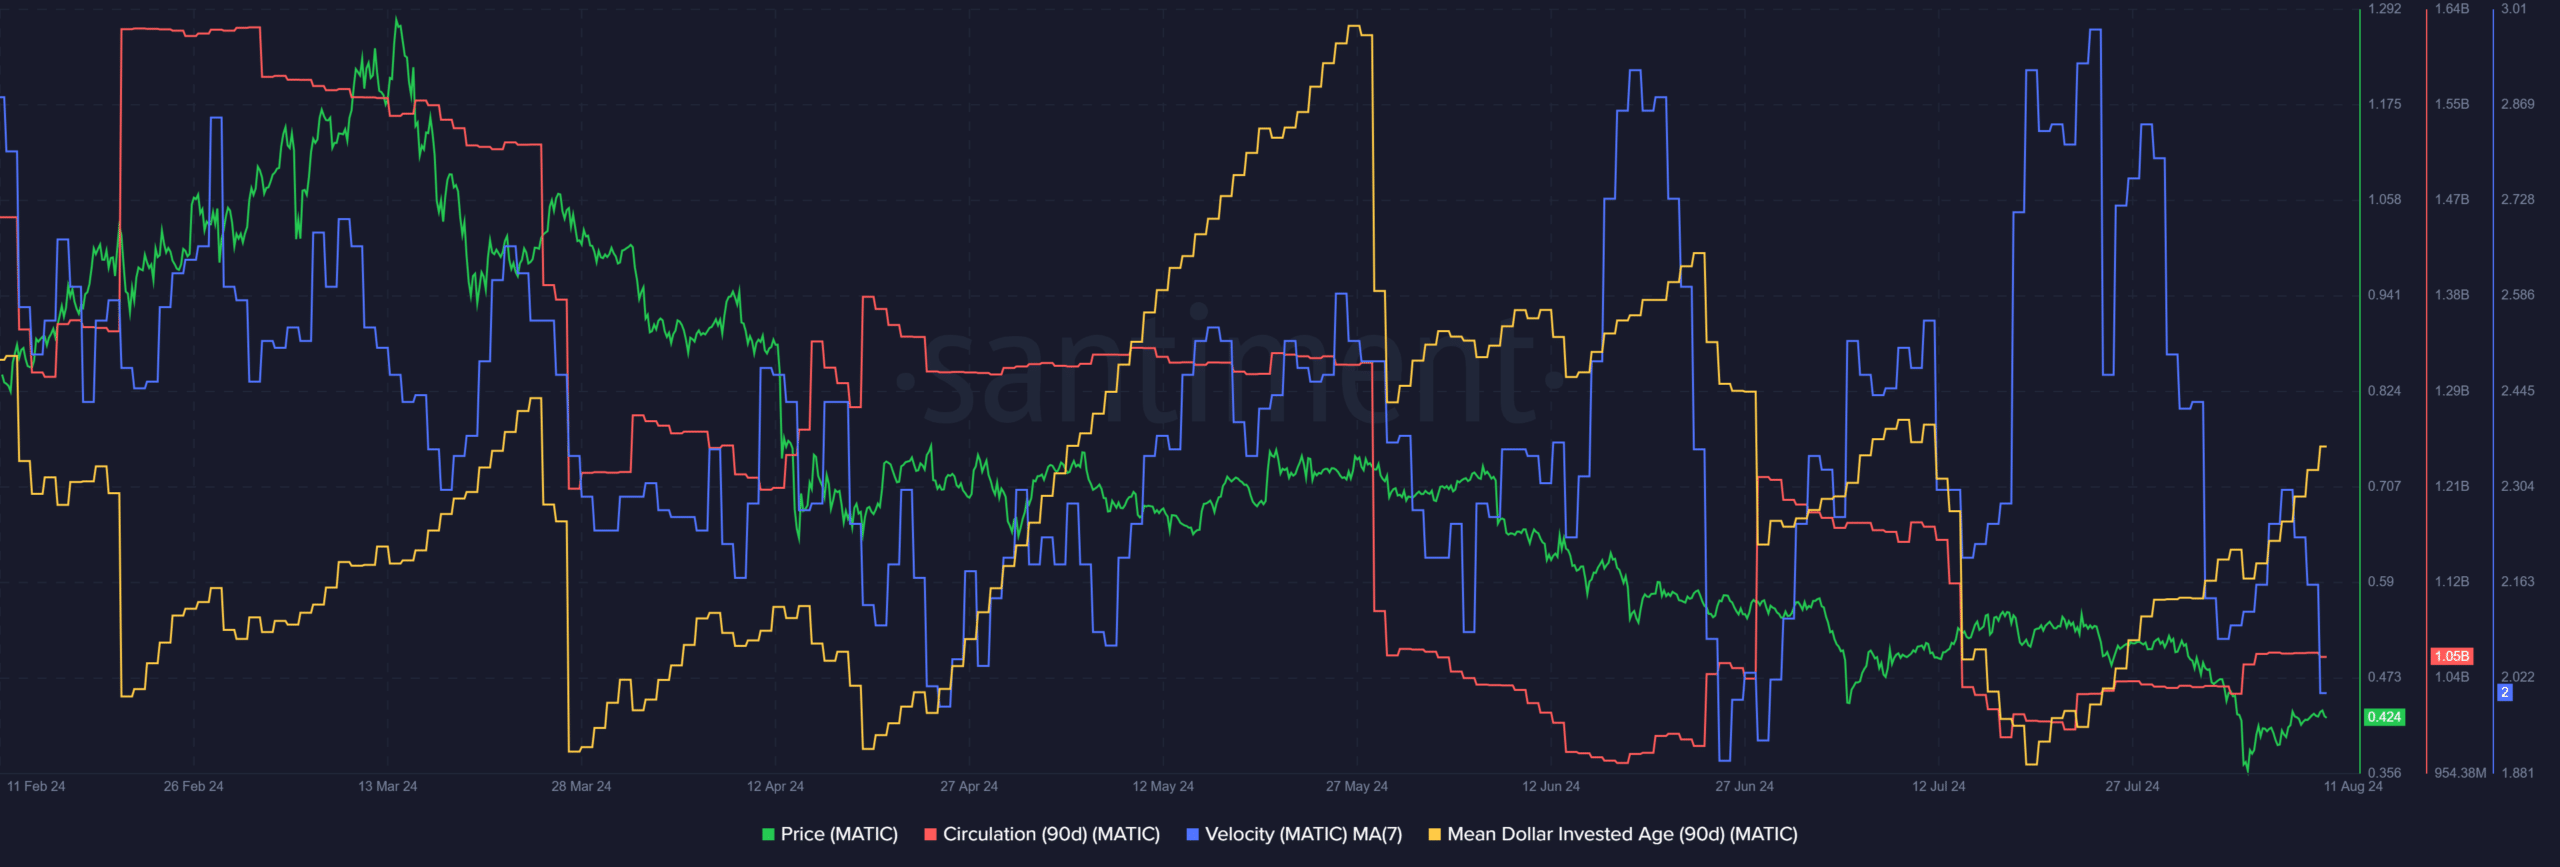
Source: Santiment
The circulation metric dropped in July while the velocity jumped higher. This indicated volatility and speculative trading. Over the past ten days, the metric trends showed holders were more reluctant to sell.
Read Polygon’s [MATIC] Price Prediction 2024-25
This could be a sign of confidence, but all other signals remained bearish.
The mean dollar invested age was trending higher, another sign of long-term holdings. A drop would suggest increased token movement and would aid the chances of a price recovery.


