Could SAND climb to $4.4 and beyond with its recent momentum

Disclaimer: The findings of the following analysis are the sole opinions of the writer and should not be considered investment advice
The Sandbox dropped to $2.55 in January, when there was intense selling pressure in the market and the sentiment was extremely fearful. Another wave of selling was seen in mid-February, but The Sandbox was not as badly affected by this selling pressure. In fact, the token has held up better than expected since January. Moreover, a couple of weeks ago the blockchain gaming firm said that they had a partnership with HSBC which would see the bank acquire a plot of LAND in The Sandbox metaverse. Was the time ripe for a bullish run?
SAND- 1D
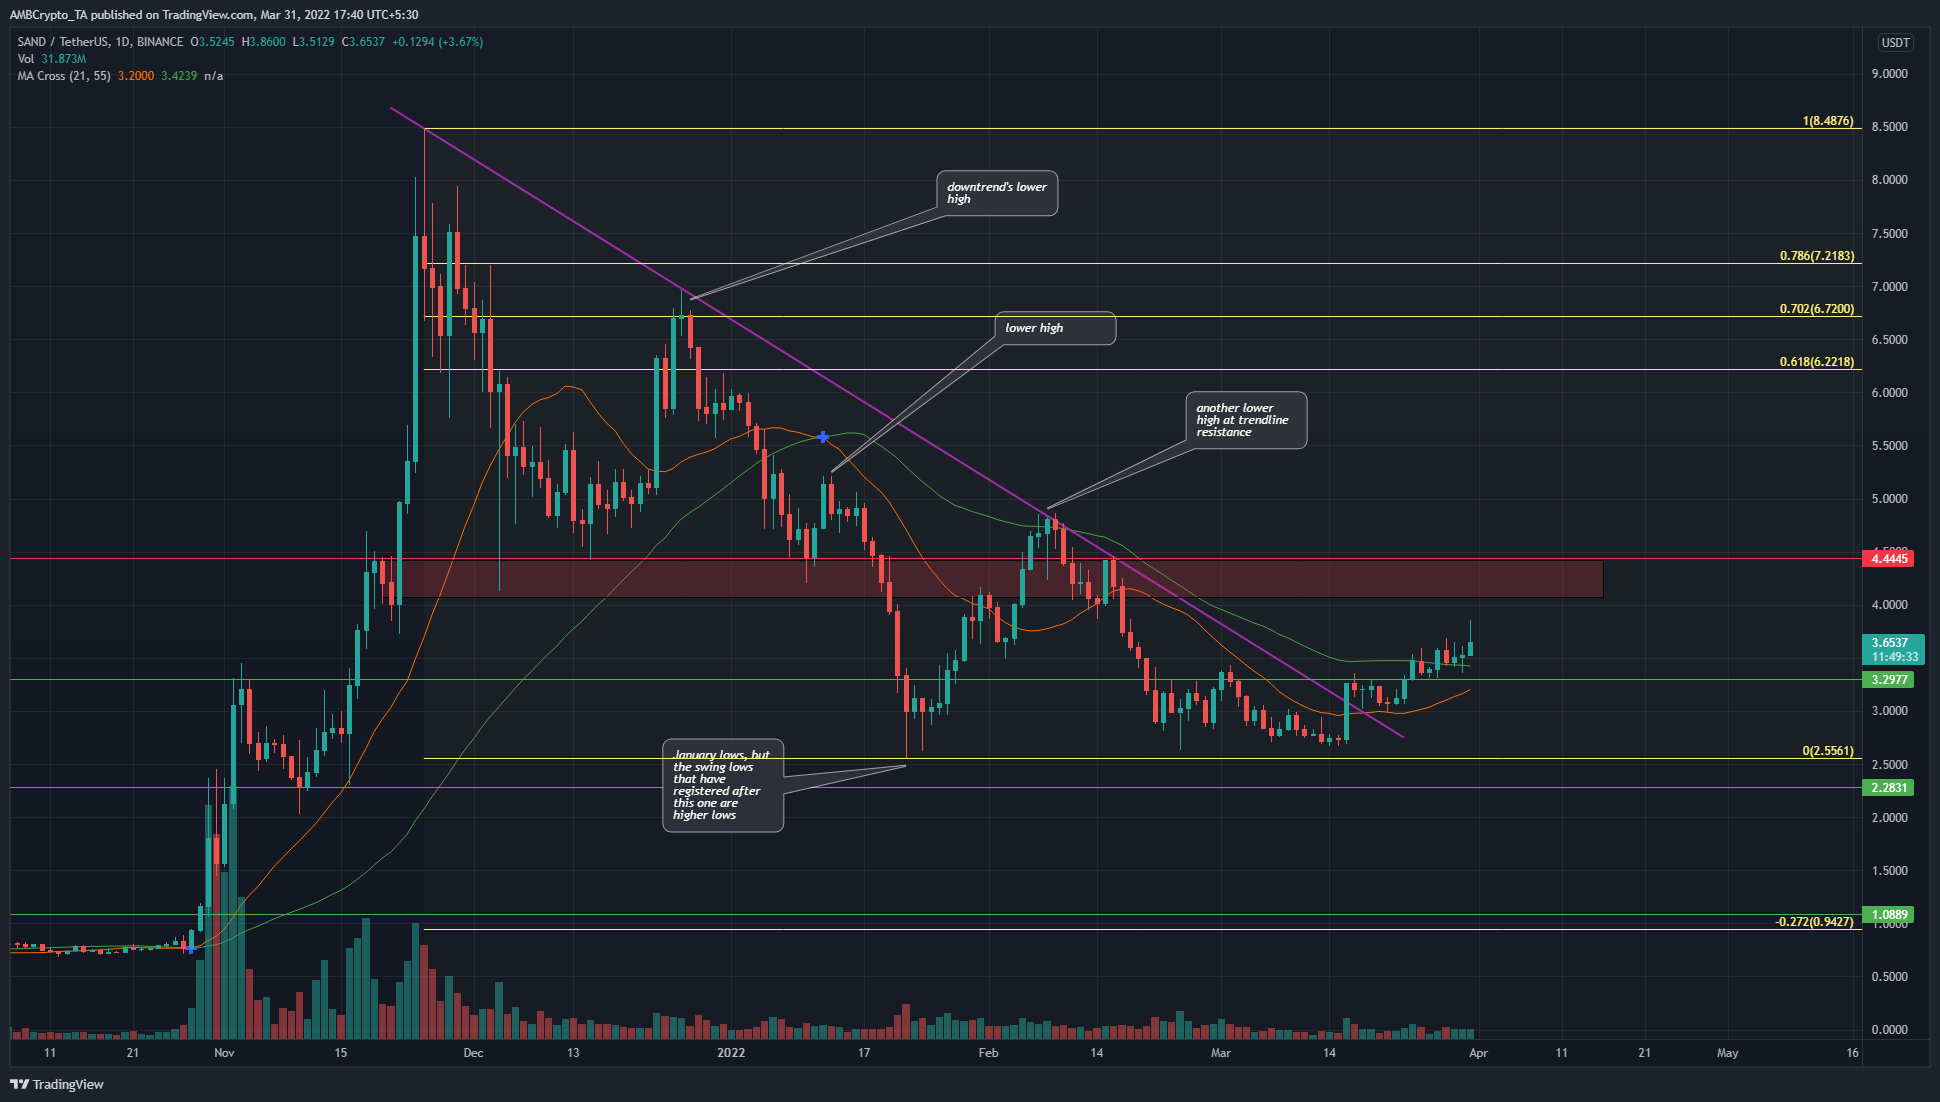
In purple is represented the downtrend the token has been on since mid-November, dropping from $8.48 to $2.55 in January. Based on this move, a set of Fibonacci retracement levels was plotted (yellow).
As mentioned already, in the months following January, the price has not breached those lows but has formed higher lows, which pointed toward the presence of buyers in and just above the $2.56 area.
On the back of this demand, SAND has rallied around 40% from $2.68 to $3.7. Further north, the $4-$4.4 area could be an area to take profit at, as sellers are expected to be strong here.
Rationale
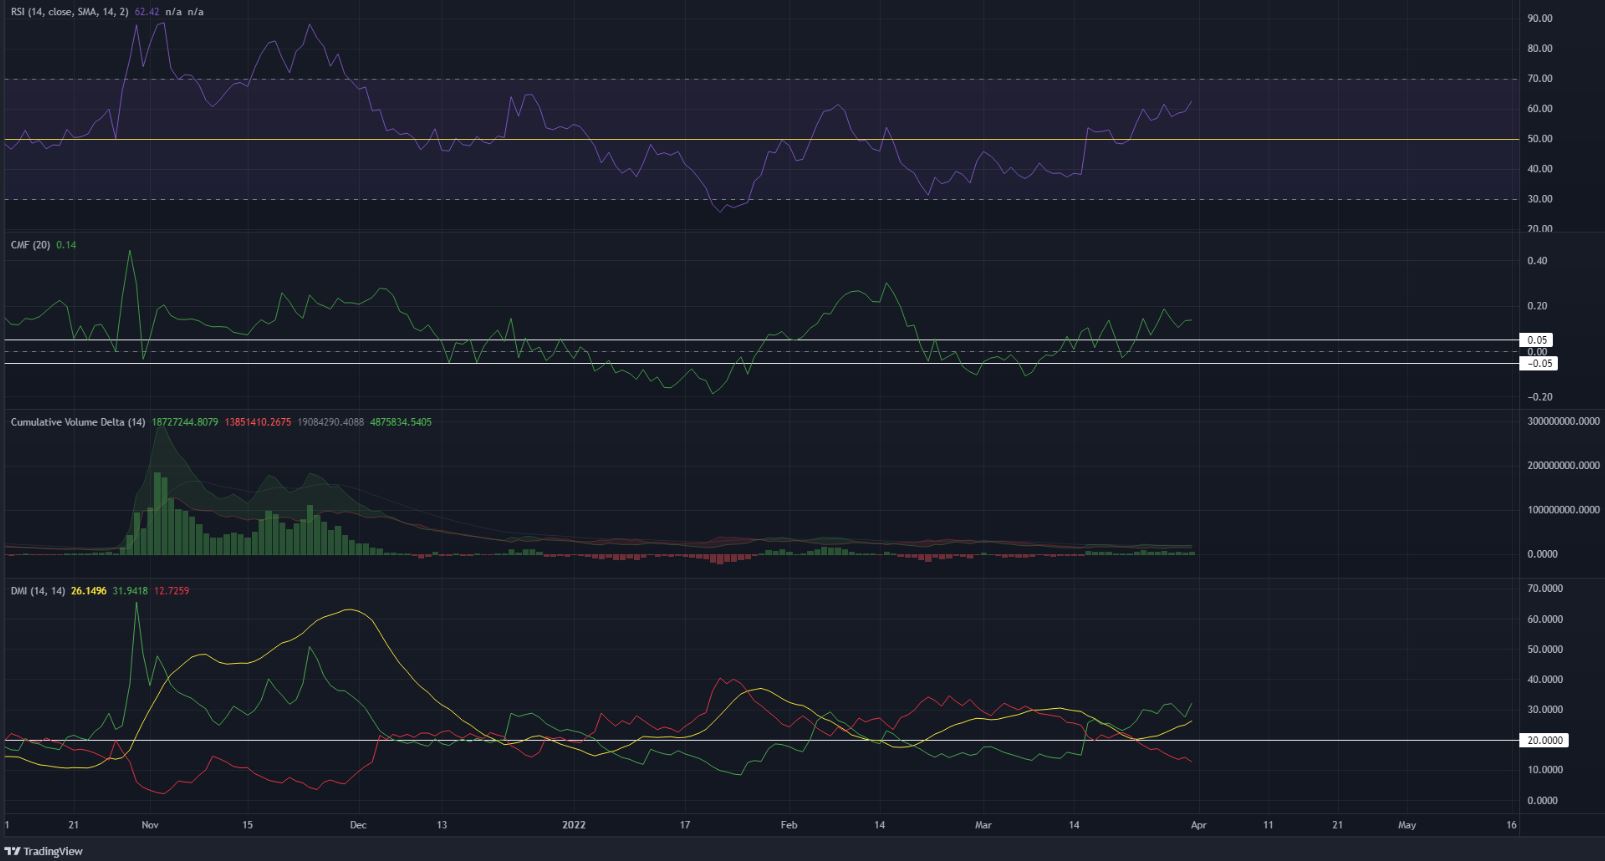
The RSI on the daily chart climbed above neutral 50 to stand at 62, which was indicative of strong bullish momentum. Alongside, the Chaikin Money Flow showed a value of 0.14 at press time while the CVD was also in the green over the past two weeks.
Together, it showed that there was good buying pressure behind SAND’s rally. The DMI also showed that a strong bullish trend was in progress. The 21 and 55-period SMAs (orange and green respectively) were beneath the price, which showed that the recent bullishness has been relatively quick.
Conclusion
The fact that $2.55 has not been breached since January, combined with SAND’s recent rise above $3.44, meant that the market structure was in favor of the bulls. The momentum was in favor of the bulls as well. And, there was evidence of steady demand. To the north, the $4-$4.4 area posed strong resistance. A move past the $4.44 resistance level would likely see SAND climb to $6.2-$7.2.


