Could Solana see a bounce here as it approaches a demand zone

Disclaimer: The findings of this analysis are the sole opinions of the writer and should not be considered investment advice
The trend in recent months for Solana has been firmly bearish. In 2021, Solana and its native token SOL experienced tremendous growth. The price climbed from $1.5 at the beginning of 2021 to $259.9 at its zenith. In the past few weeks, the $80 area was tested in search of demand, and SOL climbed back to the $116-$120 area. At press time, the price was once again just above the $79.4 support level. The most pertinent question here is- Can another bounce arrive?
SOL- 12H
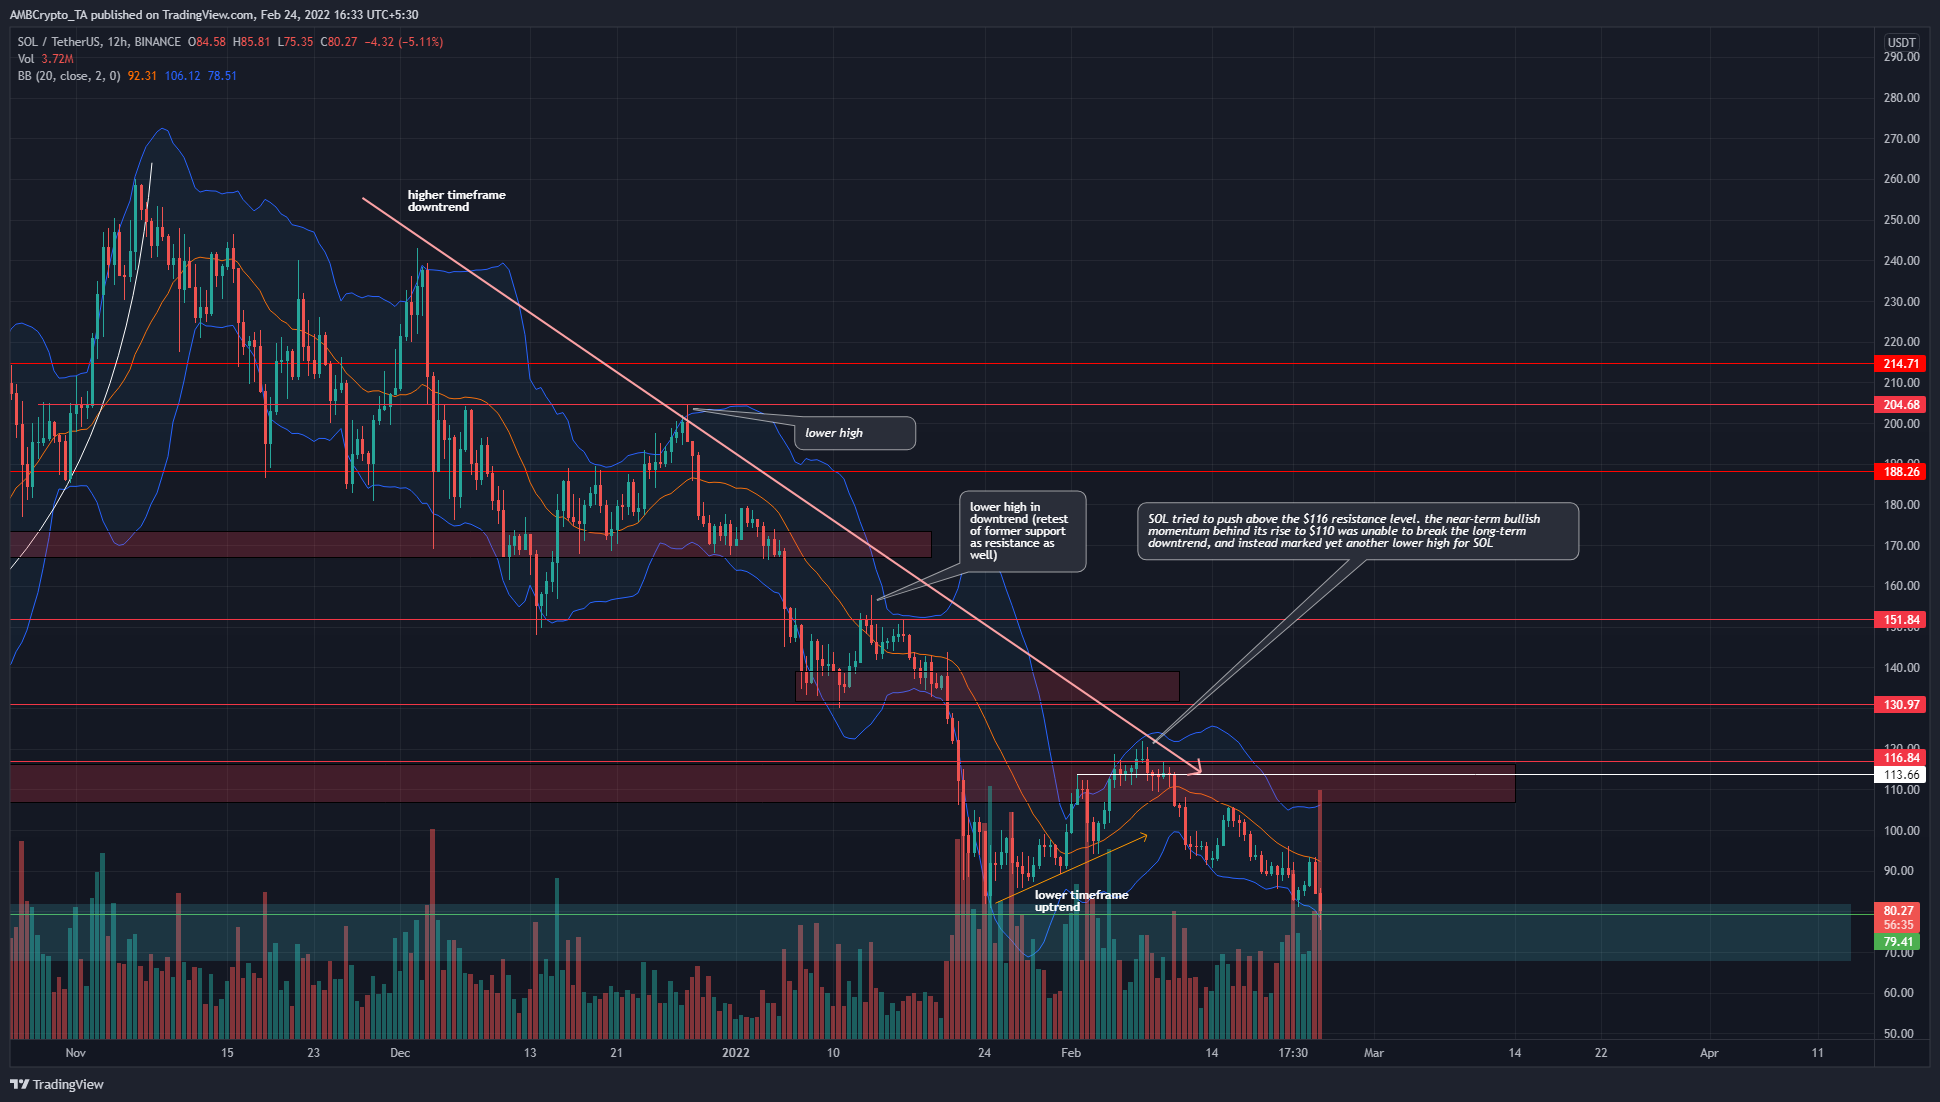
The premise for yet another bounce from the $80 area (cyan box) is the assumption that Bitcoin might be near a local bottom, and Solana could follow its lead. However, this was not yet proved to be the case, and demand was simply not present. Demand is the prerequisite for a short-term rally.
Instead, longer time horizon traders would be far more comfortable making friends with the trend. That meant looking for an opportunity to short SOL.
The Bollinger bands (blue) showed that the price has been volatile in recent weeks, and also the price was trading near the lower of the two bands. This could see contrarian traders push prices toward the 20-period moving average (orange) which stood at $92.31 at the time of writing.
Rationale
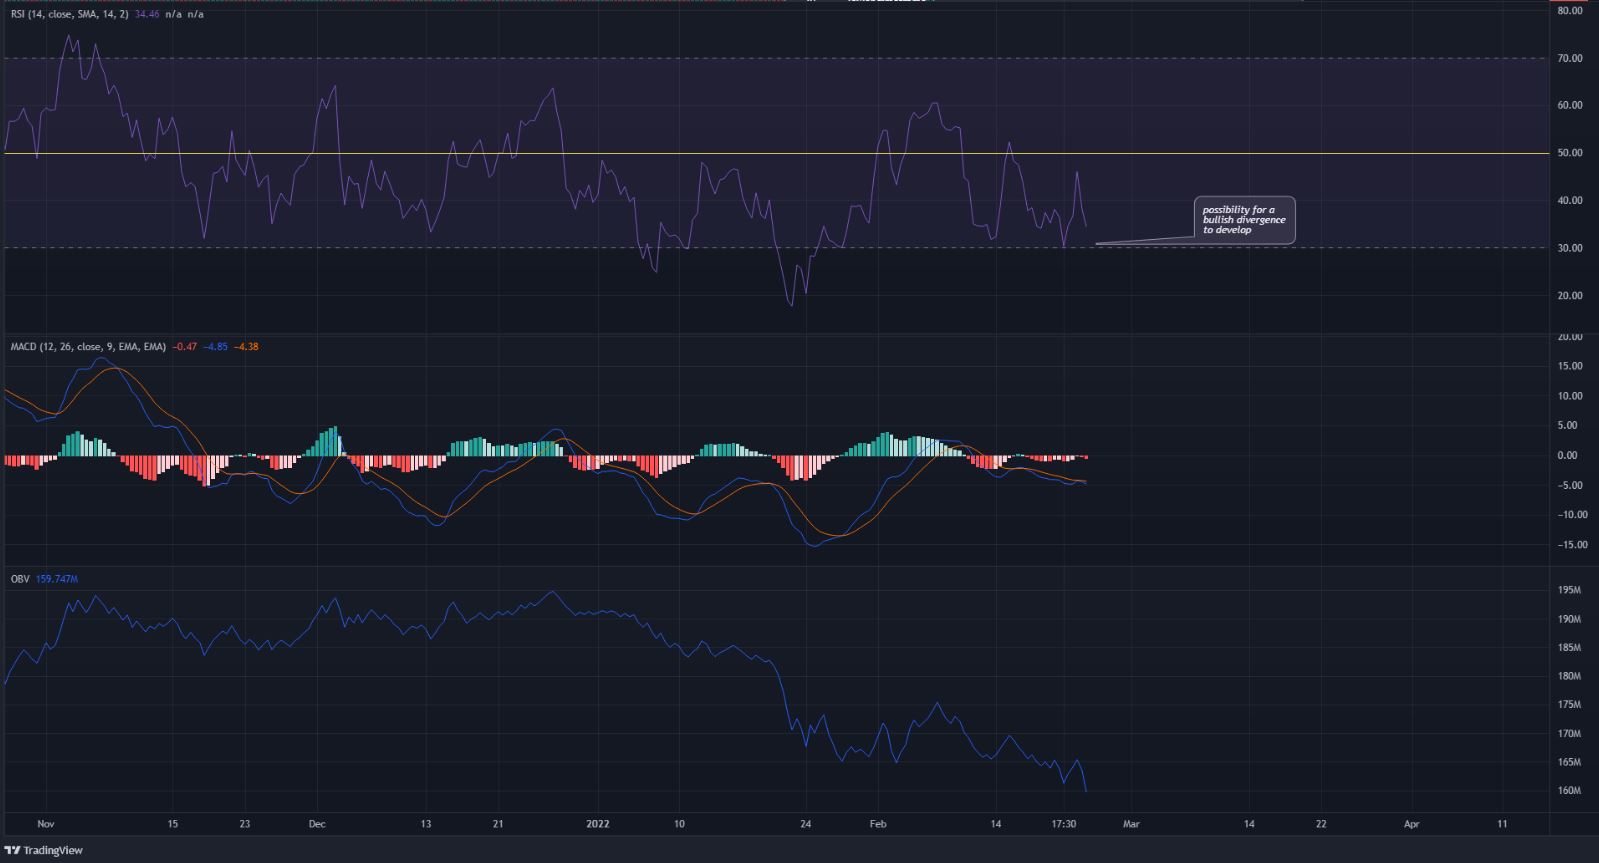
The RSI has been unable to push above the 60 mark during Solana’s rally earlier in February. Subsequently, the RSI dropped below neutral 50 and nearly reached the oversold territory. In the next few days, it was possible that the RSI would register a higher low even as the price formed a lower low.
The MACD, like the RSI, struggled to stay above the zero line on the 12-hour charts. It formed a bearish crossover and was moving below the zero line at the time of writing. The OBV was also dropping swiftly- and selling volume has already been higher than the buying volume earlier this month.
Conclusion
Contrarian traders on lower timeframes could cause a bounce in SOL’s prices, and the 20 SMA at $92.3 could be an attractive location to enter short positions at. However, the market structure and the fear in market participants meant that none but the savviest traders have any business “buying the dip” until conditions change.