Crypto Fear and Greed Index at 31: Should Bitcoin traders be concerned?

- The Bitcoin Rainbow Chart is extremely bullish long-term, projecting a potential $200k-250k target by the end of 2025
- Technical analysis helped temper expectations and showed that the trend remained bearish for now
Bitcoin [BTC] was trading at $84.5k at press time. The trading session on the 14th of April is expected to be volatile, and the rest of the week could see BTC post losses.
As The Kobeissi Letter pointed out, the uncertainty around the bond market could impact the stock markets and, in turn, the crypto market.
In an earlier report, it was pointed out that a spike in the Open Interest (OI) signaled caution, but there was a chance of a move toward $87k. Despite this possibility, traders and investors should not expect a bullish breakout.

Source: Alternative.me
The Crypto Fear and Greed Index was at 31, showing intense fear in the market. Market volatility, social media engagement, volume, Google trends, and BTC dominance data are used to compute the crypto fear and greed values.
The chart showed that the sentiment has been predominantly fearful since February.
This trend has not changed bullishly, even though BTC was back above the key horizontal level at $82.5k. The market-wide turmoil needs to settle down before Bitcoin can trend upward.
Bitcoin is “still cheap” claims the Rainbow Chart

Source: Blockchain Center
The Bitcoin Rainbow Chart signaled a buying opportunity for long-term investors. It showed BTC was “still cheap”. In previous bull runs, the “Sell, seriously SELL!” territory or the maximum bubble territory has marked the cycle tops.
Assuming something similar happens in late 2025 and BTC reaches the “SELL!” territory, its price would be around $250k, according to the Bitcoin Rainbow Chart.
Although the chart is fun, easy to read, and inherently extremely bullish long-term, investors must be cautious and not use it exclusively to make their decisions.
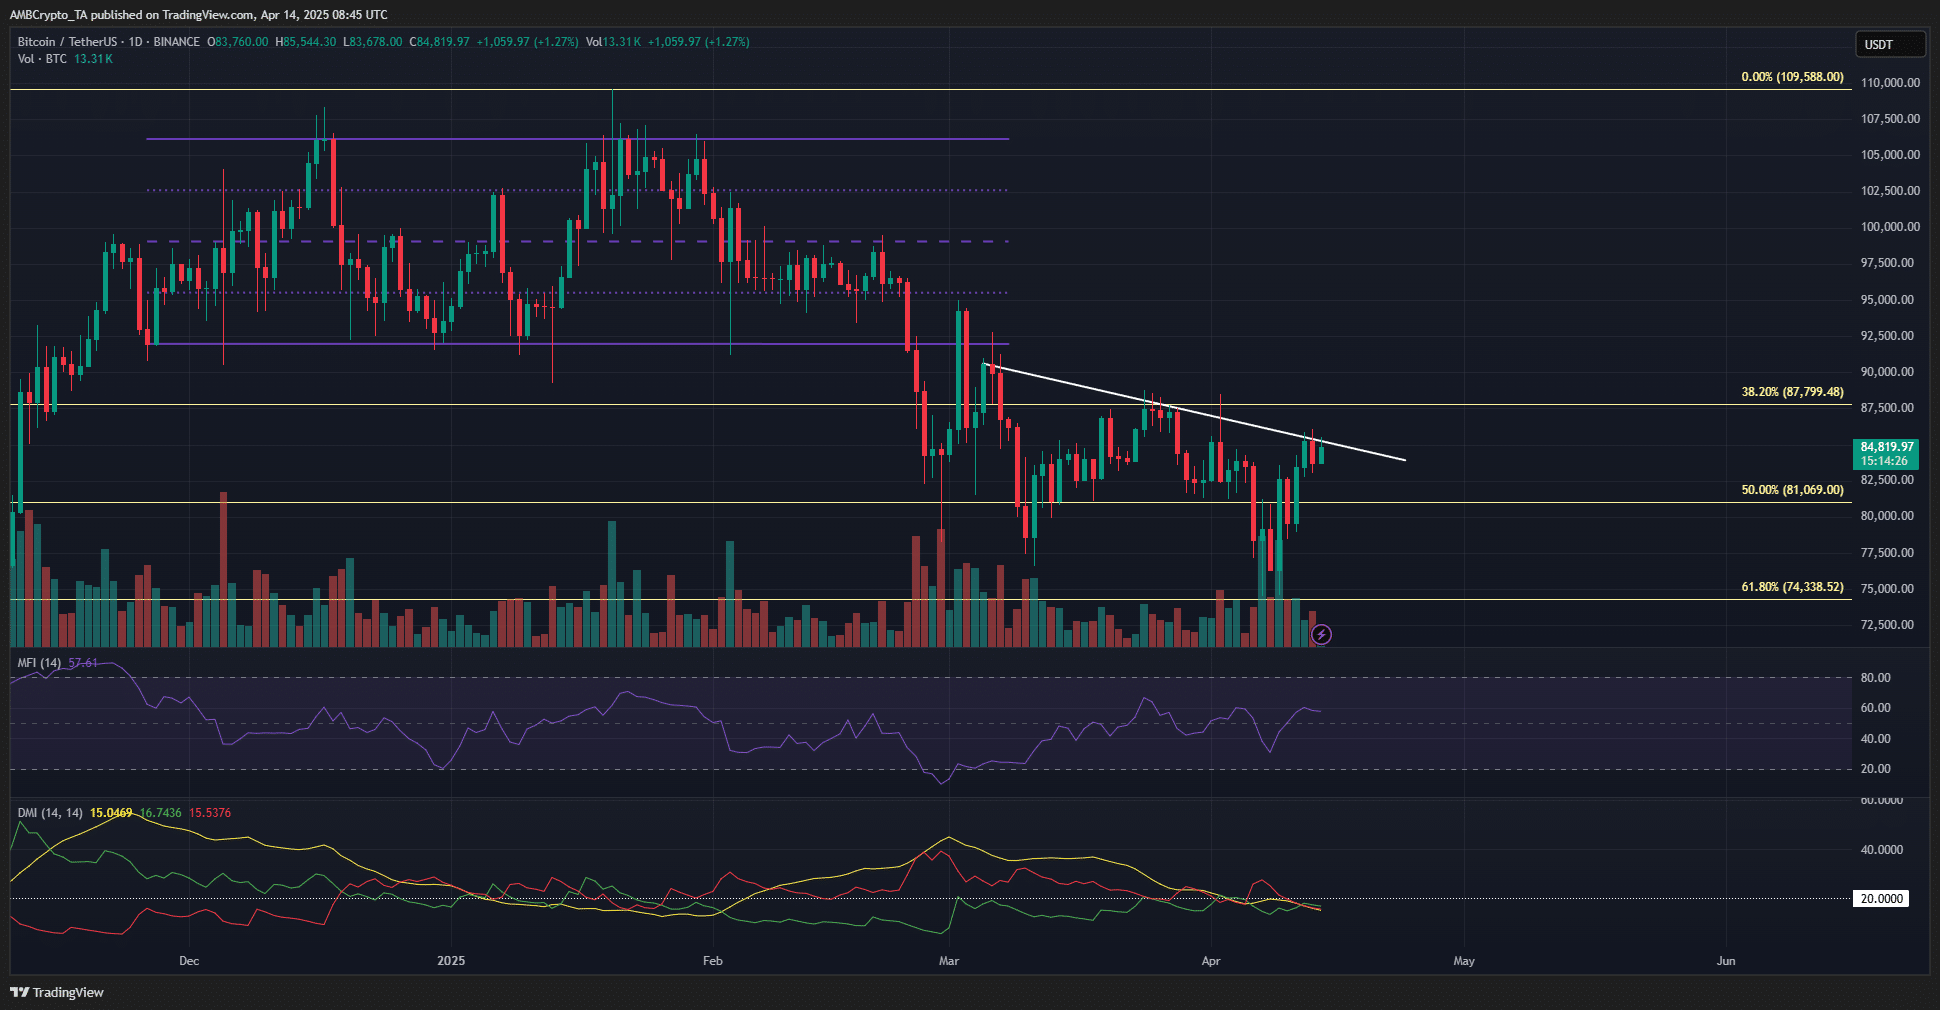
The 1-day chart showed that the trend remained bearish. The price has not made a new higher high and toiled underneath a trendline resistance over the past month. The MFI was just above 50 to show a bullish market.
The DMI showed that a strong trend was not underway, as the ADX (yellow) was under 20. With a bearish structure and fearful sentiment, traders and investors can remain sidelined or bearish on BTC.
However, the build-up of liquidation levels around $89.5k meant it was a feasible short-term price target.
Disclaimer: The information presented does not constitute financial, investment, trading, or other types of advice and is solely the writer’s opinion


