
- Bitcoin breaks downtrend channel.
- Bitcoin’s top traders average leverage delta falls below 2.
Bitcoin [BTC] continues to gain traction as the crypto markets show signs of recovery from the recent downturn.
In the hourly timeframe, BTC has finally broken out of the downward parallel channel, which has persisted since late July 2024. The range has lasted for more than 5o days.
The price action of BTC/USDT has showed this a potential turning point for Bitcoin with a textbook retest. The price action was forming of higher highs and higher lows as it approached the breakout resistance.
Typically, when markets consolidate for extended periods, a parabolic run often follows. This could set BTC up for a target of $75k, slightly surpassing its all-time high.
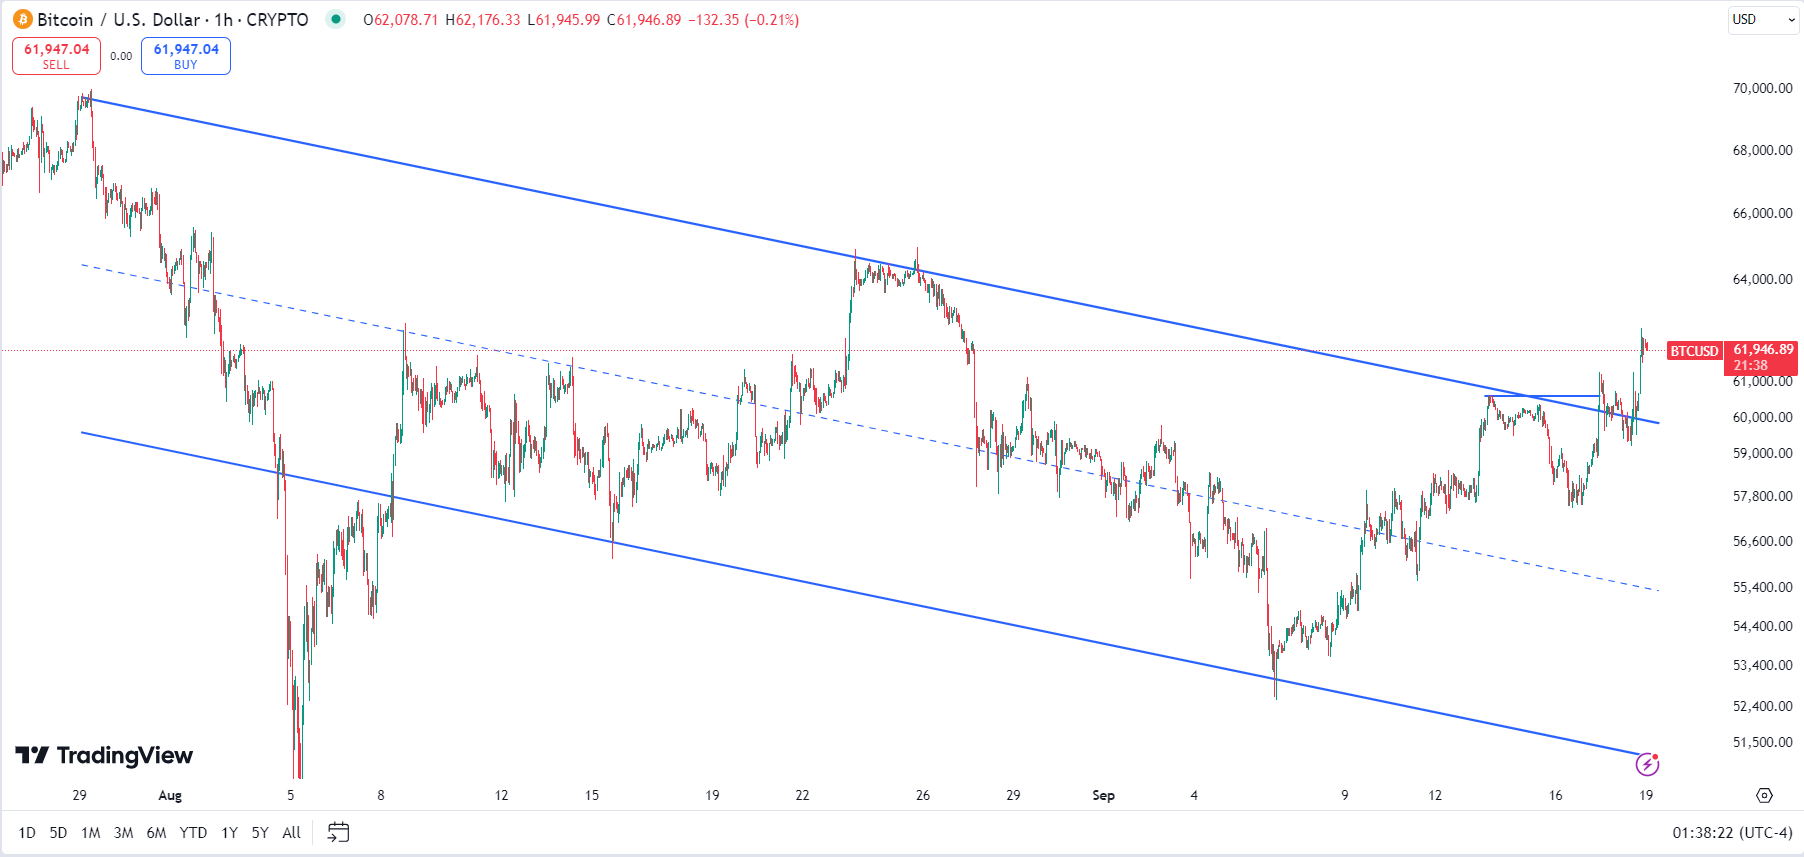
Source: TradingView
A rally toward this critical zone is achievable if market conditions remain favorable, as BTC has reclaimed the $62k level and now targets $65k before potentially reaching $75k in Q4 2024 or early Q1 2025.
Could this uptrend push BTC to $75k by the end of the year? Let’s explore the possibilities.
Top traders’ Average Leverage Delta signals…
Historically, when the top traders’ average leverage delta dips below +2, as it did recently before rising to 2.169, an uptrend has often followed.
This adds further confidence that a BTC rally might have begun. The leverage delta for BTC currently sits at +0.49, indicating that the leverage used by both longs and shorts is nearly equal.
The drop in the top traders’ average leverage delta supports the idea that BTC/USDT’s breakout from the downward trend channel could signal the start of a bull run.
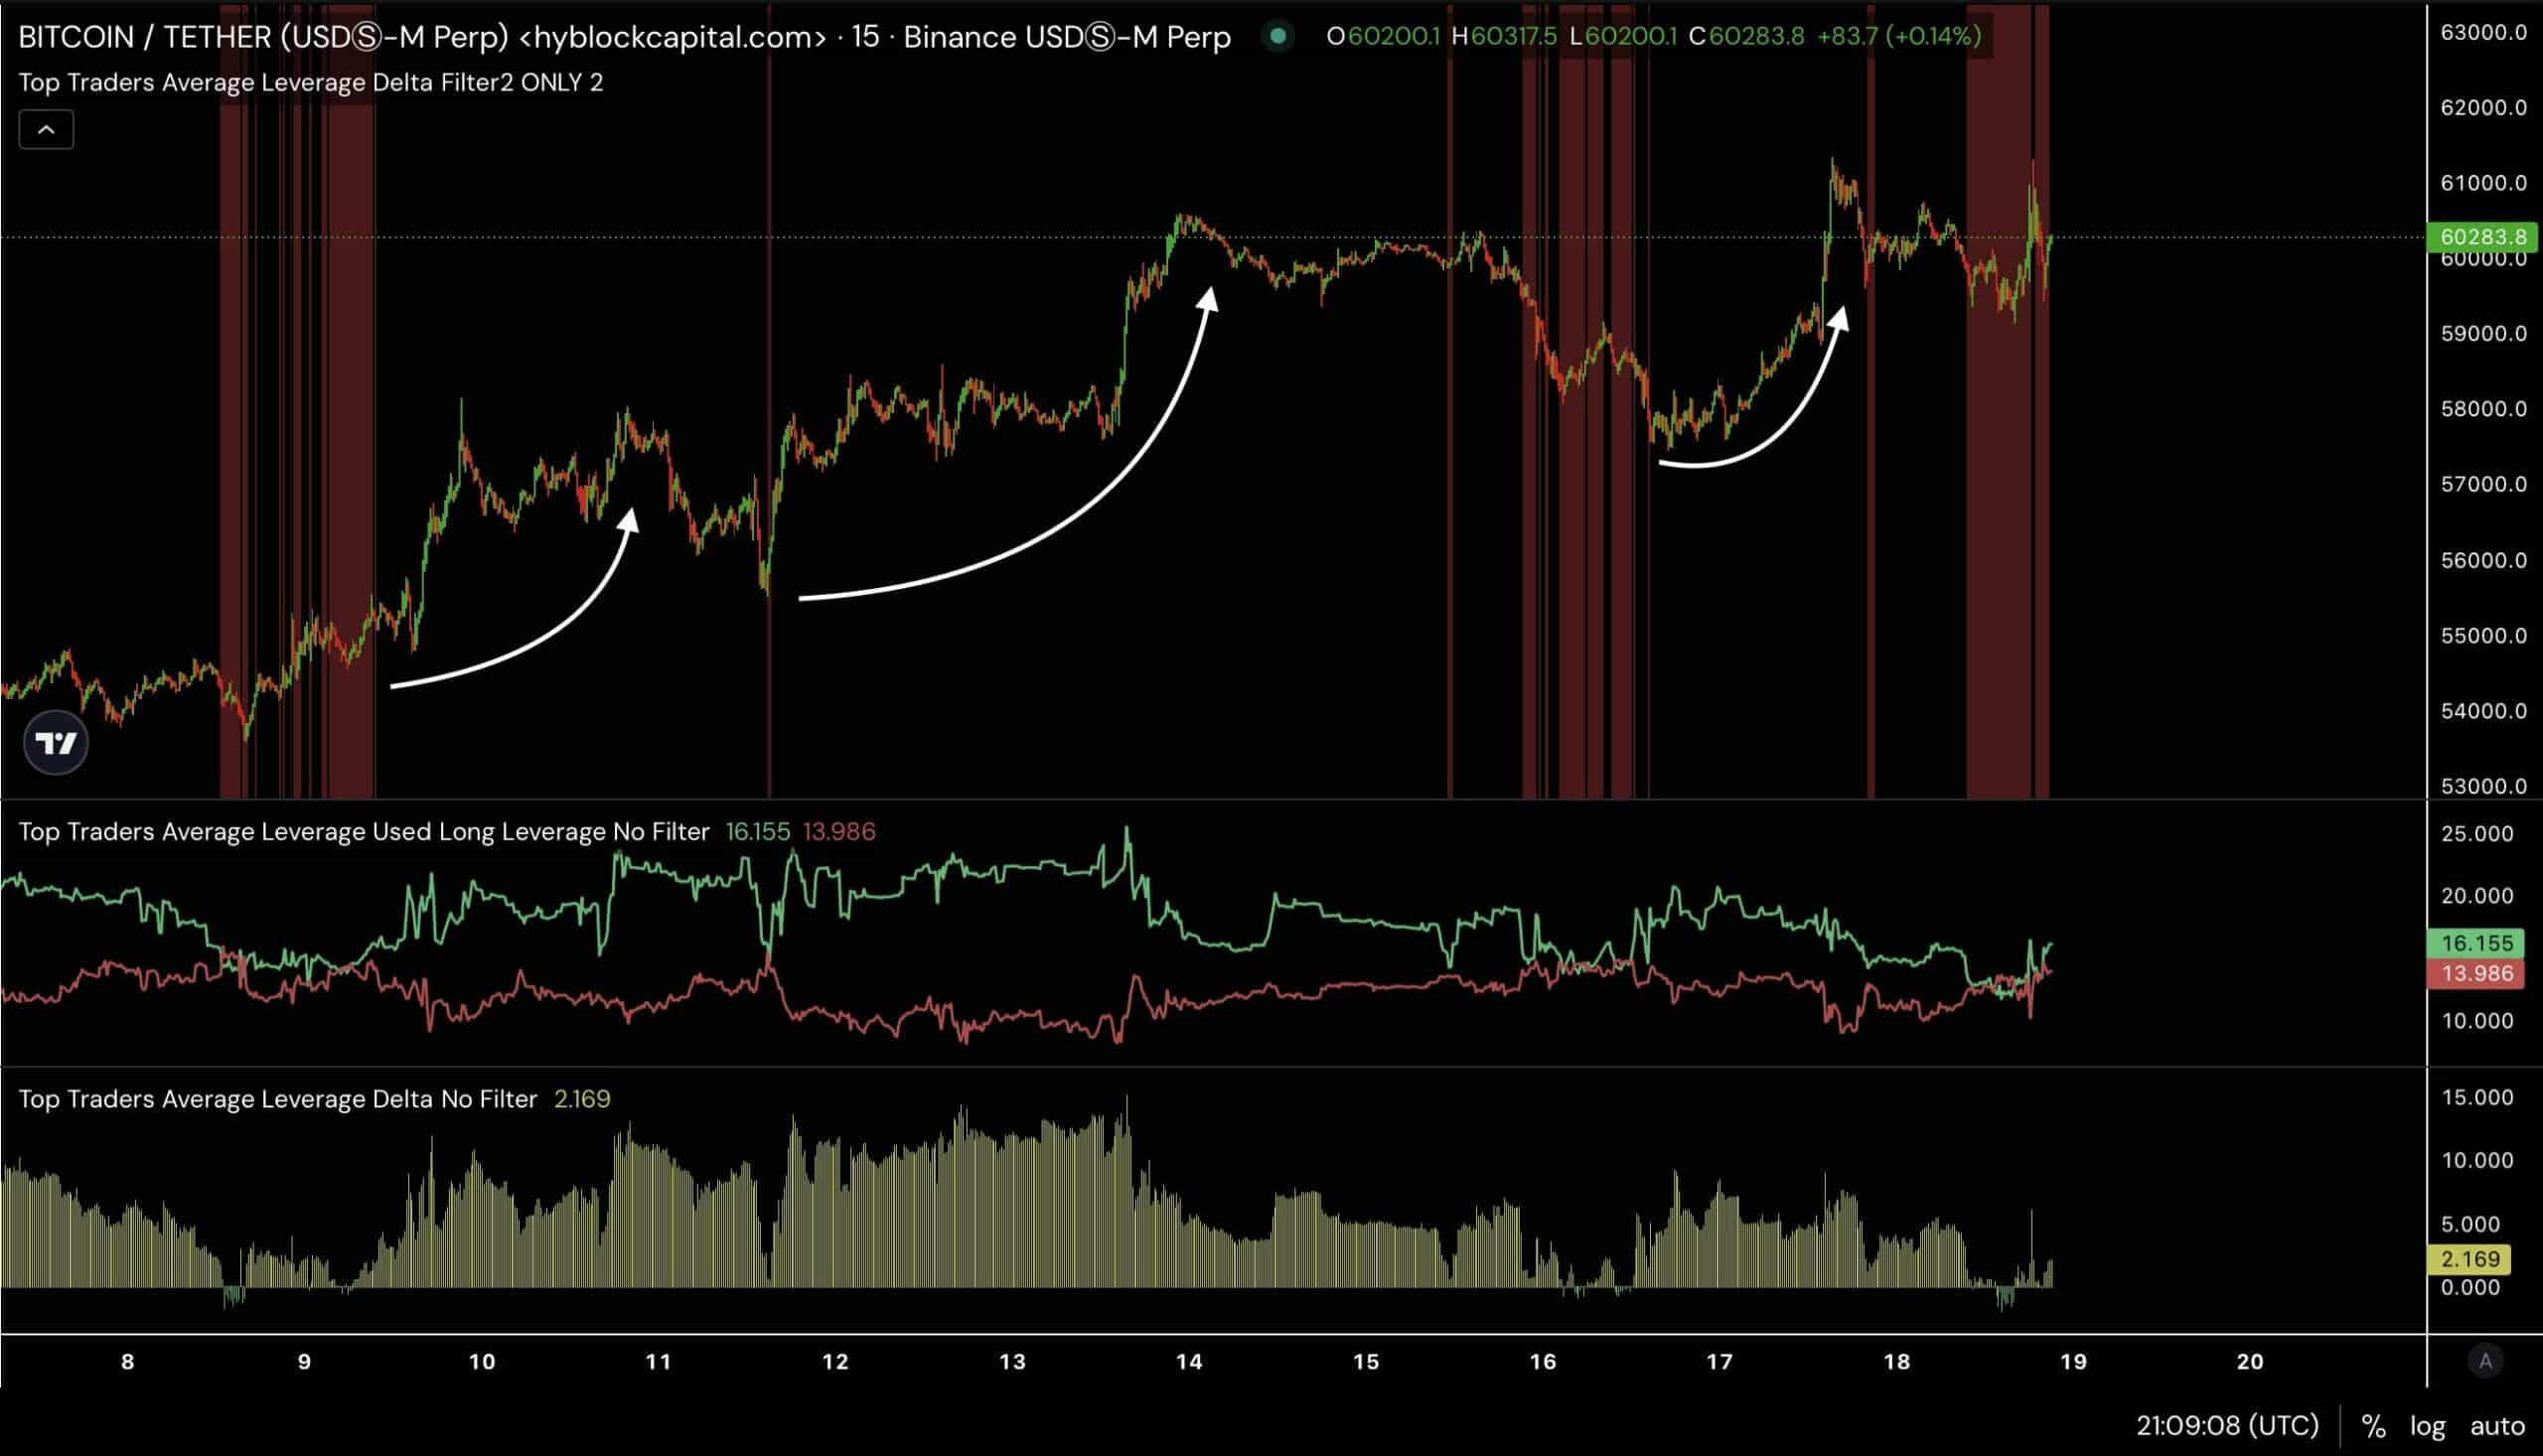
Source: Hyblock Capital
BTC liquidation heatmap
Additionally, Bitcoin’s price often moves toward high liquidity zones. Traders liquidated approximately $179.70 million across futures markets when BTC reached $61,498.
This liquidation might fuel further upward movement as price targets liquidity at higher levels.
A significant liquidity cluster of $730.49 million is also present at the $70182 price level, with another $1.3 billion at $67250.
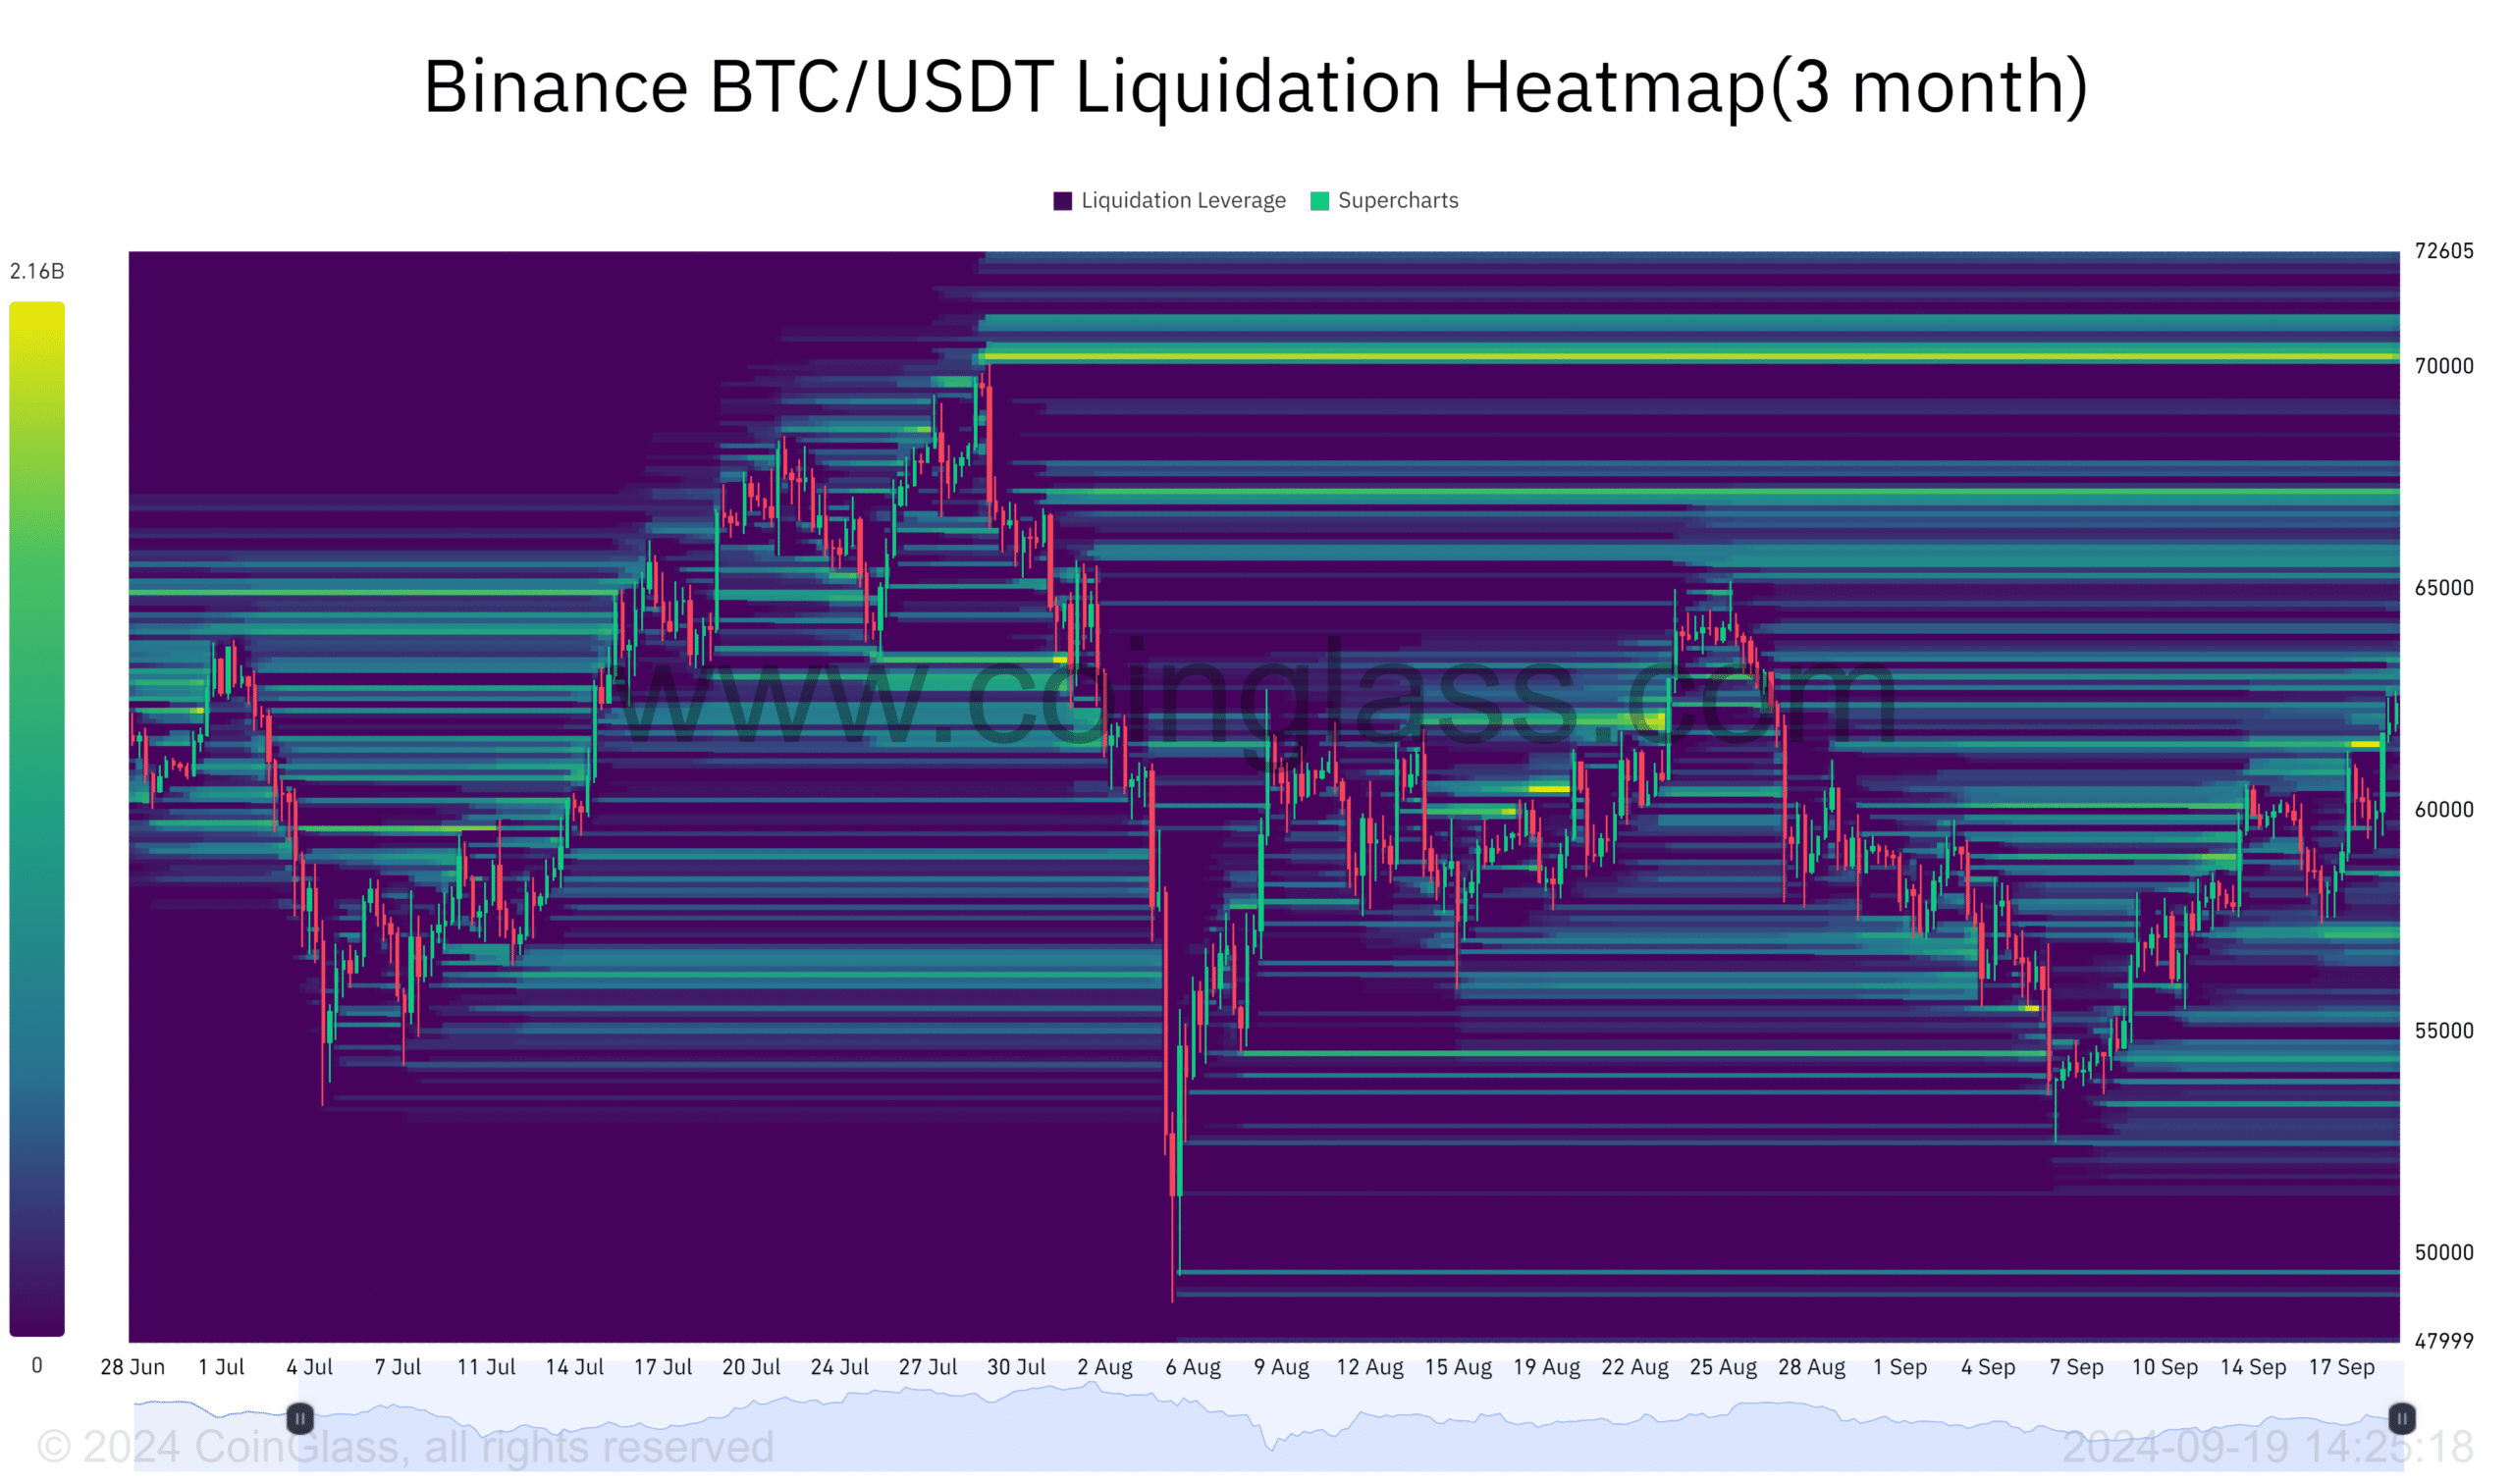
Source: Coinglass
BTC could climb higher to reach these liquidity levels, further fueling its upward momentum, and potentially reaching the $75k target.
The average Bitcoin cycle
Furthermore, the average Bitcoin cycle historically starts 170 days after halving and peaks 480 days afterward.
Currently, BTC is 151 days post-halving, which places it less than 20 days from the historical start of a post-halving rally.
This cycle pattern adds another layer of confidence to the potential rally toward $75k, alongside the top traders’ average delta signaling a bull run.
Read Bitcoin’s [BTC] Price Prediction 2024-25
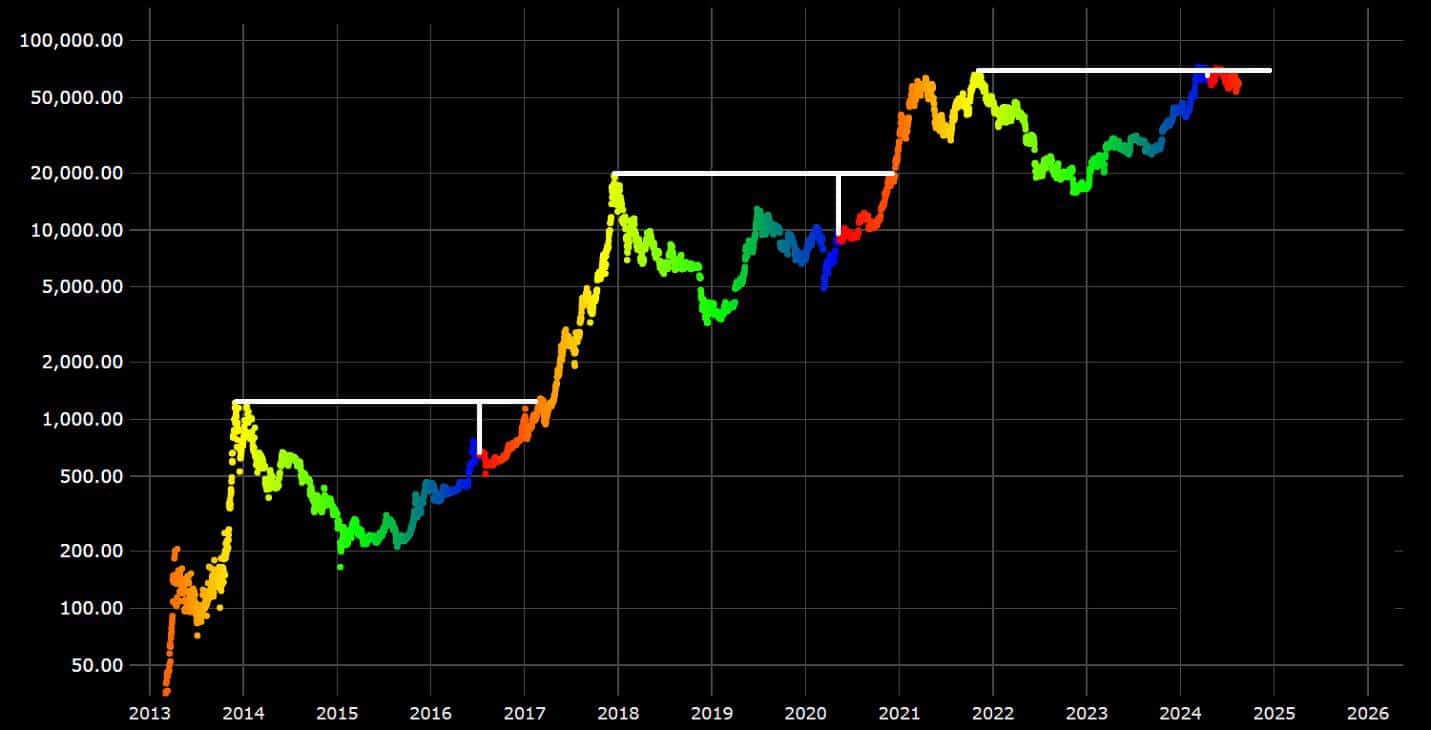
Source: X
The crypto market looks poised for a positive move, driven by technical signals and liquidity patterns, which suggest Bitcoin is primed for higher gains.