Data points to a good shorting opportunity in this coin ahead of a near 50% drop

Although external market factors will always influence the price action of assets and the crypto market, reliance on the price trends could guide one towards a more profitable outcome, which seems to be the case with Litecoin at the moment.
Litecoin to drop further?
Analyzing price patterns have brought forth an interesting observation. Litecoin has repeatedly been subjected to a suspiciously similar pattern since it marked the ATH of $388 in May.
Firstly the altcoin has been in a consistent downtrend wedge for over eight months now. What began as a simple correction continued to maintain the downtrend in 2022. Although there was an attempt at breaching the level, LTC failed to sustain.
Now that the wedge is getting narrower, it seems like Litecoin could take a turn for the worse. Although the critical resistance for LTC is up above $142, its immediate resistance stands in line with the upper trend line at $123. (ref. Litecoin price action and RSI pattern image)
Why $56 is a possibility
Taking the Relative Strength Index (RSI) into account, one can observe the pattern of the indicator’s movement in the bullish and bearish regions.
Since June, the RSI was first stuck in the bearish zone for a good 69 days until August 2021. Following that, for a period of 105 days, the coin lingered mainly in the bullish area.
This was again followed by another 70 days of the indicator being stuck under the neutral line between December and February.
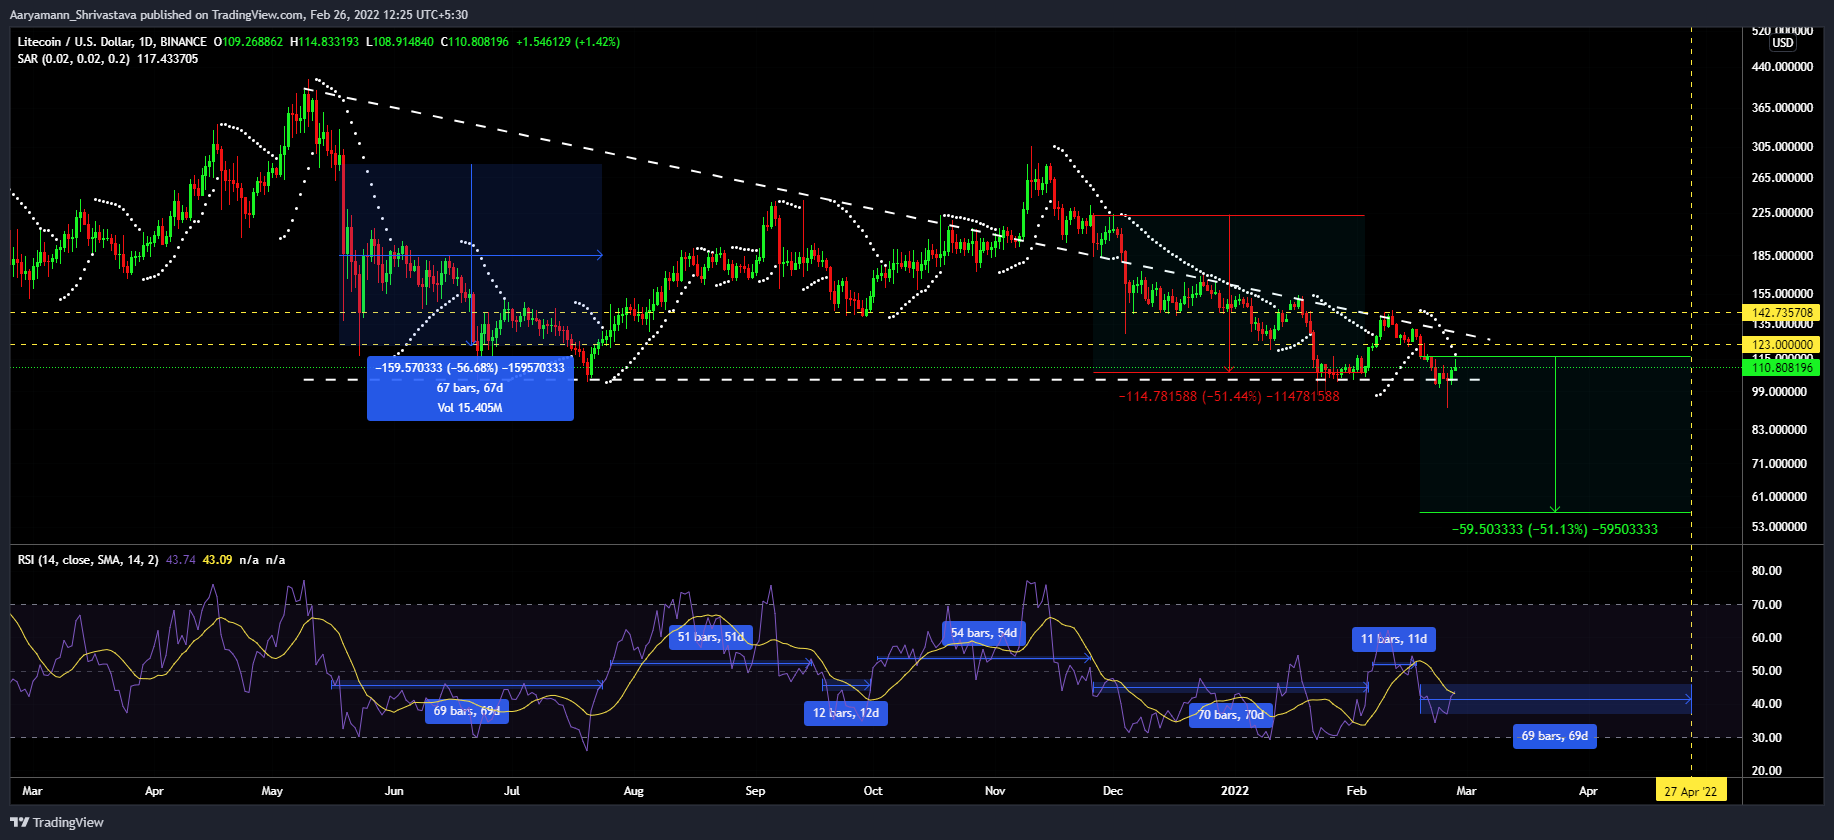
Here is where it gets interesting. Between the bullish RSI stretch, there was a 12 day gap period when the indicator fell below 50.
However, ten days ago, RSI again took a dip, it was below the 50 mark for 11 days. Thus, considering the probability of a repeated pattern, we could see Litecoin sit in the bearish zone for 69 days until 27 April 2022.
Furthermore, Litecoin fell by 56.68 and 51.44% during both the bearish stretches. It can therefore be considered that LTC would fall to $56 if it witnesses another 51% drop.
While price trends suggest a fall, on-chain metrics show that this could be prevented since LTC investors aren’t easily scared. Since about 84% of all LTC holders are long players, the chances of a loss prevention sell-off are low.
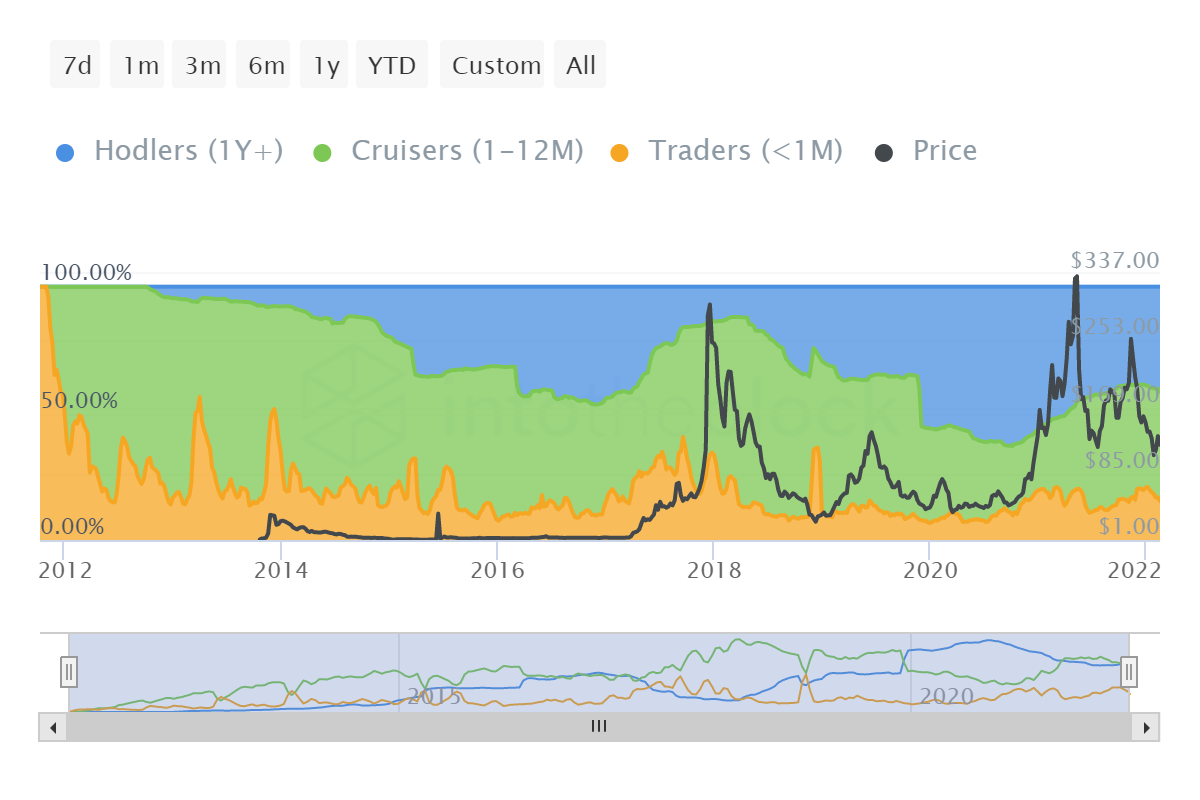
Although during the dip, new investors joined the network, the number of long-term holders also increased by 1.06 million addresses between December and February.
This shows that investors continue to have faith in the network regardless of the current conditions. The critical support now sits at $104.36, and if Litecoin falls through it, $56 could be expected.