
Disclaimer: The findings of the following analysis are the sole opinions of the writer and should not be considered investment advice.
Decentraland registered a low in May at $0.629. It has not yet broken that low in June, and in fact, has established a range over the past week and a half. At the same time, Bitcoin has found some support at $19.8k-$20.1k.
In the next week or two, a move upward for Bitcoin could see MANA register gains. Yet, as things stood, the momentum and selling pressure was in bearish hands behind Decentraland.
MANA- 12-Hour Chart
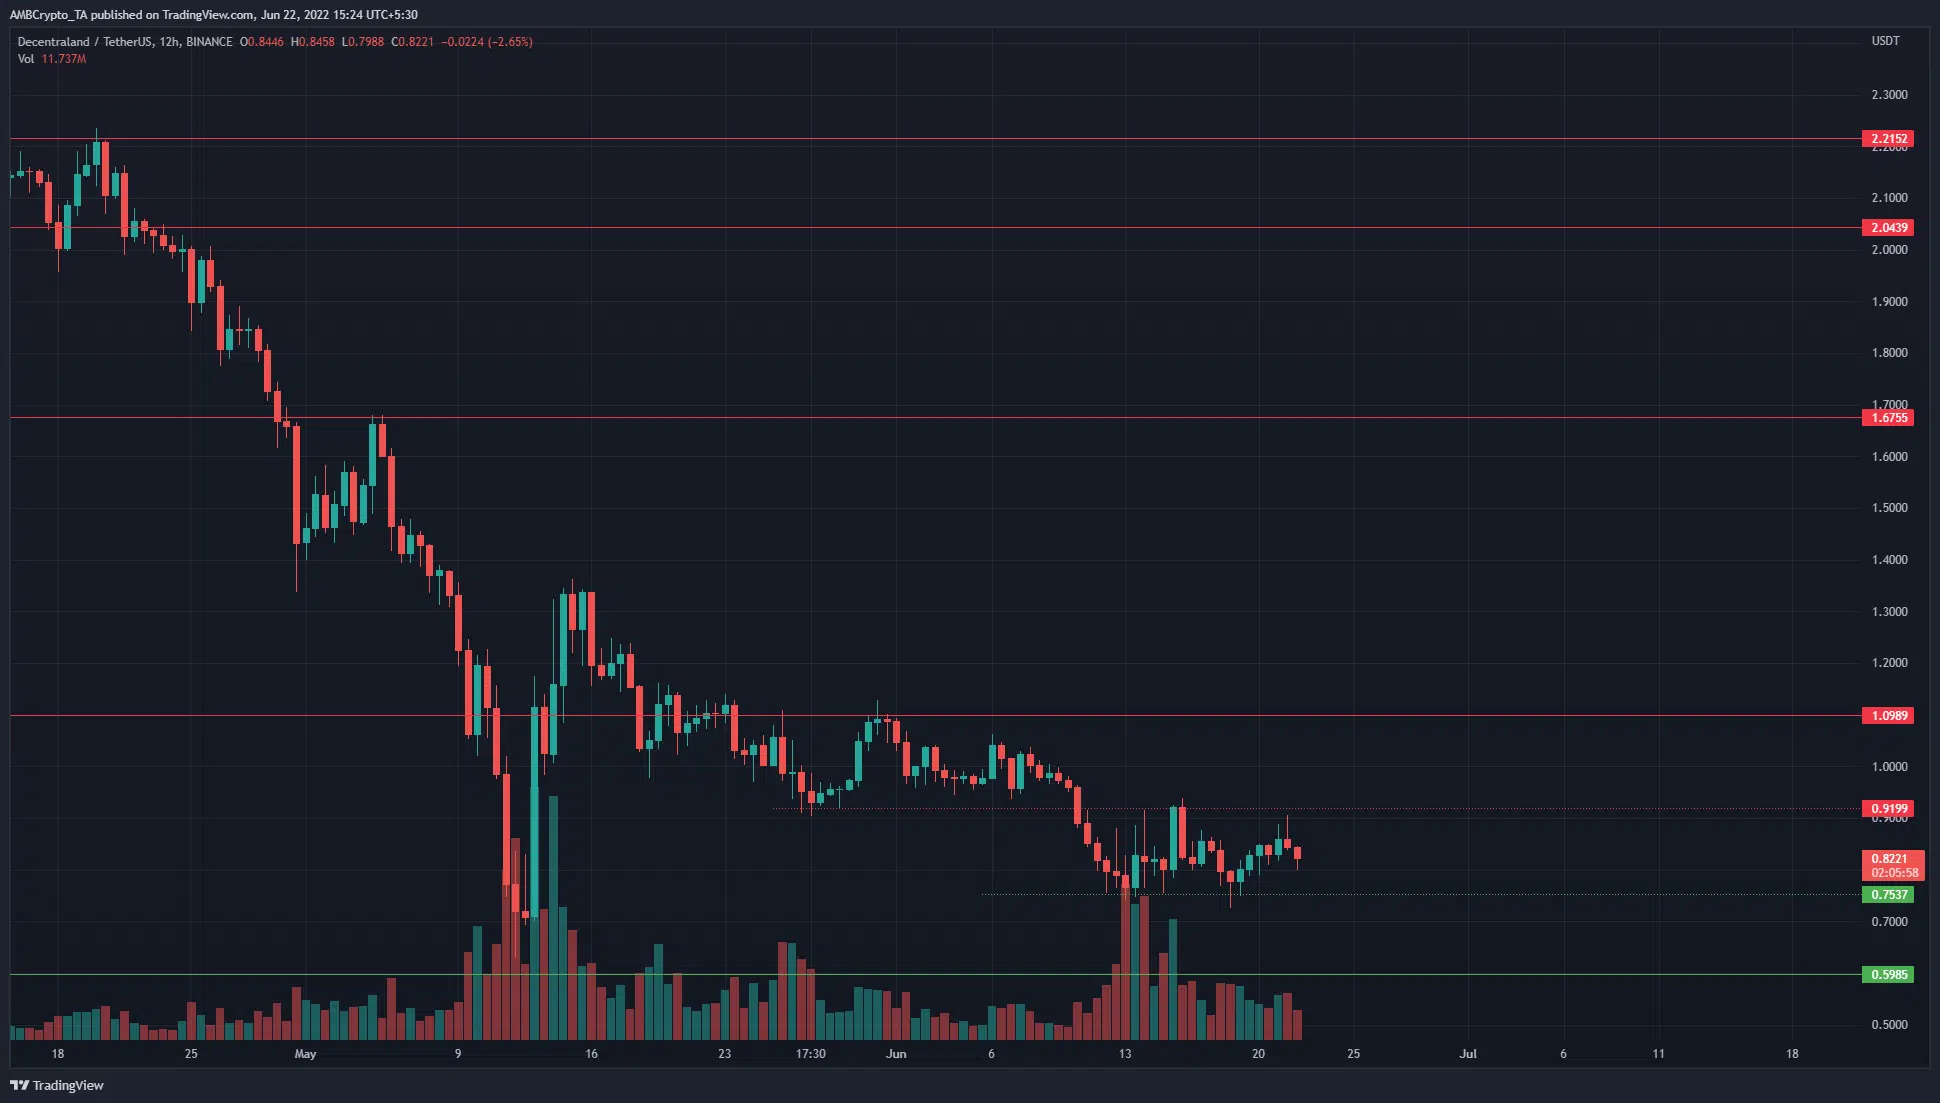
Source: MANA/USDT on TradingView
Since late December, MANA has been on a larger timeframe downtrend. The price action of April and May was characteristic of this downtrend. A series of lower highs and lower lows were seen on the chart.
The low formed in May was at $0.629, while June’s low remained at $0.725. The previous month’s low not being broken could be a sign of encouragement. The $0.92 and the $0.753 levels have acted as resistance and support over the past ten days.
After severe downtrends, a long period of accumulation would generally follow. The range that MANA formed could be that accumulation phase. However, it was only ten days long. After a downtrend of nearly six months, it would likely take many more weeks of ranging price action to establish a bottom.
Rationale
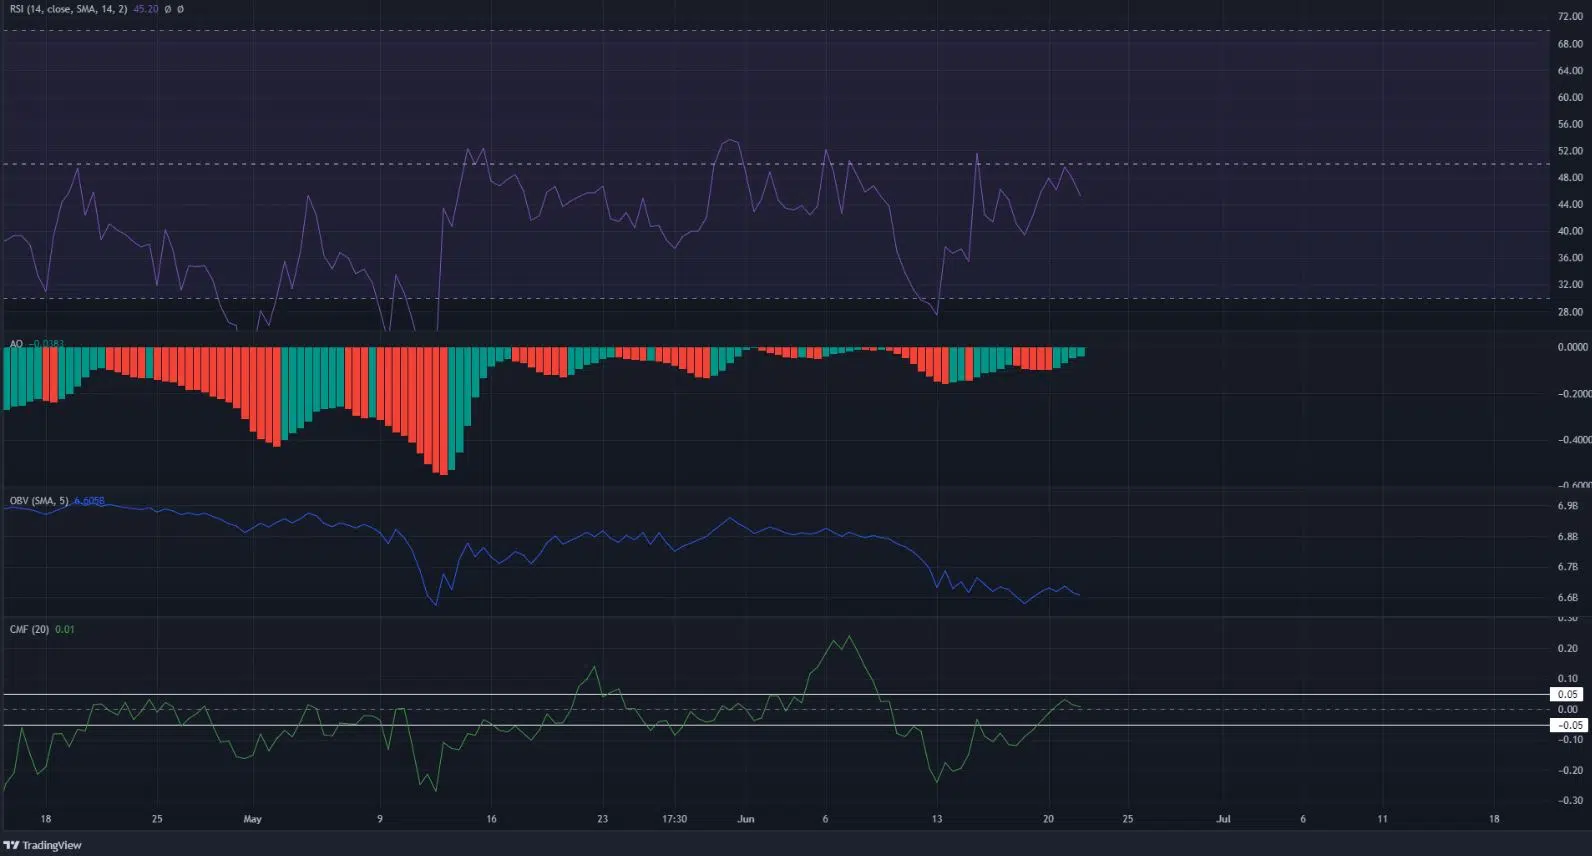
Source: MANA/USDT on TradingView
It has already been highlighted how the $0.92 and $0.753 levels were the ones to watch out for. This information was important for context in understanding the indicators. The RSI and the Awesome Oscillator were below the neutral 50 and zero lines respectively.
This showed that the downtrend was not yet over. Instead, the higher lows formed on the indicators suggested that the downward pressure could be weakening.
The CMF also rose past the zero levels and showed that selling pressure was no longer significant. While this was not a trend reversal signal by itself, it was something to be aware of.
On the other hand, there was no break in the downtrend on the OBV. This signaled a lack of buying volume in the past week, despite the range formation.
Conclusion
The price action remained bearish on higher timeframes, even though the H12 and lower timeframes hinted at weakening bearish momentum. To the north, the $0.92 and $1 levels would be critical resistance levels. A move back below $0.75 would likely see MANA register new lows.