Chainlink’s [LINK] mixed signals – To buy or not to buy?
LINK's movement on the price chart present traders with a good buying opportunity. However, on-chain data suggests otherwise.
![Deciphering Chainlink's [LINK] mixed signals: The Dilemma of buying or holding Off](https://ambcrypto.com/wp-content/uploads/2023/05/AMBCrypto_mysterious_combination_of_puzzle_pieces_charts_and_da_3a083194-638c-4b03-81de-71595511d147.jpg)
- A new report stated that LINK’s movements presented a good buying opportunity.
- An on-chain assessment, however, pointed out that negative sentiment continues to trail the asset.
According to a new report by on-chain data provider Santiment, the number of active developers contributing to leading oracle network Chainlink rallied to an all-time high a few days ago, as the network’s native token LINK presented a good accumulation opportunity.
🔗 The amount of developing contributors for #Chainlink is at an #AllTimeHigh, and average trading returns have entered into opportunity zones. The latest @santimentfeed community insight covers all of the latest #Chainlink indicators you should watch. https://t.co/GKFOcNFYpU pic.twitter.com/zXGdmWnU1p
— Santiment (@santimentfeed) May 16, 2023
Is your portfolio green? Check out the LINK Profit Calculator
An assessment of LINK’s price movement on a daily chart and a consideration of its Bollinger Bands indicator showed the alt’s price trading close to the lower band of the indicator at the time of writing.
When an asset’s price approaches or touches the lower band of the Bollinger Bands indicator, it suggests that the asset may be oversold or undervalued in the short term.
This is often interpreted as a potential buying opportunity, as there is a higher likelihood of the price rebounding or finding support and reversing its downward trend.
Also, the position of LINK’s Chaikin Money Flow (CMF) at press time meant that a price rebound might be underway.
While LINK’s price declined in the past 10 days, its CMF trended in the opposite direction to be pegged at a positive 0.05 at press time.
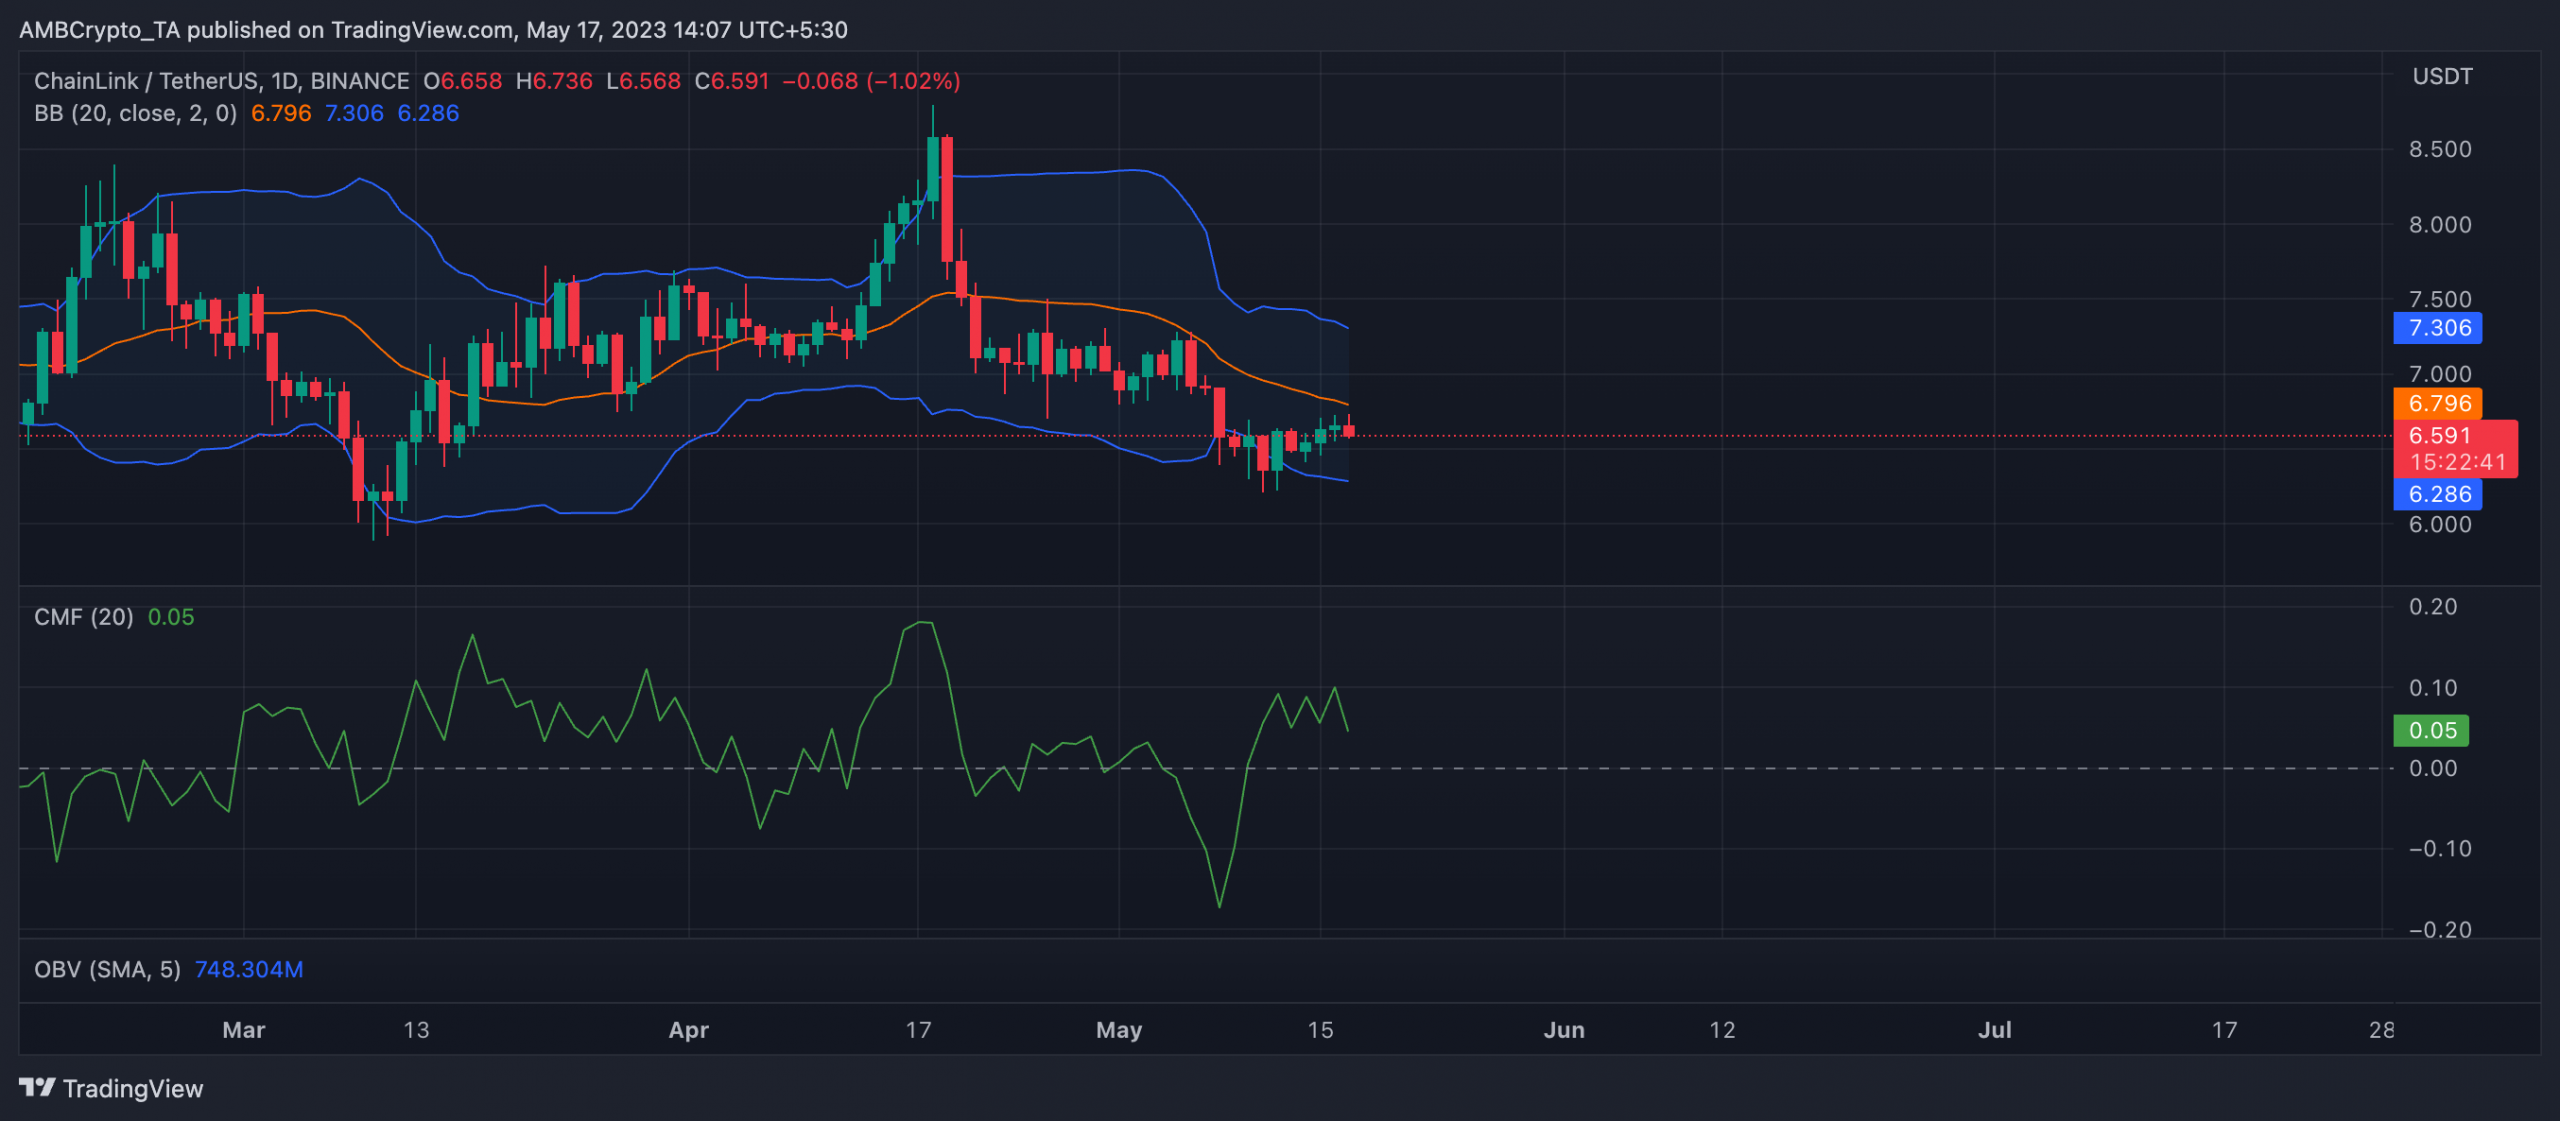
These opposite movements created a bullish divergence that often precedes a price correction. The divergence between price and CMF indicates a possible trend reversal or a temporary consolidation before an upward move.
LINK – To buy or not to buy?
While LINK’s price movements suggested a good buying opportunity, an on-chain assessment of the token revealed the possibility of a prolonged decline in value.
Per data from Coinglass, LINK’s Open Interest declined persistently since 19 April. At press time, this was $126.60 million.
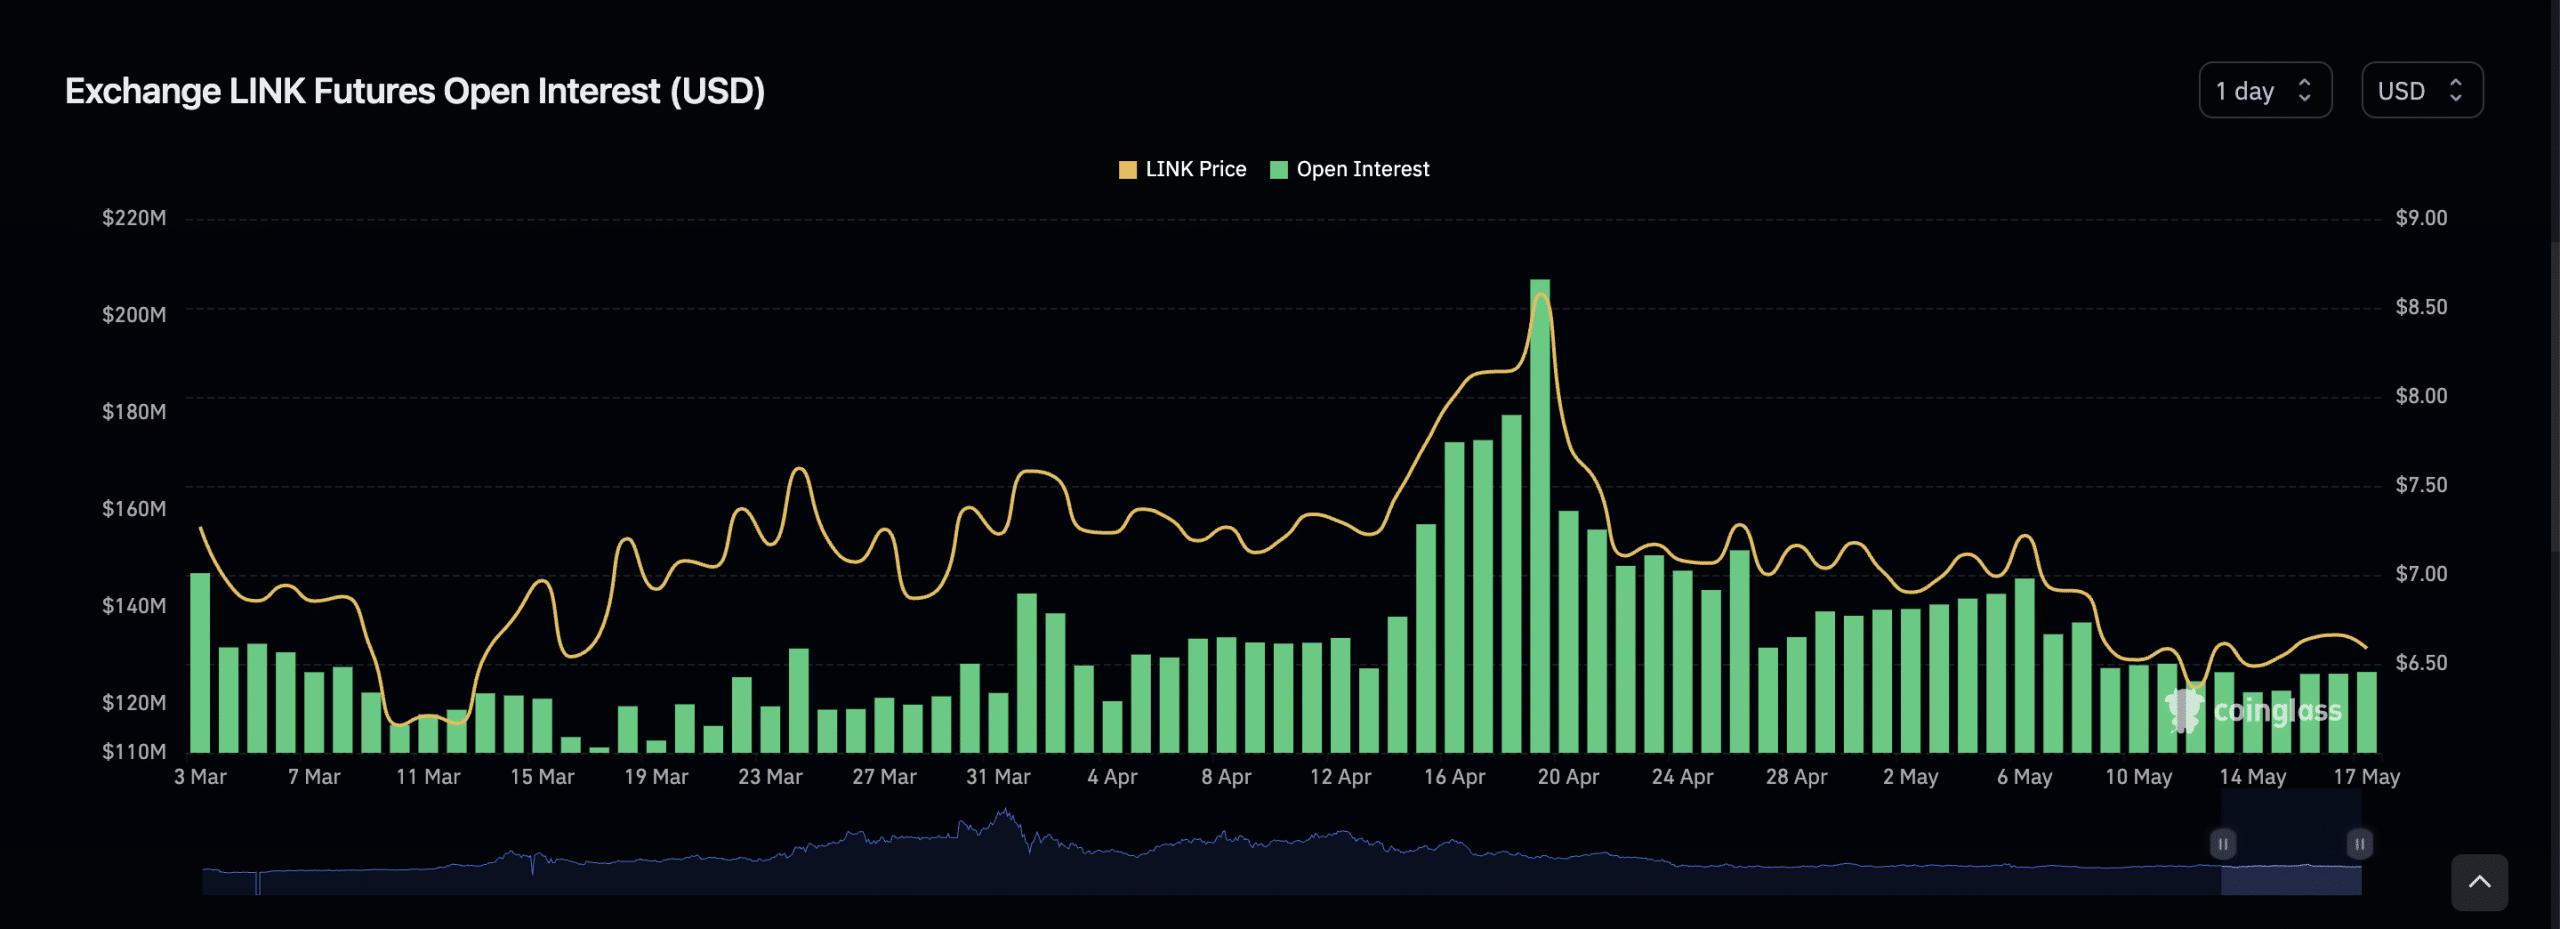
When an asset’s Open Interest declines, it often suggests a decline in market participation for that particular asset.
A continued fall in Open Interest shows a persistent decrease in investor enthusiasm. Investors fail to open new positions and reduce their existing positions. This has been known to send the price of an asset to new lows.
Read Chainlink’s [LINK] Price Prediction 2023-24
Also, LINK’s network activity has waned significantly since the end of March. According to data from Santiment, the count of daily active addresses and new addresses created daily to trade the token has since dropped.
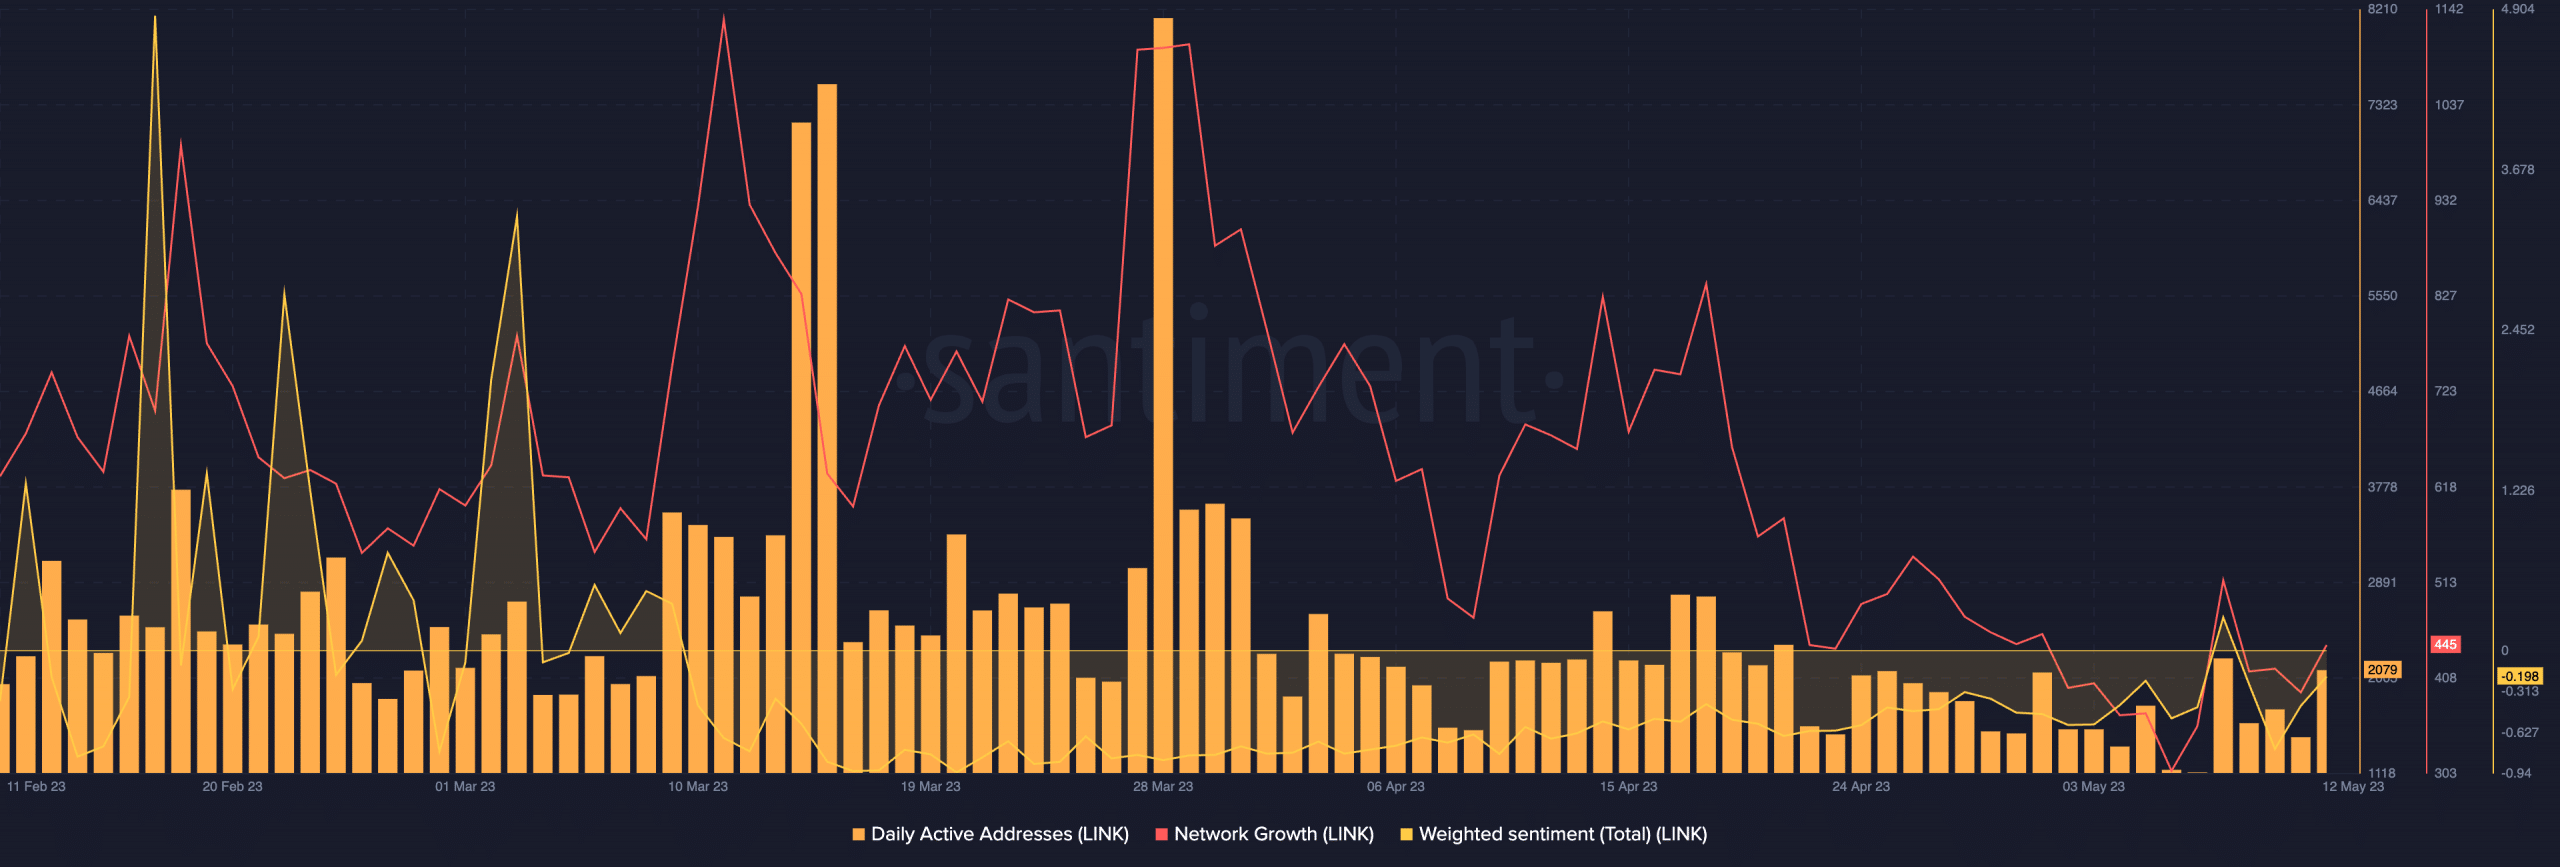
A further decline might be on the horizon for LINK, should the market conditions remain unchanged.


