Decoding Bitcoin’s $82K rejection: 3 BTC signals warn of deeper correction
Onchain signs of slowing demand added to the fear that the recent rally beyond $80k might face a severe correction.



Bitcoin [BTC] rallied past $82k briefly on Thursday, the 3rd of September. The uptick was a result of two developments.
The first was Federal Reserve Governor Christopher Waller’s comments indicating his support for keeping interest rates steady. Meanwhile, spot Bitcoin ETFs attracted $730.8 million in net inflows on Thursday.
Despite reduced expectations of a September rate hike, the 15th of September could see high volatility. Both the FOMC meeting and the U.S. Senate vote regarding the CLARITY Act are scheduled for mid-September.
Heading into a historically bearish month, onchain metrics showed signs that the Bitcoin rally might be cooling.
Worrisome news for Bitcoin bulls
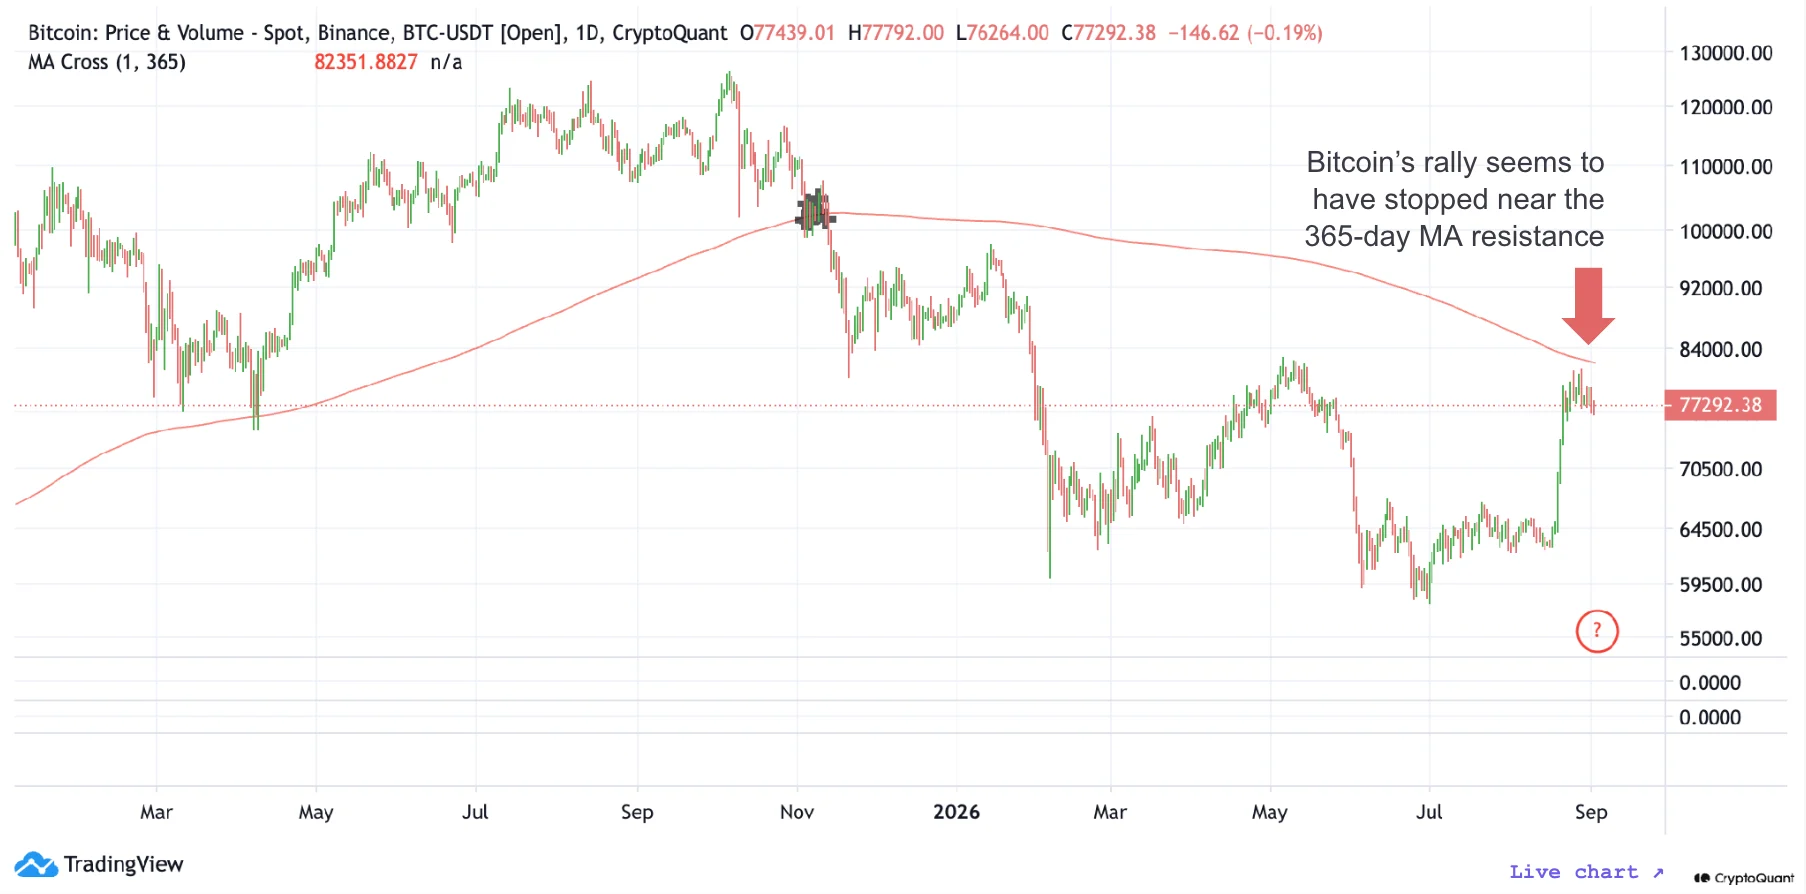
Bitcoin encountered selling pressure around its 365-Day Moving Average [MA], positioned at $82,268. Thursday’s rally stalled near that exact level before BTC recorded a minor pullback.
A CryptoQuant report noted that, historically, bull runs have begun once the 365DMA is breached.
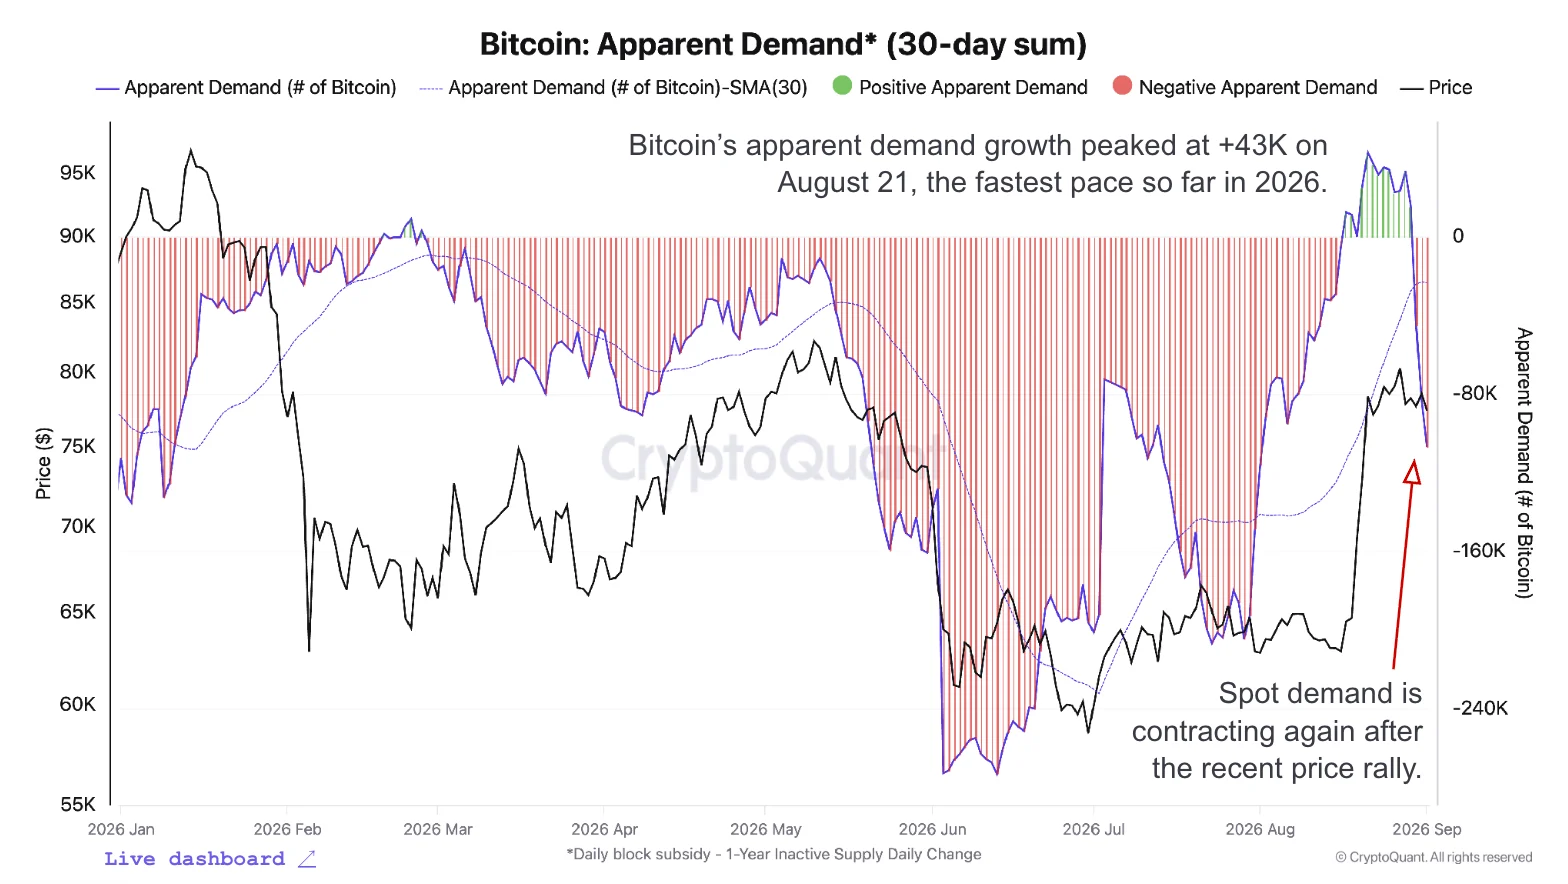
The Apparent Demand metric tracks the difference between newly-mined BTC issuance and the change in the supply inactive for over a year. A reduction in the metric showed less demand, reflecting stalling accumulation near key swing resistance levels.
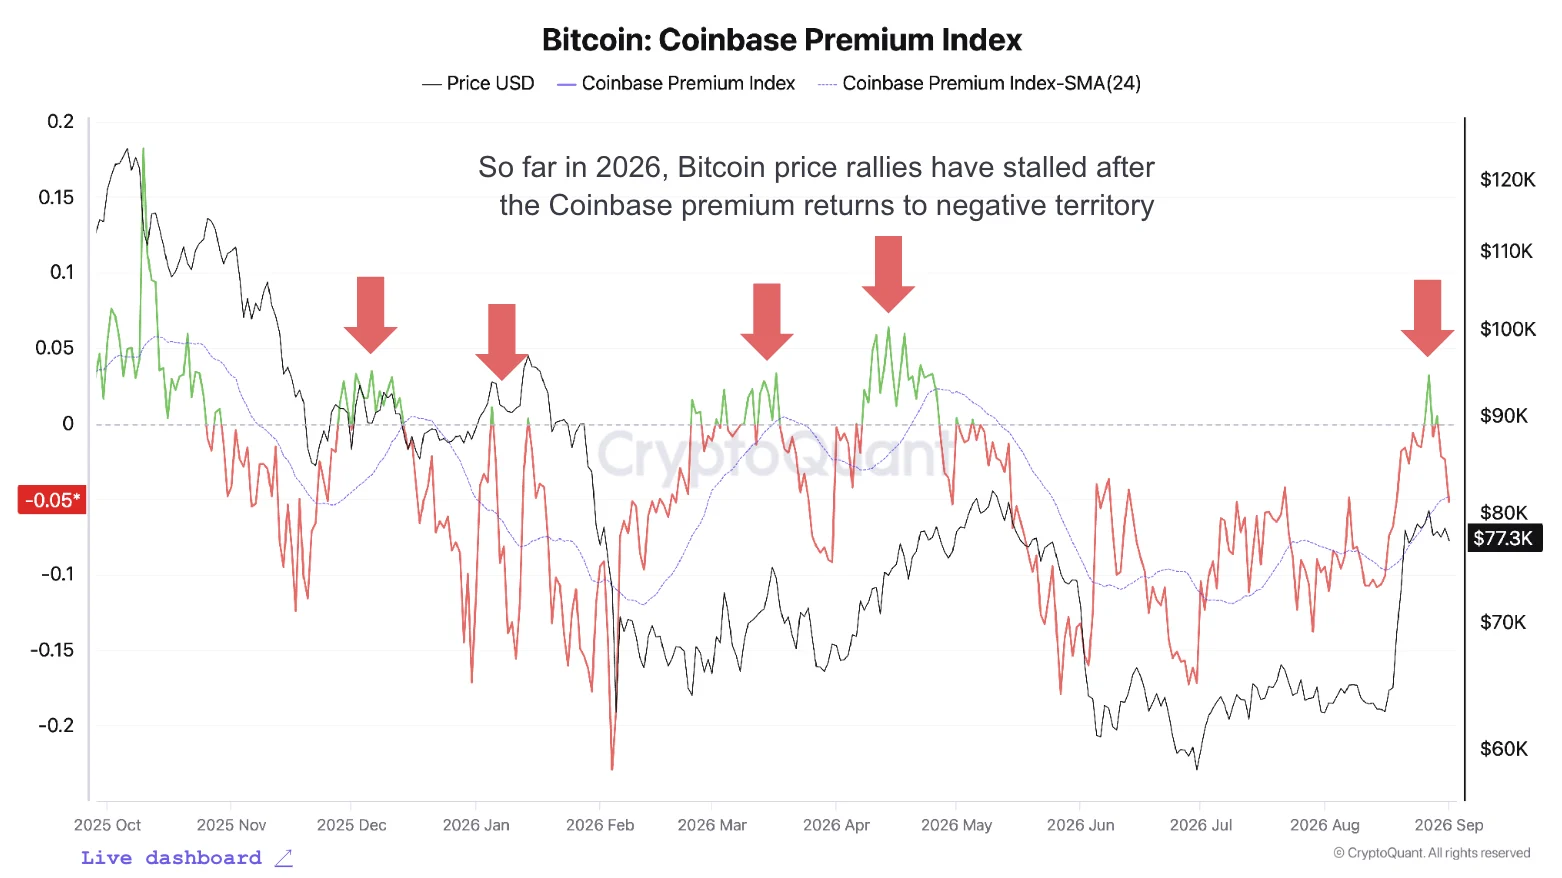
A positive Coinbase Premium Index shows increased demand from U.S.-based investors. The metric briefly climbed into positive territory in late August but has slumped once again.
Together, the metrics reflected soft demand conditions that might cap the current rally beneath key overhead supply zones.
Could Bitcoin fall toward $66.9k?
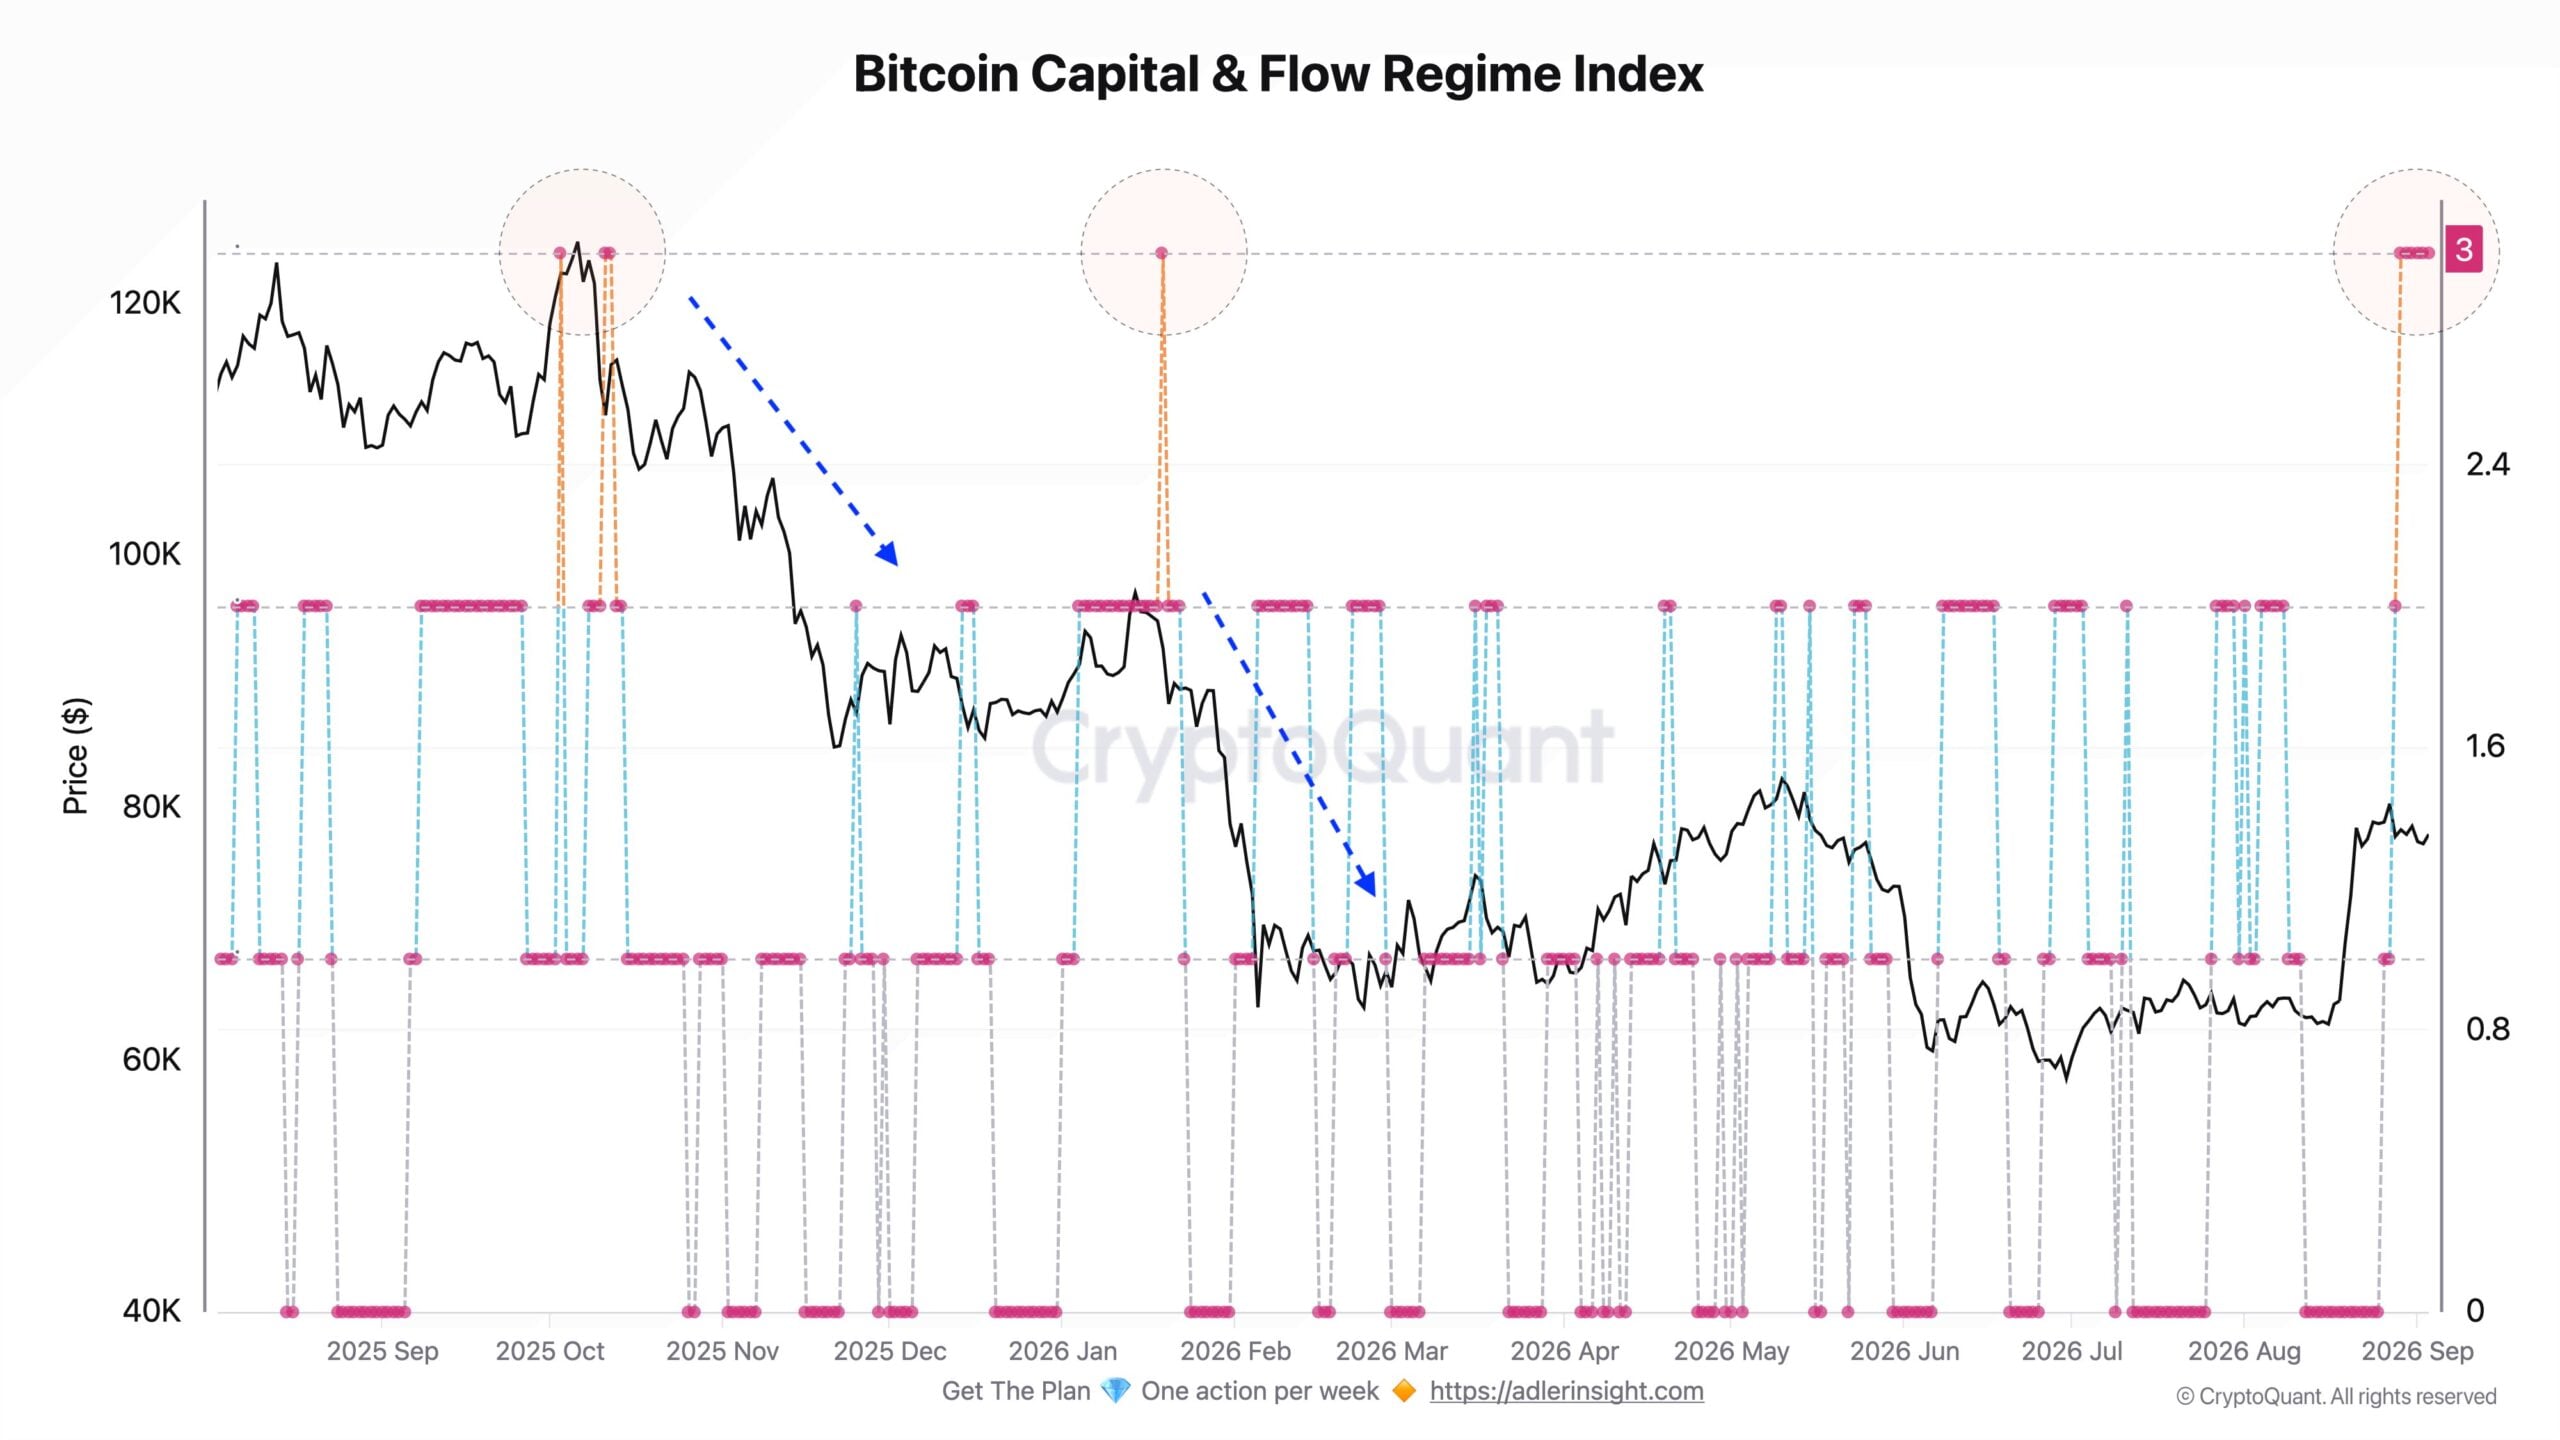
The Bitcoin Capital and Flow Regime Index has been at its maximum level for six consecutive days, pointed out crypto analyst Axel Adler Jr. In this bear market regime, this signal has been followed by a price decline.
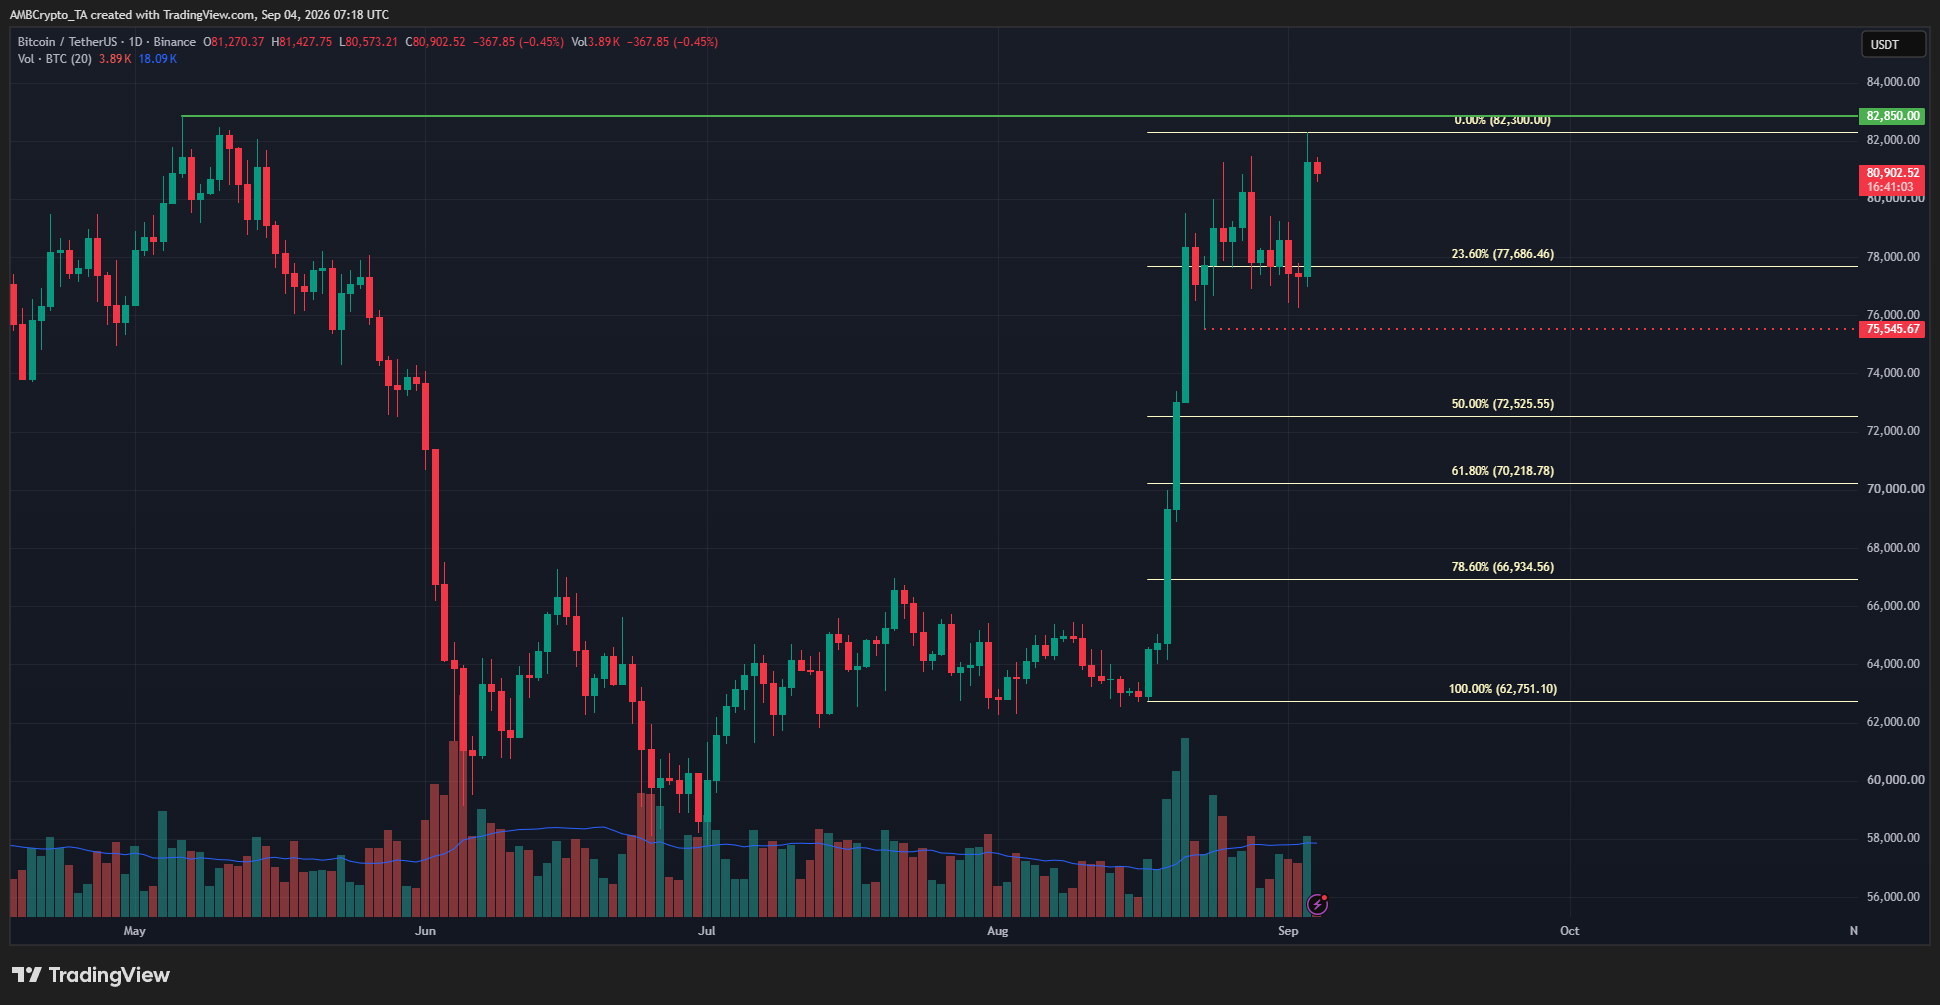
Meanwhile, May’s $82,850 swing high remained another obstacle for bulls.
August’s gains improved Bitcoin’s price structure, but weakening demand around $82k could trigger a deeper retracement. A break below $75.5k could expose $70.2k, followed by $66.9k.
Bitcoin therefore faces an unusual disconnect: ETF capital is returning, while broader demand indicators continue to retreat.
Final Summary
- Bitcoin was unable to flip the 365-day moving average to support. In the past, breaking this resistance has been a bull market signal.
- Onchain signs of slowing demand added to the fear that the recent rally beyond $80k might face a severe correction.