Decoding Ethereum Classic’s unprecedented gains and what lies ahead

Disclaimer: The findings of the following analysis are the sole opinions of the writer and should not be considered investment advice.
Bitcoin [BTC] had a tumultuous start to the trading week. On 5 September, the king of crypto reached a high of $20,180 and a low of $19,630. A few hours prior to writing, BTC had surged from $19.8k to $20.1k.
In the next hour of trading, BTC undid all those gains to slump back to $19.7k. Ethereum Classic [ETC] was unperturbed by this chaos. The altcoin broke emphatically past the $34.3 resistance mark and has posted a further 17% hike with high buying volume.
ETC- 1-Hour Chart
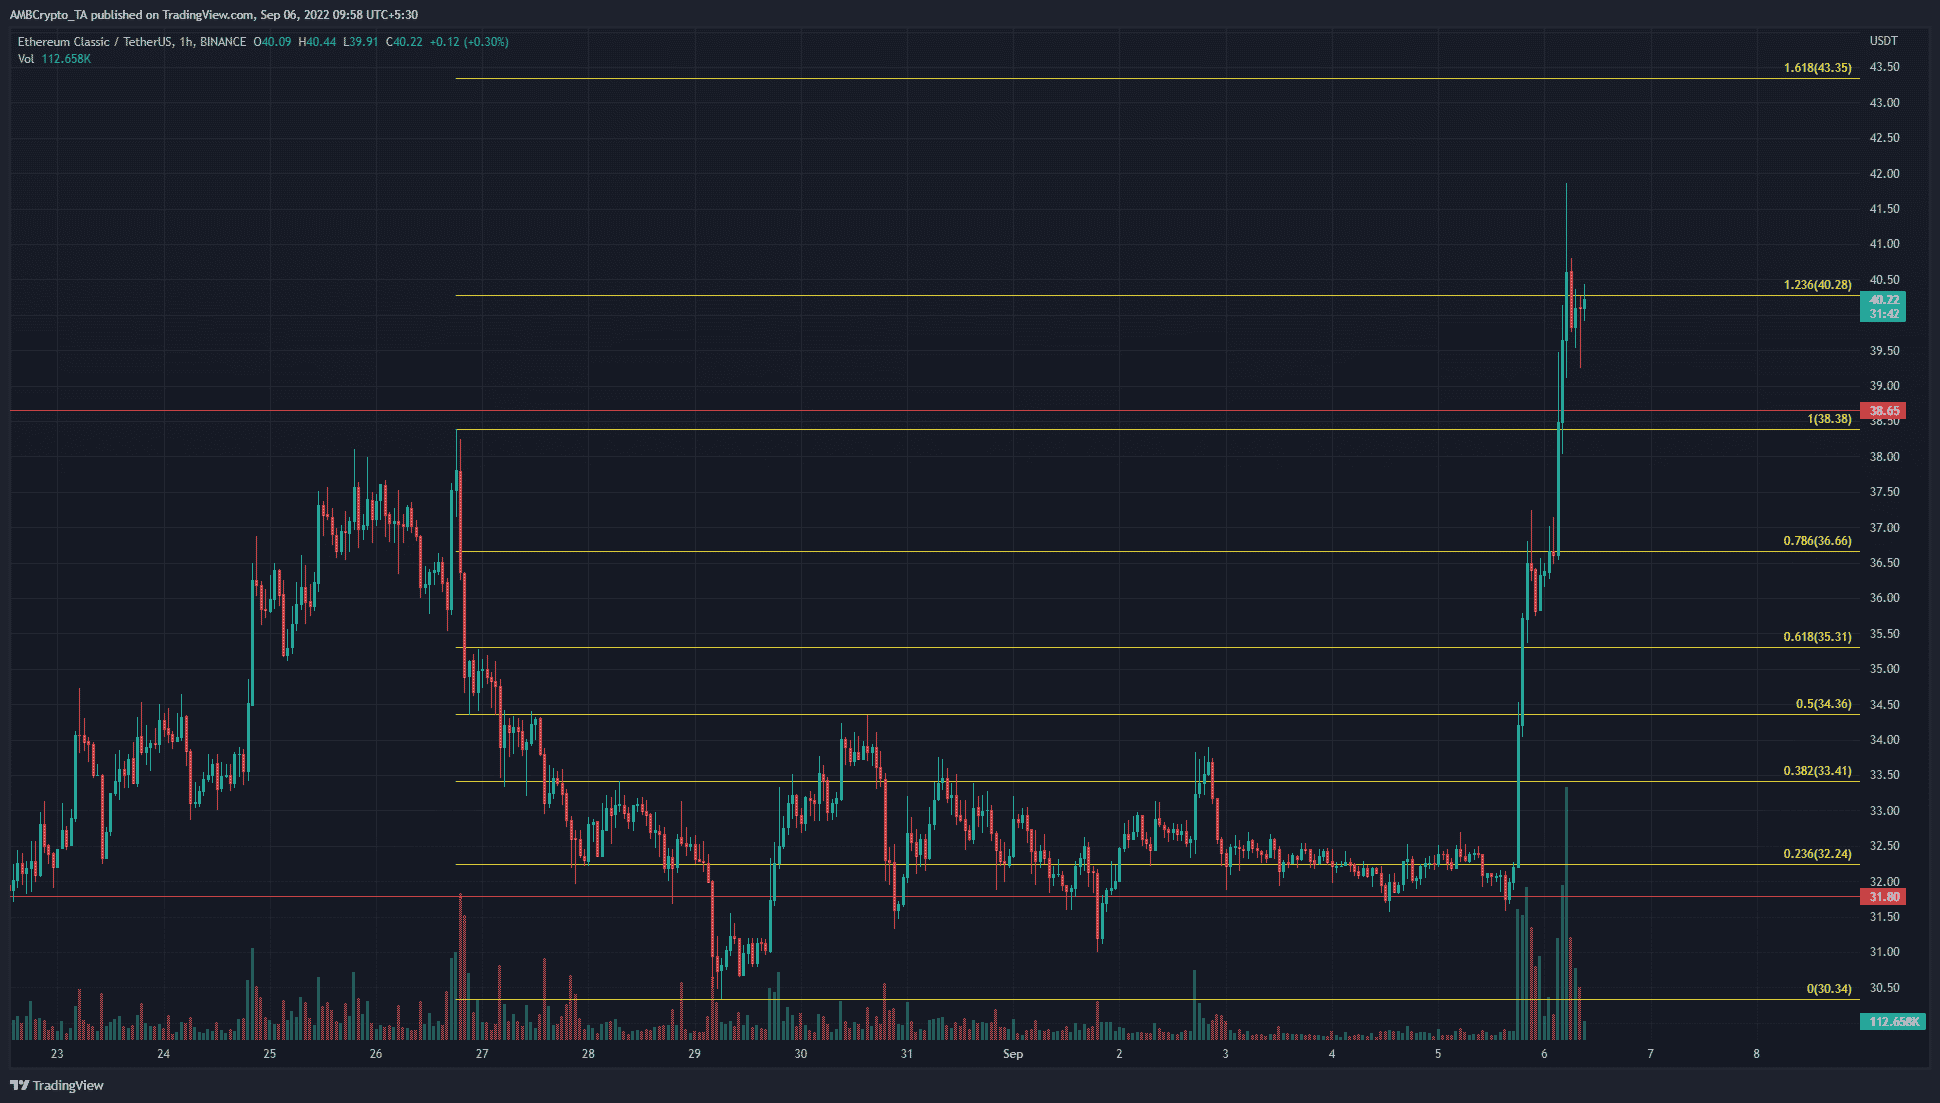
A set of Fibonacci retracement levels (yellow) were plotted based on ETC’s move down from $38.38 to $30.34 in late August. The 50% and 38.2% retracement levels have served as important resistance levels in the past week.
In the past few hours of trading, ETC smashed its way above these resistances. 23.6% and 61.8% Fibonacci extension levels lie at $40.28 and $43.35. These areas can be used to take a profit.
A buying opportunity might arise on a session close above $40.28. A stop-loss below $40 and a target of $43 could be an aggressive trade to enter. Considering the strong upward momentum ETC has, such a bet could be profitable.
The $37-$38 area represents a fair value gap that ETC left behind as it rocketed skyward. A revisit to this zone could also offer a buying opportunity.
Rationale
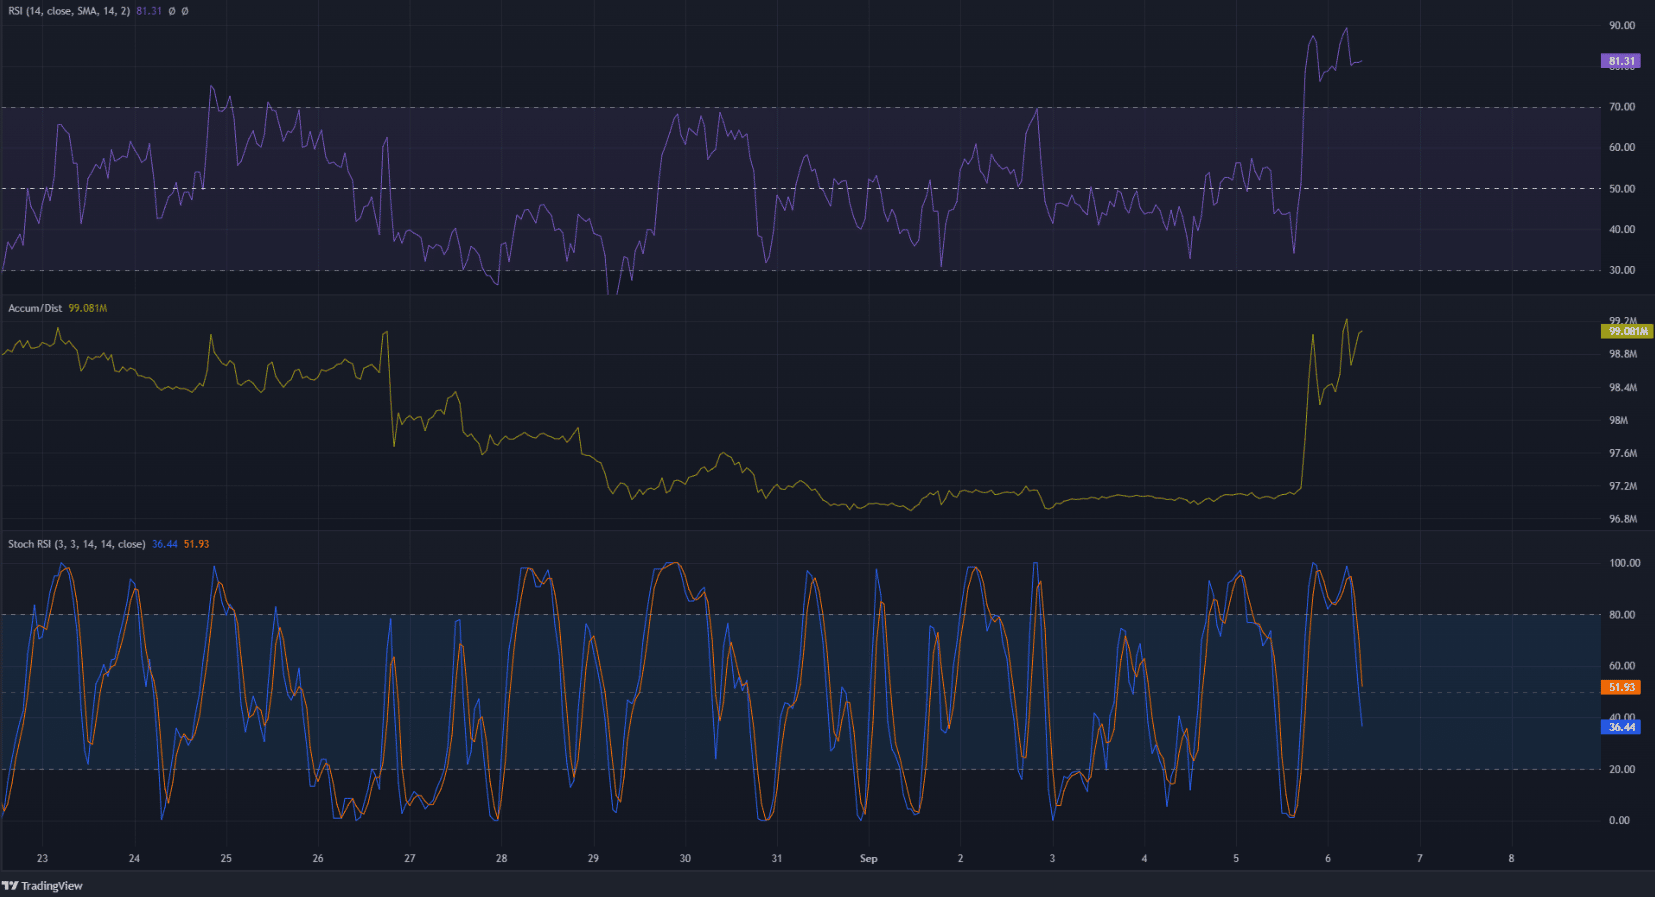
The hourly Relative Strength Index (RSI) was in the overbought territory and has been for many hours now. The Stochastic RSI plummeted, while the A/D line reached higher.
The A/D showed a high influx of buying volume in recent hours. This fact was also visible on the volume bars beneath the price action.
The presence of strong demand meant that pullbacks could be shallow. Moreover, the $41.24 and $44 levels have been significant resistance levels in the month of August.
Conclusion
The demand was strong in recent hours, but the $41 and $44 marks pose severe opposition to any move further north. Therefore, a dip to the $37-$38 area can be used to buy ETC.
In the event of such a pullback, the health of BTC would also be important. Bitcoin would need to be neutral or bullish to pave the way for further ETC gains.


