- SHIB’s next price point may be under $0.00002
- However, if bullish momentum climbs, the memecoin may exchange hands above $0.00003
An assessment of Shiba Inu’s [SHIB] price movements on the 3-day chart has revealed the formation of a descending triangle. A descending triangle is formed when an asset’s price is bound between the support and resistance lines, forming a triangular shape on the chart.
An asset’s price can either break below support and continue its decline or break out of the triangle and initiate an uptrend.
What next for SHIB?
AMBCrypto’s readings of SHIB’s Fibonacci retracement revealed that if the bears put further downward pressure on its price and it breaks below support, the memecoin’s price might decline further by 18% to trade at a low of $0.000018.
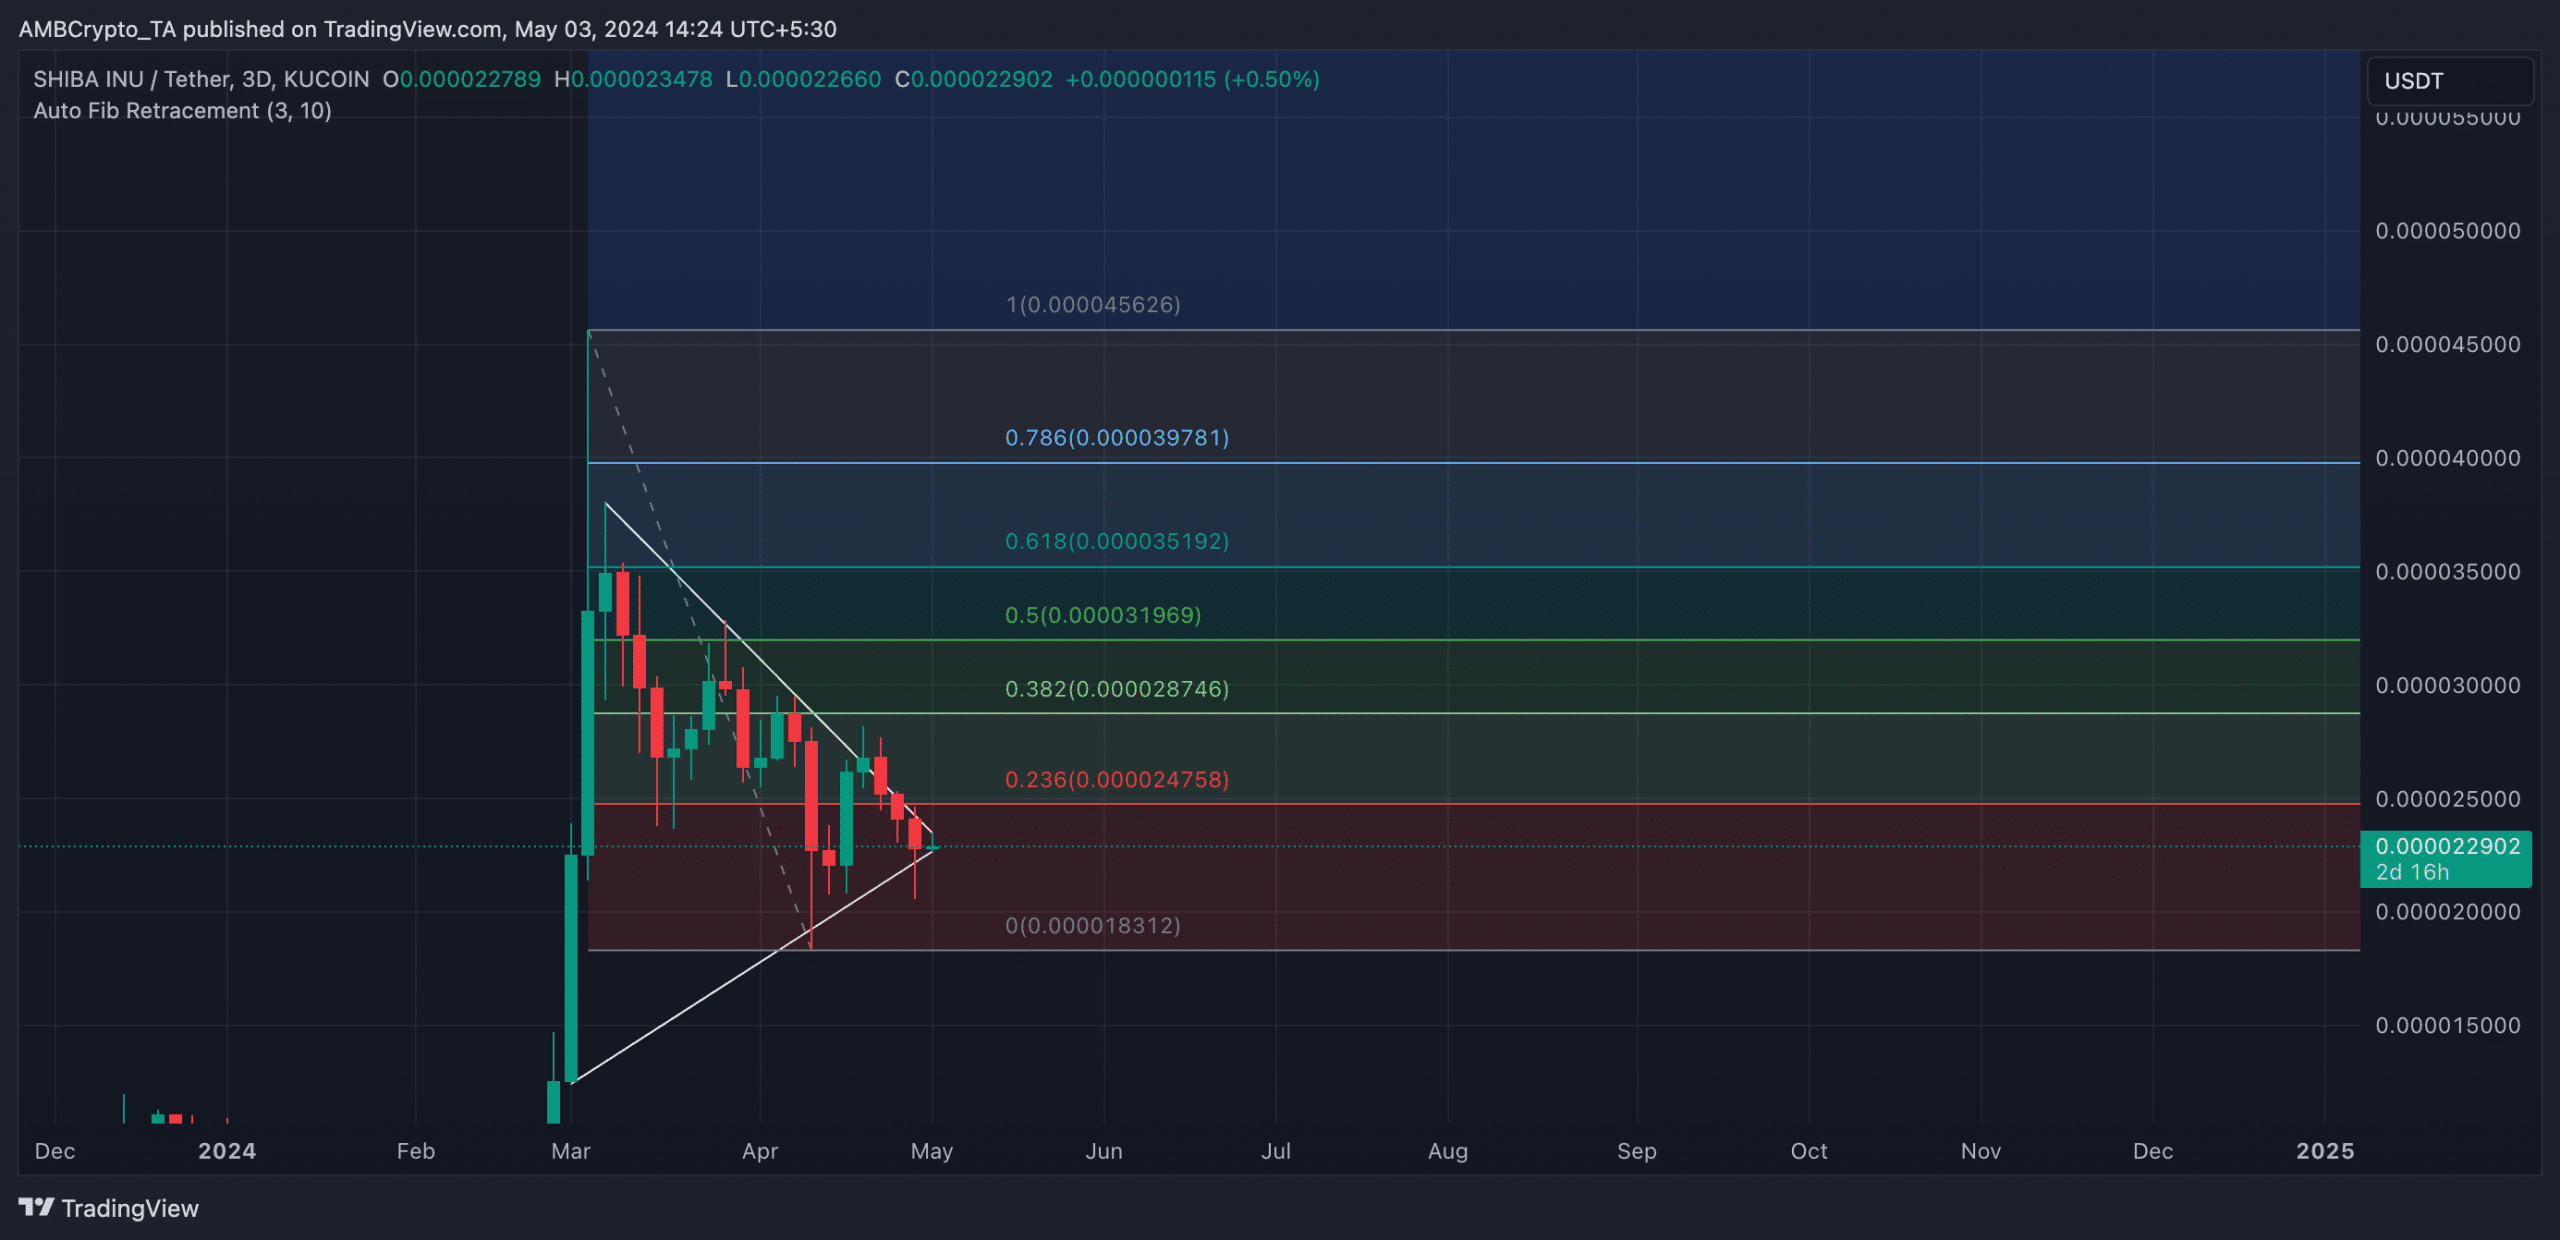
Source: Trading View
This decline appears possible as the coin continues to register a fall in demand. According to Santiment’s data, SHIB’s daily active addresses observed on a 30-day moving average revealed a 56% decline in the daily count of addresses involved in SHIB’s transactions over the past month.
Likewise, new demand for the memecoin has plunged. In fact, according to the on-chain data provider, the number of new addresses created to trade SHIB daily has dropped by 51% over the same period.
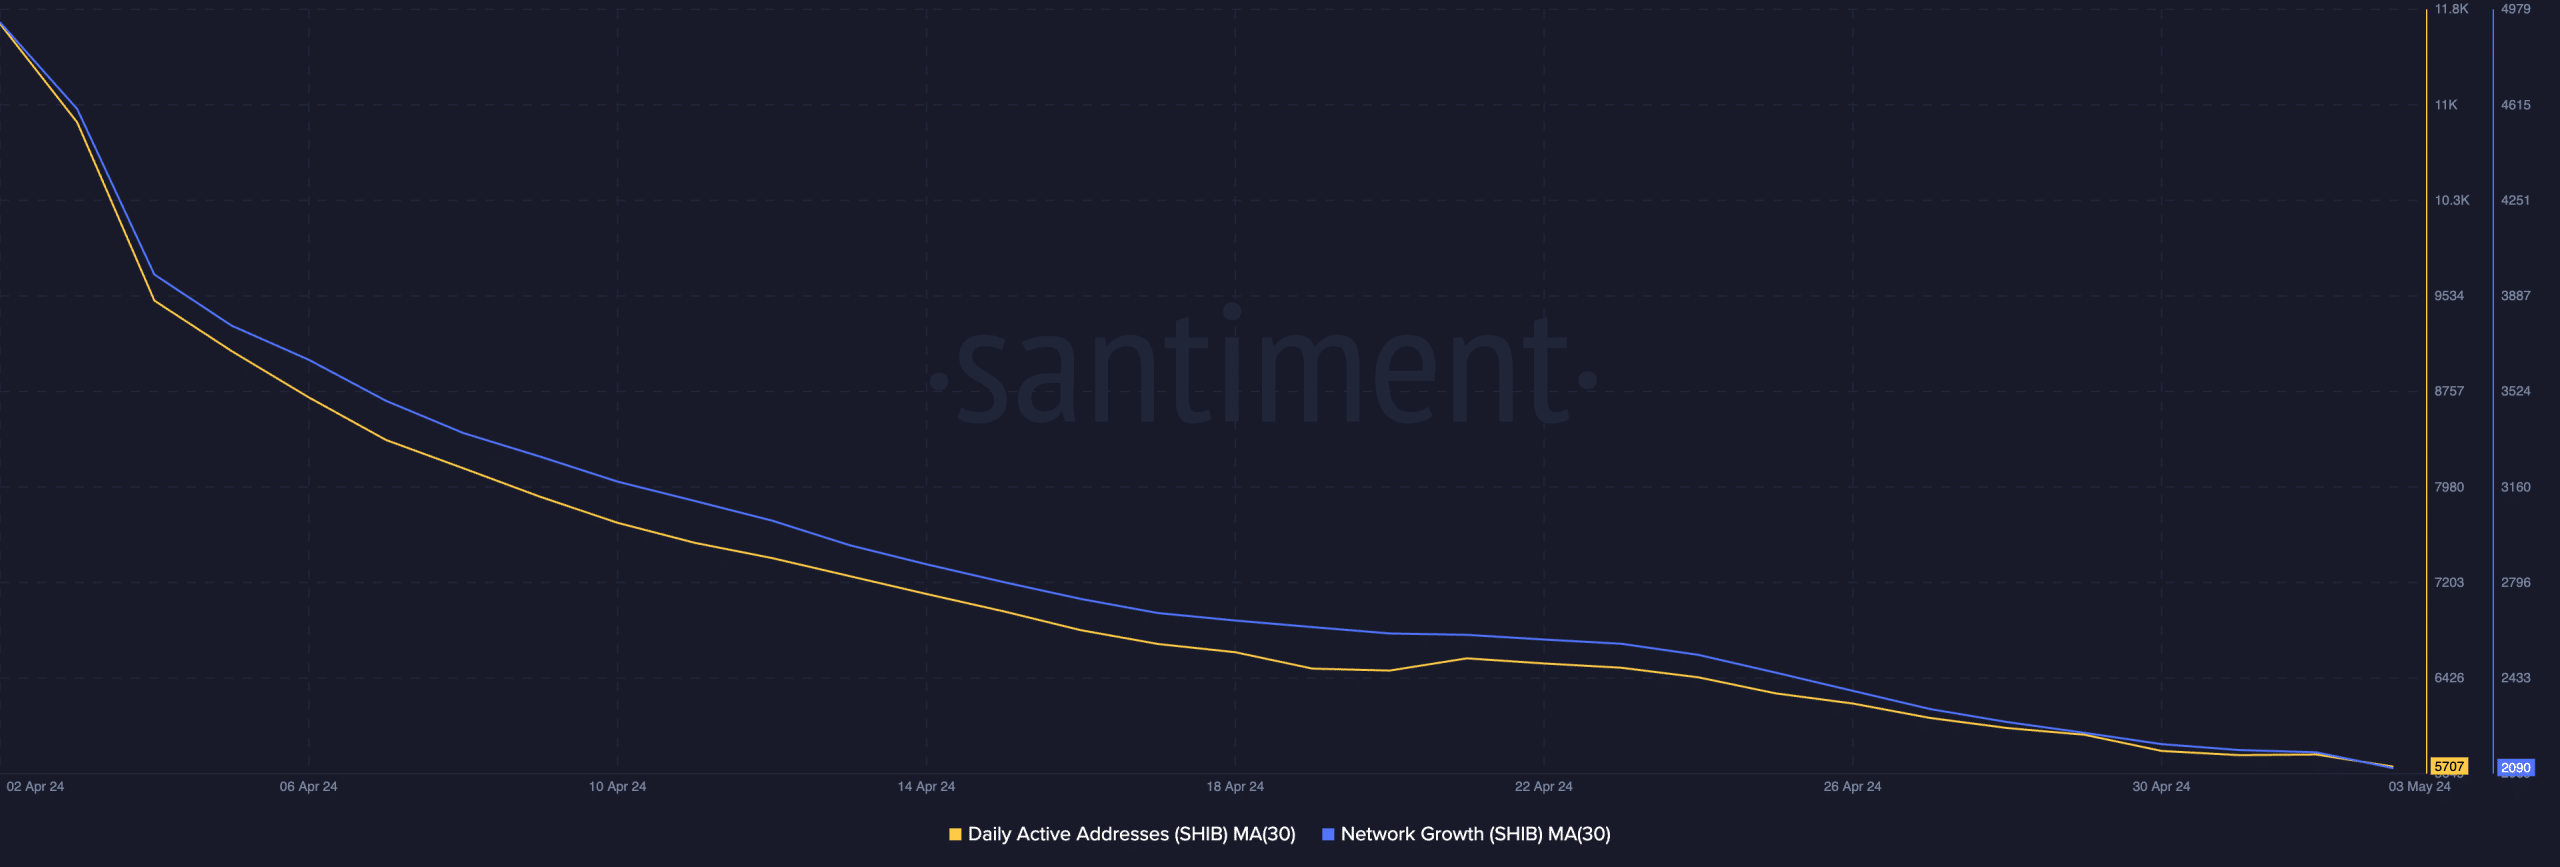
Source: Santiment
A decline in the number of active addresses trading an asset is often a precursor to low trading volume. When this decline is persistent, the downward pressure on the asset’s price mounts.
The predicted fall below $0.0002 is possible if SHIB continues to record a decline in its demand.
Read Shiba Inu (SHIB) Price Prediction 2024-25
Furthermore, SHIB’s high Market Value to Realized Value (MVRV) ratio puts it at risk of increased selling pressure. This metric measures the ratio between an asset’s current market price and the average price of every coin or token acquired for that asset.
At press time, SHIB’s MVRV ratio was 38.28% and heading north. When an asset’s MVRV ratio is positive in this manner, the asset is deemed to be overvalued. This means that a significant number of asset holders are “in the money,” triggering the need to sell and lock in profits.
Source: Santiment
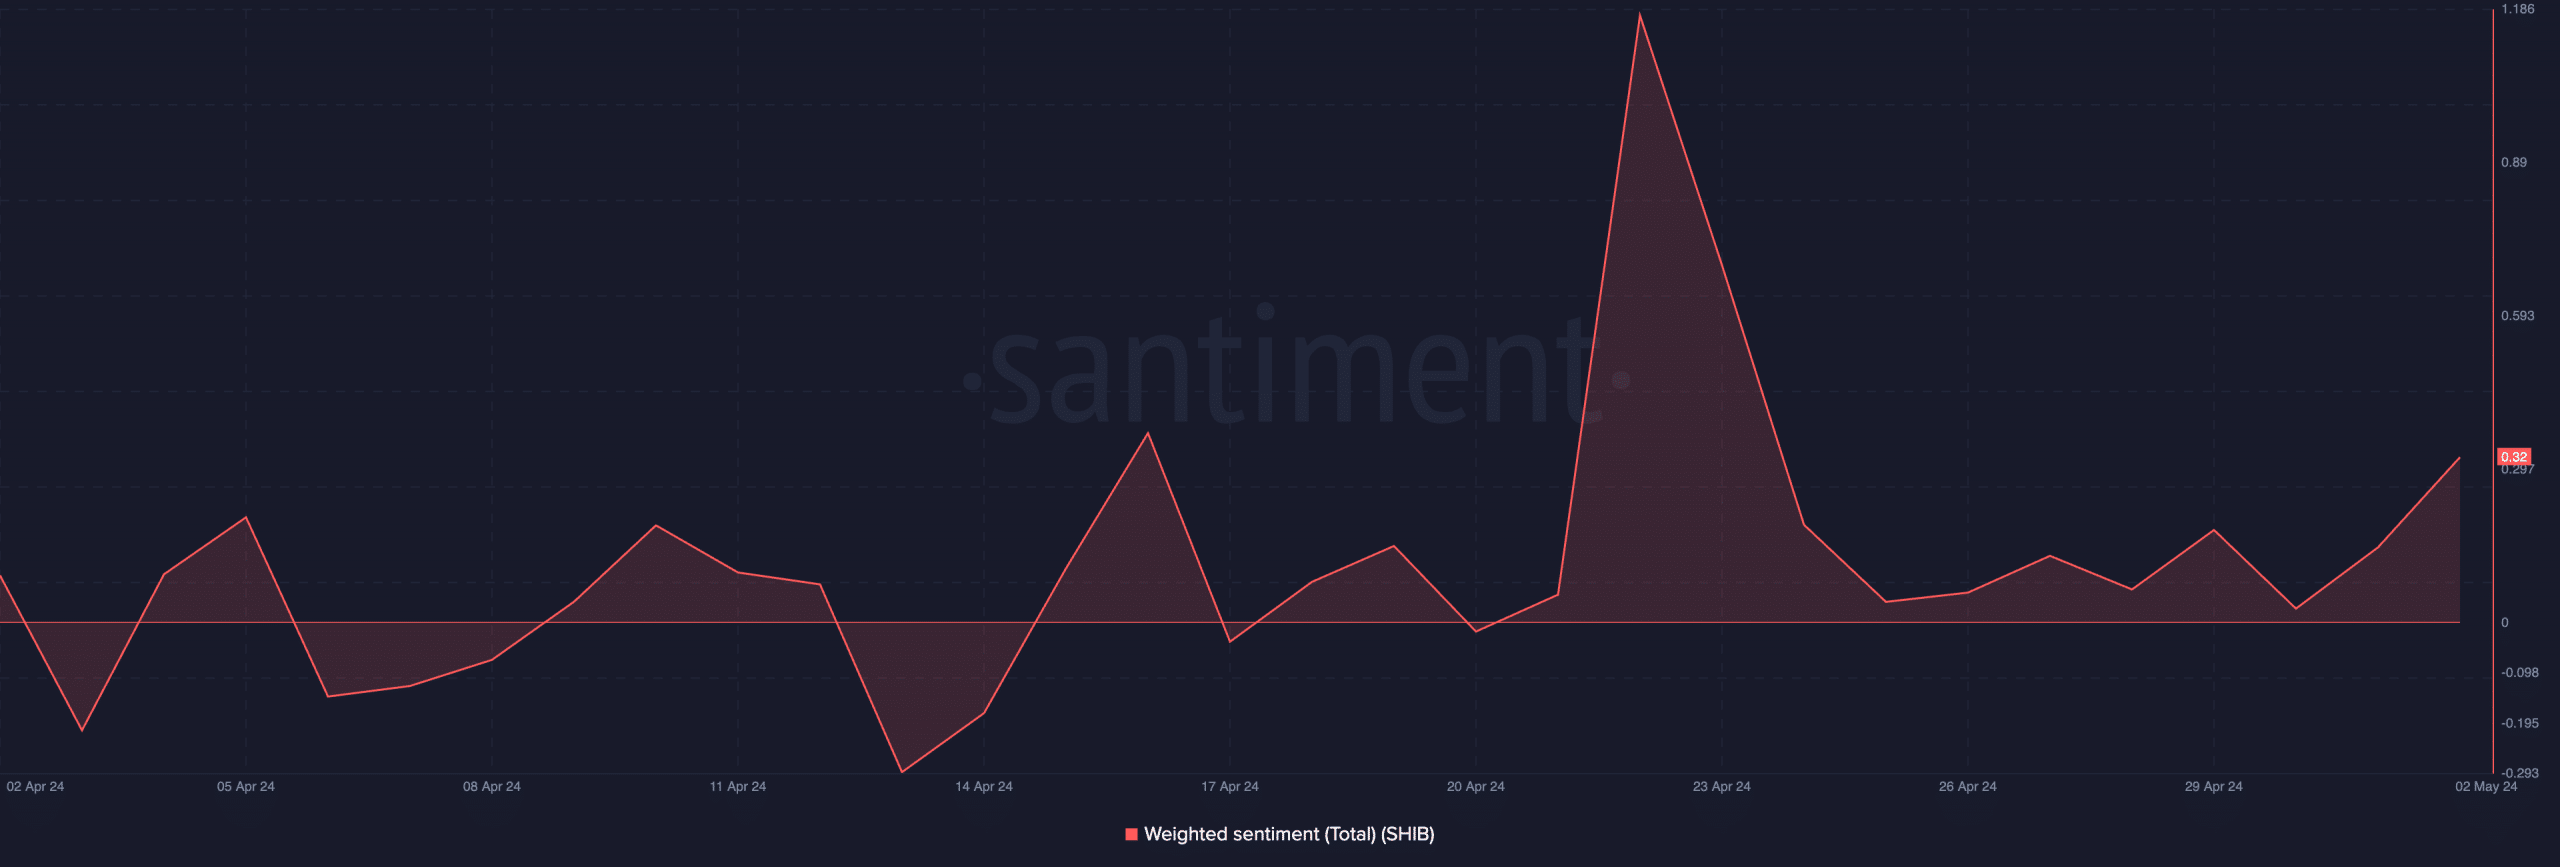
However, despite the decline in SHIB’s value, bullish sentiment among market participants has been re-emerging lately. The coin’s weighted sentiment, for instance, was positive at press time and has been so since 30 April.
If this bullish sentiment persists, SHIB’s price might break out of its current pattern in an uptrend to trade at $0.00003 on the charts.


