Decoding the ‘why’ behind GMX’s unusual fee surge

- GMX fees climbed to a record high on 14 June with $20.7 million cumulative fees.
- The funding rate remains positive as GMX continues to decline on a daily timeframe.
GMX, through its on-chain data, recently witnessed a remarkable upsurge in fees, reaching an unprecedented peak. Nevertheless, this fee surge can be attributed to a distinct event that impacted GMX token holders.
– Is your portfolio green? Check out the GMX Profit Calculator
The GMX fee spike
On 14 June, the GMX platform experienced a notable fee surge, as per recent data. The cumulative fees reached an impressive sum of over $20.7 million, marking the highest recorded figure in the past few weeks.
Additionally, delving deeper through Crypto Fees, it became evident that its fee spike propelled it to the second-highest fee-generating platform on that specific day. Specifically, it accrued over $3 million in fees on 14 June alone while maintaining an average of over $703,000 in the last seven days.
Source of the GMX fee spike?
As outlined in a recent report by WuBlockchain, the surge in fees could be attributed to a significant liquidation event on the GMX platform. On 14 June, a substantial volume of liquidation transactions occurred within the on-chain derivatives agreement of GMX. This resulted in a remarkable net loss of $8.67 million for its traders.
Additionally, the fees accumulated were predominantly driven by these liquidation activities, totaling $3.13 million. Furthermore, an in-depth analysis of the fee breakdown further revealed the prominent role played by the liquidation event in contributing to the platform’s highest fee record observed recently.
Current traders’ sentiment
According to data from CoinGlass, despite the recent liquidation event, traders’ trading activities on the platform remained relatively high. Additionally, the weighted funding rate chart revealed that GMX continued to experience considerable trading volume. Also, as of this writing, the dominant position in the market was a long position. This indicated a positive expectation for the token’s price to increase.
Furthermore, the Open Interest (OI) as of 15 June stood at approximately $9 million, slightly declining. On the day of the liquidation event, that is 14 June, the OI was close to $10 million.
– How much are 1,10,100 GMXs worth today
GMX continues its decline
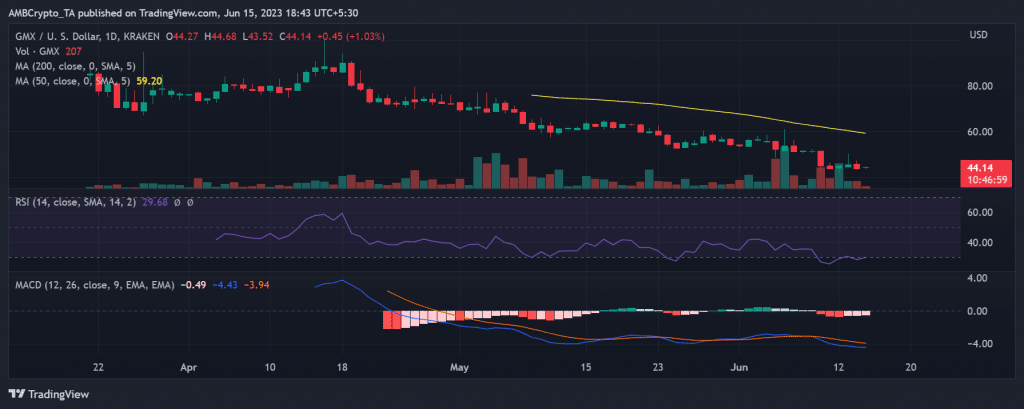
On 14 June, the daily timeframe chart of GMX indicated a decline of nearly 4% in its value. As of this writing, it had sustained its downward trajectory and was trading at approximately $44, reflecting a loss of over 1%.
The token had entered a robust bearish trend, as evidenced by its Relative Strength Index (RSI). As of this writing, the RSI indicated that it was in the oversold zone, emphasizing the bearish sentiment surrounding the token.


