Decoding what Bitcoin ETF data signifies for the flagship token’s future

There is a cloud of uncertainty currently looming over Bitcoin especially ahead of Wednesday’s critical announcements. The charts may not provide any clarity over what to expect but a look at on-chain activity may offer some insights as to how Bitcoin might behave in the next few days.
Metrics that can give insights into what deep-pocketed investment firms are doing in the crypto space might prove reliable during uncertain times. Such firms have access to the best analysts and are networked well enough to secure information before the rest of the market. Bitcoin’s options volume and Purpose ETF Holding metrics fit the above criteria.
The option volume metric registered a strong dip on 29 April and BItcoin sold heavily the next day. It currently reveals that Bitcoin options volumes grew from $199 million on 30 April to almost $560 million by 3 May. The Purpose ETF Holdings has been increasing from its lowest monthly point at 29,917 BTC on 18 April, to 31,453 BTC on 3 May.
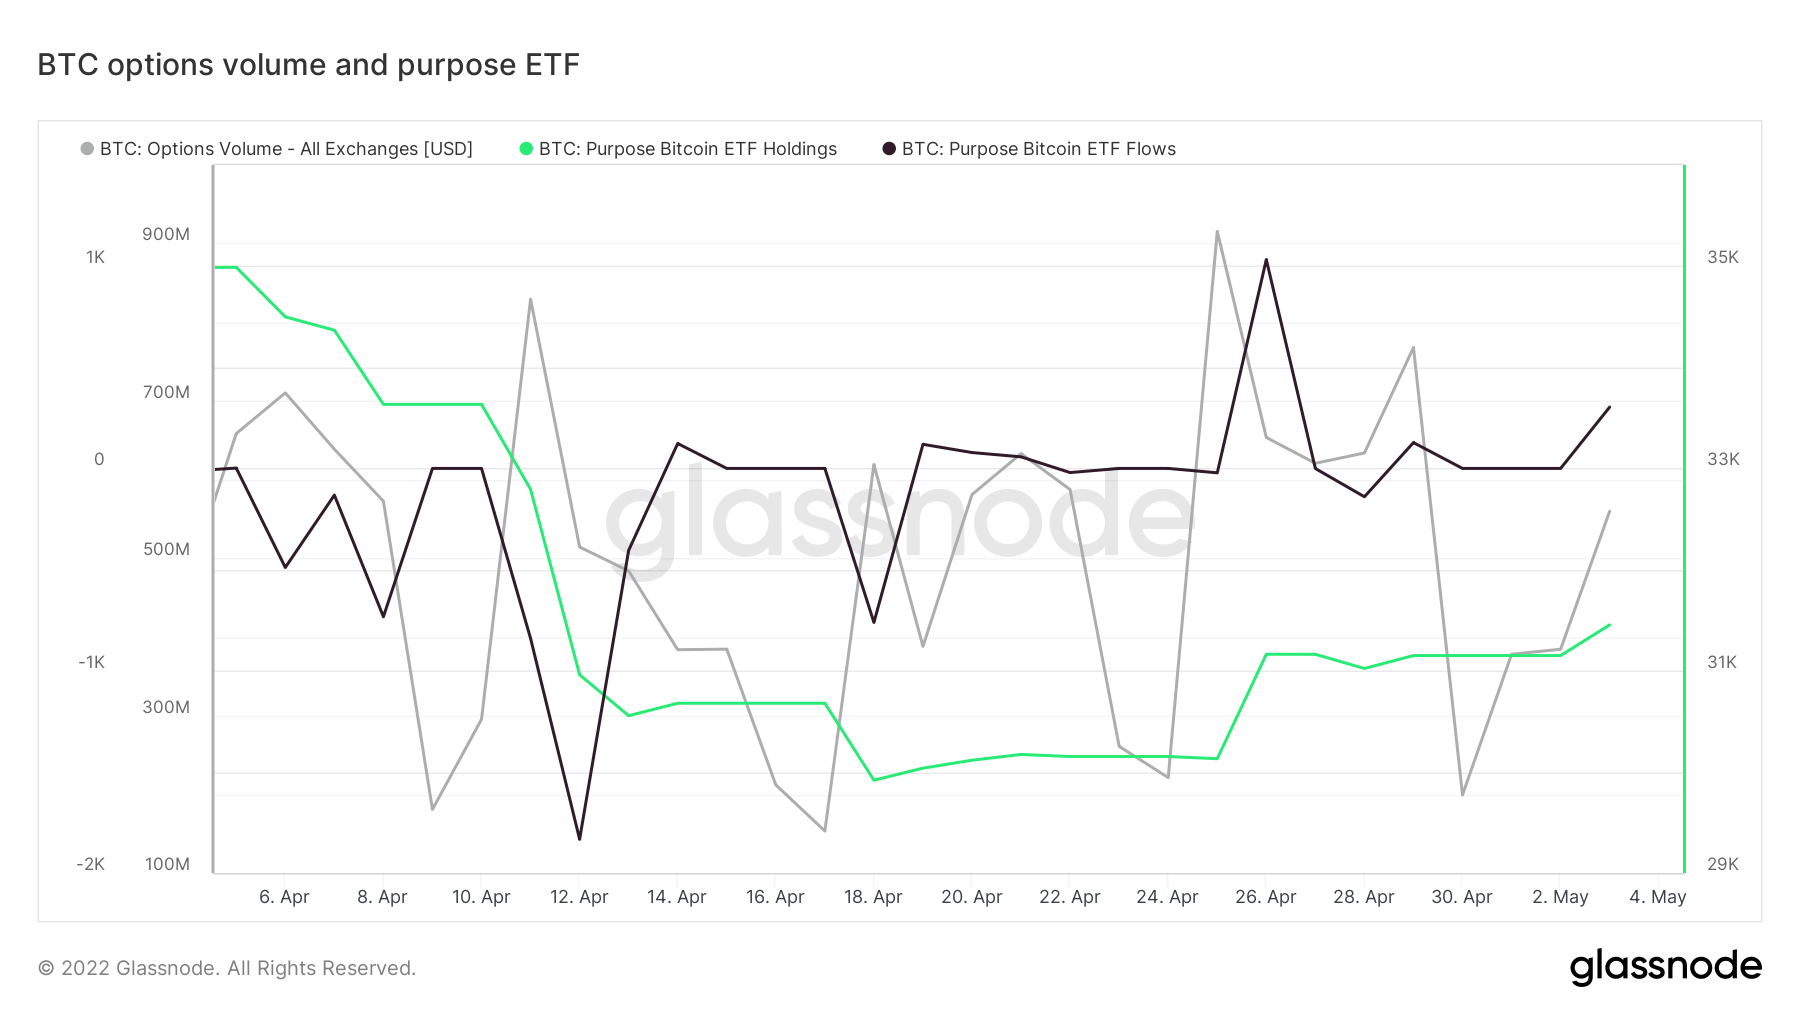
The Purpose ETF Flows bottomed out at -1833 on 12 April and peaked at 1032 on 26 April, after which it dipped to neutral. However, its flows currently register a 303 gain in the first 3 days of May.
Does the Purpose ETF and BTC options growth signal positive BTC expectations?
The increase in the BTC options volume, as well as Purpose ETF’s additional BTC purchases, are a sign of interest in the market at lower price levels. However, they may also be the result of dollar-cost-averaging at the discounted levels and not necessarily a sign that BTC will not achieve further downside.
The metrics align with observations in Bitcoin’s price action. For example, BTC has been trading along its support line in the last three days, a sign that it is contending with friction within the support range. It has however attempted to rally in the last few hours, a sign of accumulation at the support line.
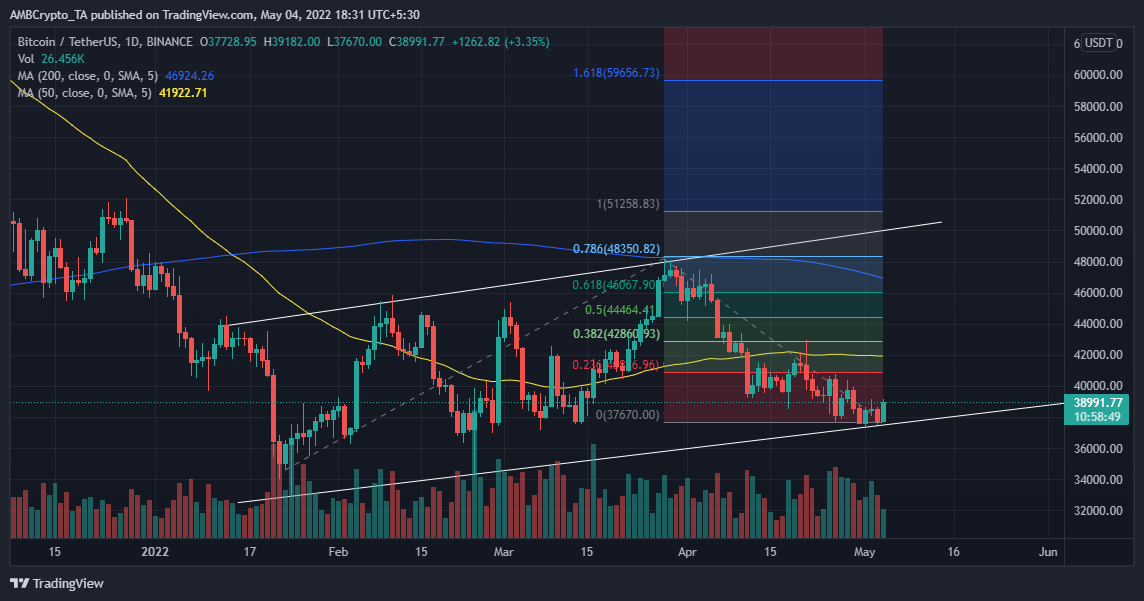
In case of a rally, Bitcoin might encounter strong resistance near the $43,000 price level which aligns with the 0.382 Fibonacci level. Some of the support levels to watch for in case of a bearish performance include $36,300, $34,100, and 33,000 which were BTC’s previous reversal points.


