Decoding why Bitcoin[ BTC] is below the $30k range yet again

The Bitcoin [BTC] saga seems never-ending as the flagship cryptocurrency fell below the $30k mark yet again. The king coin did witness signs of recovery after the Terra collapse but looks like the crypto gods aren’t as pleased with the coin. Now the question is- Why BTC is down again and is there any near-term recovery in sight for investors?
Let’s find out.
The on and offs of the king coin
Bitcoin prices are below $29k again after the Terra crash. There are suggestions calling out macro headwinds that are responsible for pulling down BTC prices to support levels.
Notably, the S&P 500 and NASDAQ finished their seventh successive week in losses. This is the longest losing streak since the end of the dotcom bubble in 2001. Additionally, the Dow is also in its eight successive weekly loss, the longest streak since the 1932 Great Depression.
A Santiment tweet also indicated a correlation between BTC and the S&P 500 index, and how BTC’s upside movement was ‘halted’ by ‘equities.’ The major indices have been witnessing a free fall with the warning signs of recession and looming inflation at large.
Even so, the king coin saw bulls stepping in at the $30k mark only to lose the fight to the bears. At press time, the Fear and Greed Index stood at 13 indicating ‘Extreme Fear.’
What do the charts say?
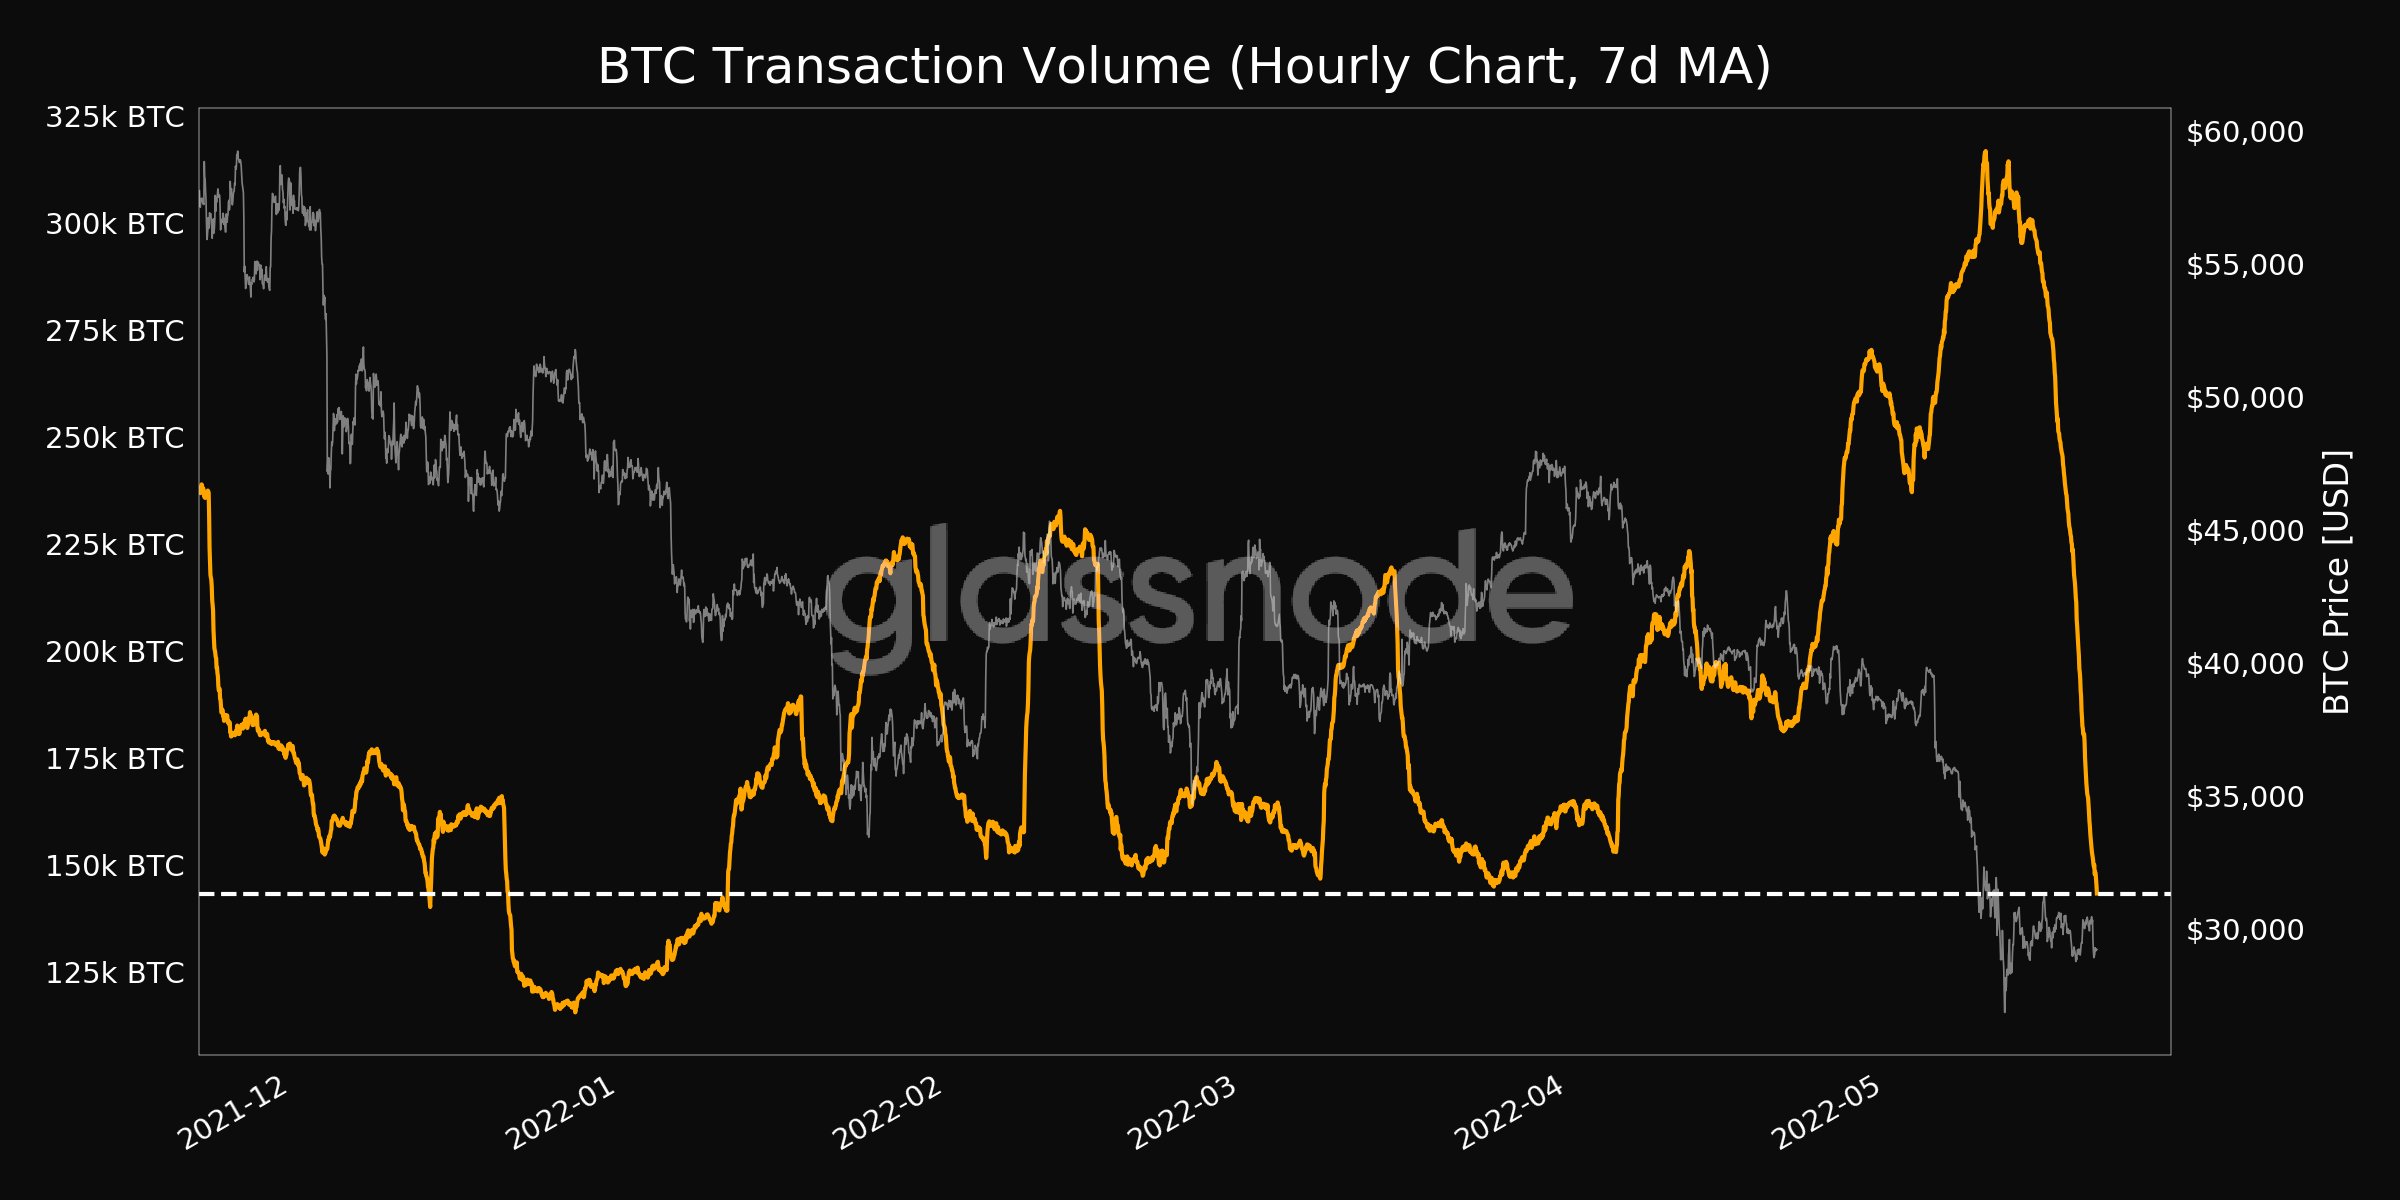
The metrics are also aligned with the aforementioned information, sending out worrying signals across the Bitcoin network. Investors’ fear can also be perceived through the low transaction volumes.
As per Glassnode reports, the transaction volume dipped to a four-month low on 21 May. This level of an extreme low was also witnessed back in March 2022 when the transaction volume stood at 145,015.1 BTC.
Another metric highlighting a bearish stance on the bitter state of Bitcoin is the NVT signal. The NVT signal on 21 May for Bitcoin stood at a staggering four-year low of 235.2, as per Glassnode.
This suggested that Bitcoin was approaching a local market bottom which historically presents a period of accumulation. However, currently, there is an underlying FUD sentiment in the market because of the discounted prices of assets.

Hang on….. There’s more
Interestingly, renowned crypto analyst Plan B recently tweeted suggesting a trend reversal in the BTC prices. Plan B’s price predictions are widely used for analysis in the crypto community given his 1.8 million Twitter following.
Realized Price / Moving Average (RPMA, purple) shows the #bitcoin cycle best. Relative Strength Index (RSI, yellow) is similar, but can be misleading at critical times (e.g. 2nd half 2021). The good news: bear market is almost over. Waiting for RPMA and RSI to start rising again. pic.twitter.com/Naz2zPV071
— PlanB (@100trillionUSD) May 20, 2022
Plan B used the “Realised Price/ Moving Average (RPMA)” and RSI metrics to conclude a nearing end for the bear market. There is growing confidence about BTC recovery with Plan B suggesting RPMA as being the “best” indicator for Bitcoin. Despite all the bearish signals, Plan B looked hopeful for a quick revival.
Well, no matter what the indicators or analysts say, only time can reveal Bitcoin’s future price trajectory.