


HOME, the native token of DeFi App—a protocol built to make DeFi interaction more user-friendly—has posted significant gains over the past day, climbing more than 10% in a move that suggests investors are placing active bids once again.
The asset looks bullish in the near term given the structure it’s trading within, yet the latest surge raises the question of whether HOME can revisit the high it last touched on the 7th of June.
HOME’s near-term structure points to a breakout
HOME is forming the kind of pattern that tends to precede a major rally, with a horizontal support line and a diagonal resistance line converging toward a single apex. This setup typically comes ahead of a breakout swing to the upside, and that may well play out here.
In the early hours of the 16th of June, HOME tested the level and met only a slight rejection, a sign that selling pressure remains minimal and that the asset could break through on its next attempt.
This resistance line has historically exerted a heavy selling force that drove the price lower, as it did in the last two instances when HOME traded up to it, both of which ended in major losses.
The difference this time is that the indicators point to a bullish environment taking shape.
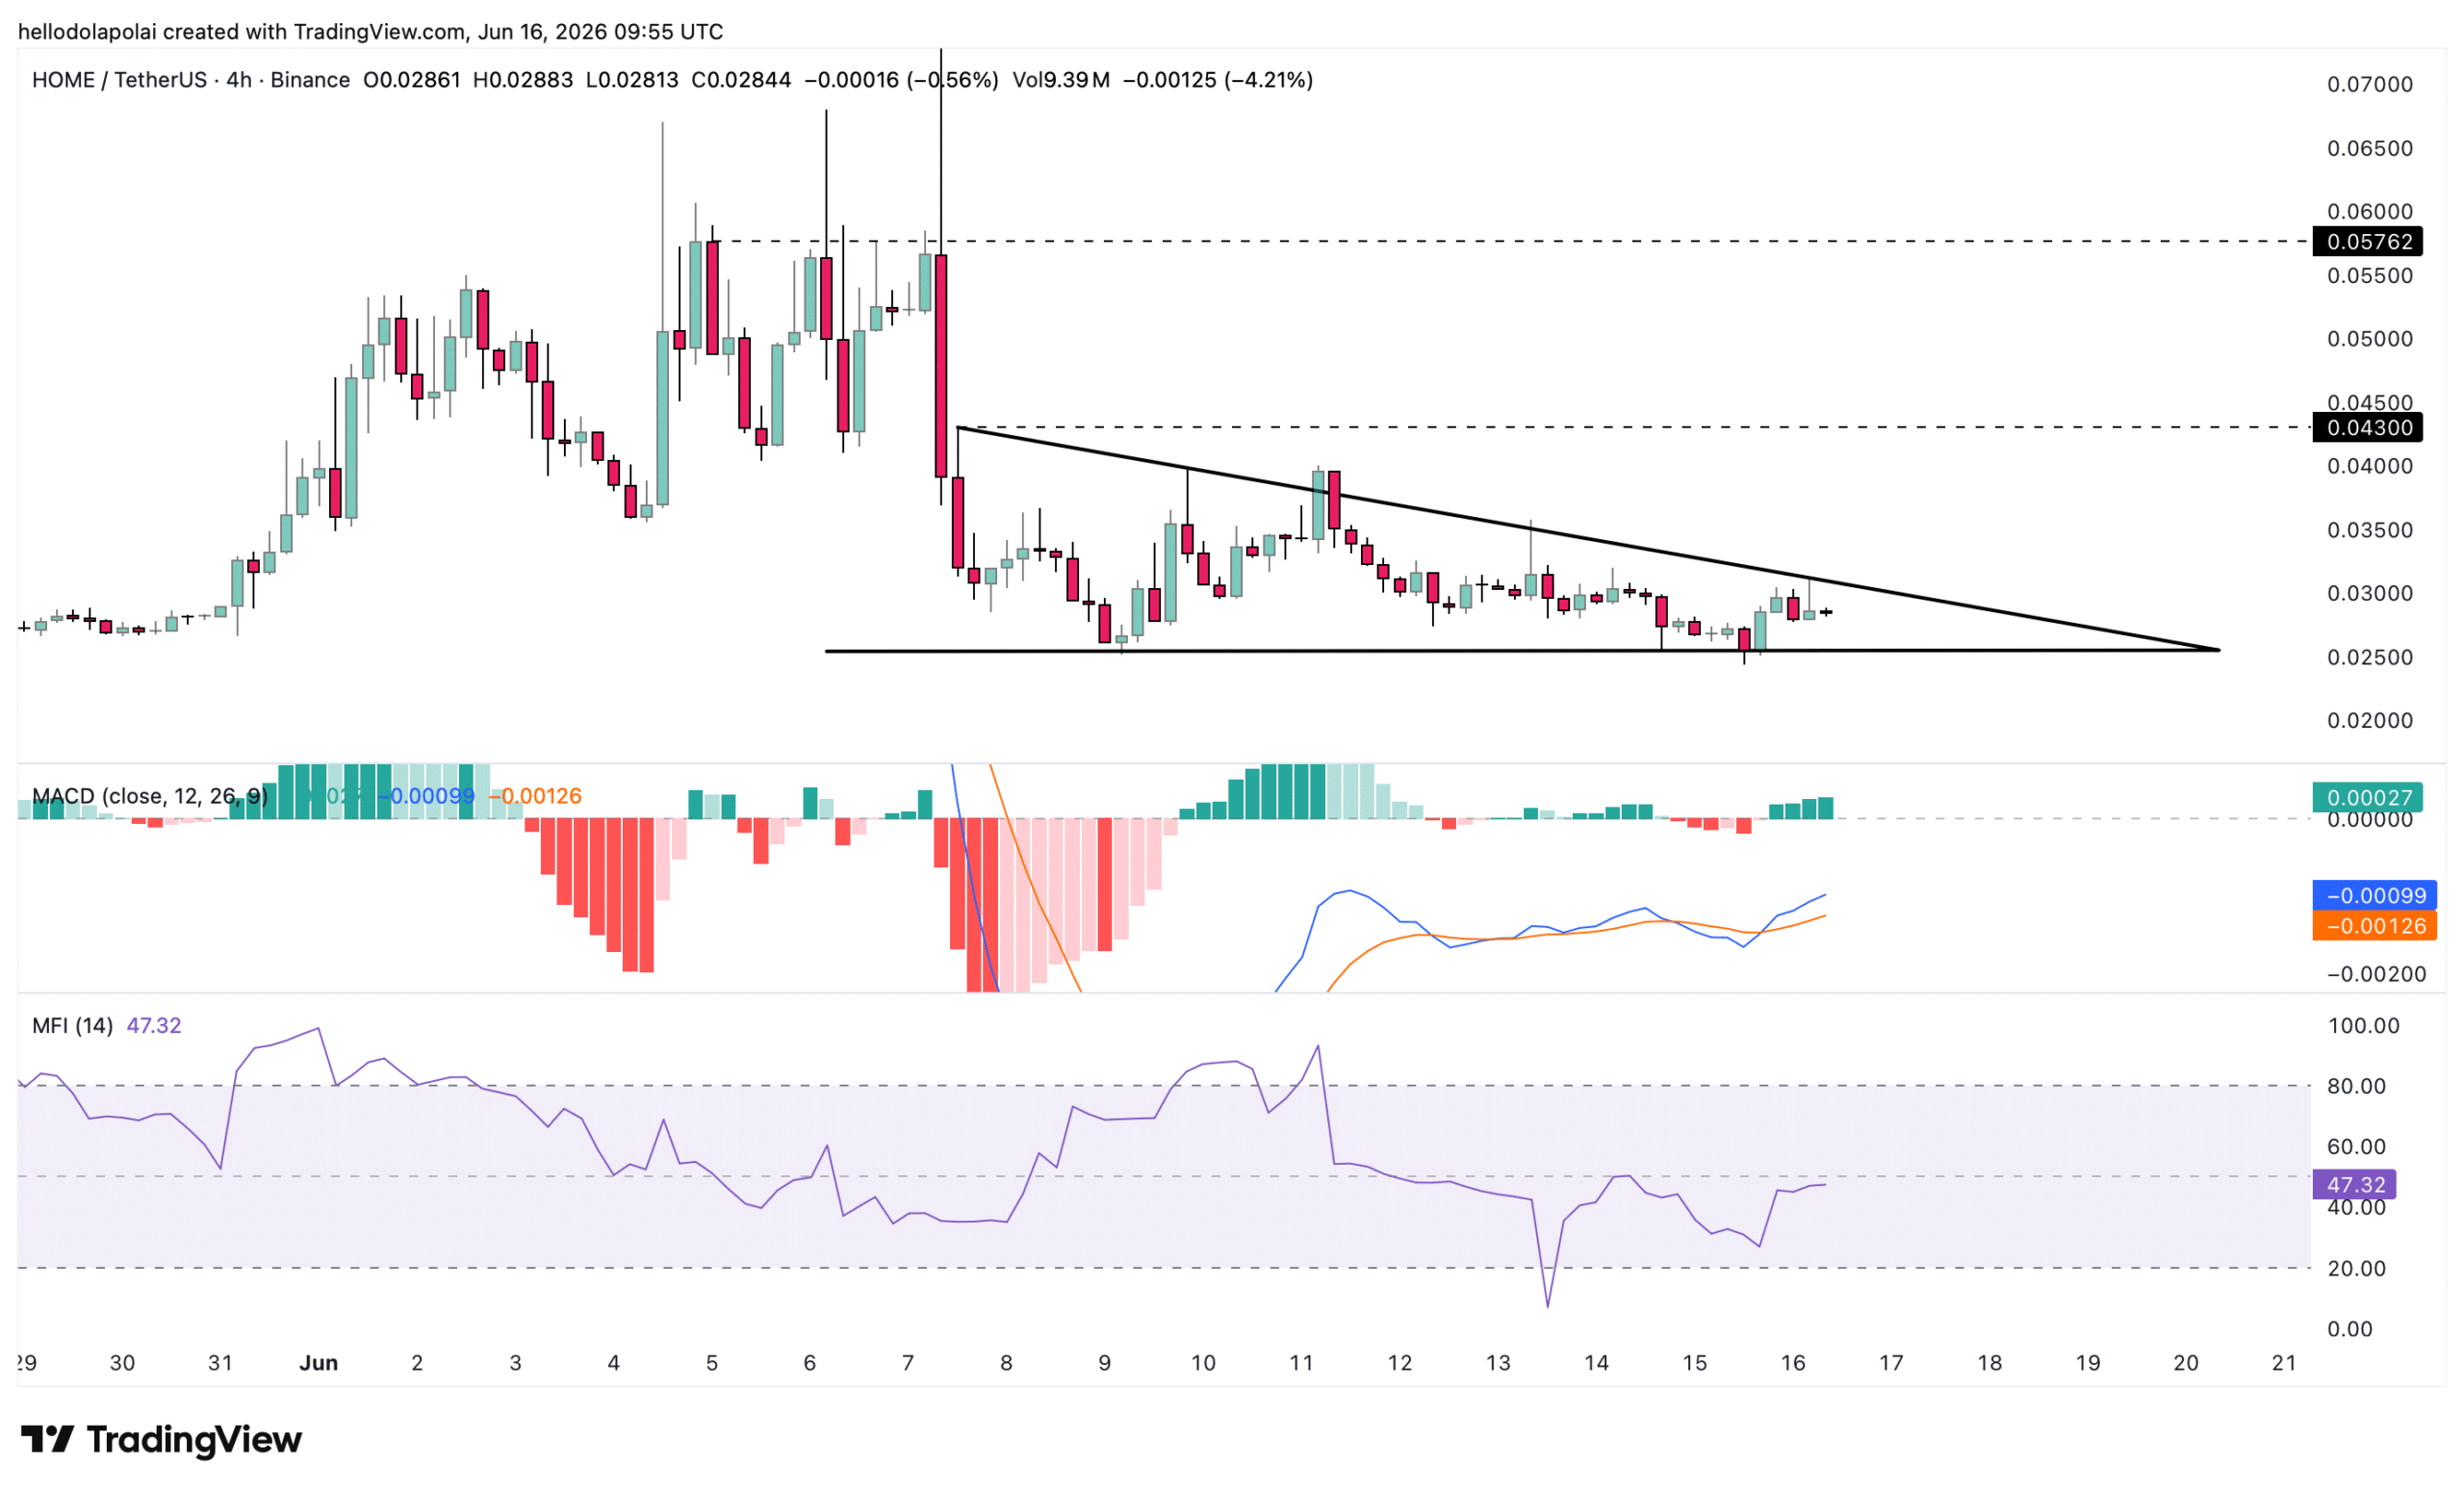
The moving average convergence divergence (MACD) has formed a golden cross, which occurs when the blue MACD line crosses above the orange signal line and keeps trending higher.
The Money Flow Index reinforces that read, tracking liquidity through the market as bullish while capital rotates back into HOME.
From this upswing, the key target remains the $0.04 level—the one closest to the current price—followed by the $0.05 target.
HOME’s long-term rally hinges on holding key support
On the longer-term horizon, the daily chart keeps the possibility of a sustained rally in view. The bulk of that rally would depend on price holding the blue-boxed level as support.
That zone has historically acted as a key resistance area, with price failing to break past it on three separate occasions between November 2025 and March 2026—until June, when HOME finally cleared it and set a new all-time high at $0.077.
If this demand zone holds, HOME could open the door to reclaiming its previous all-time high, a 143% rally from the breakout channel level.
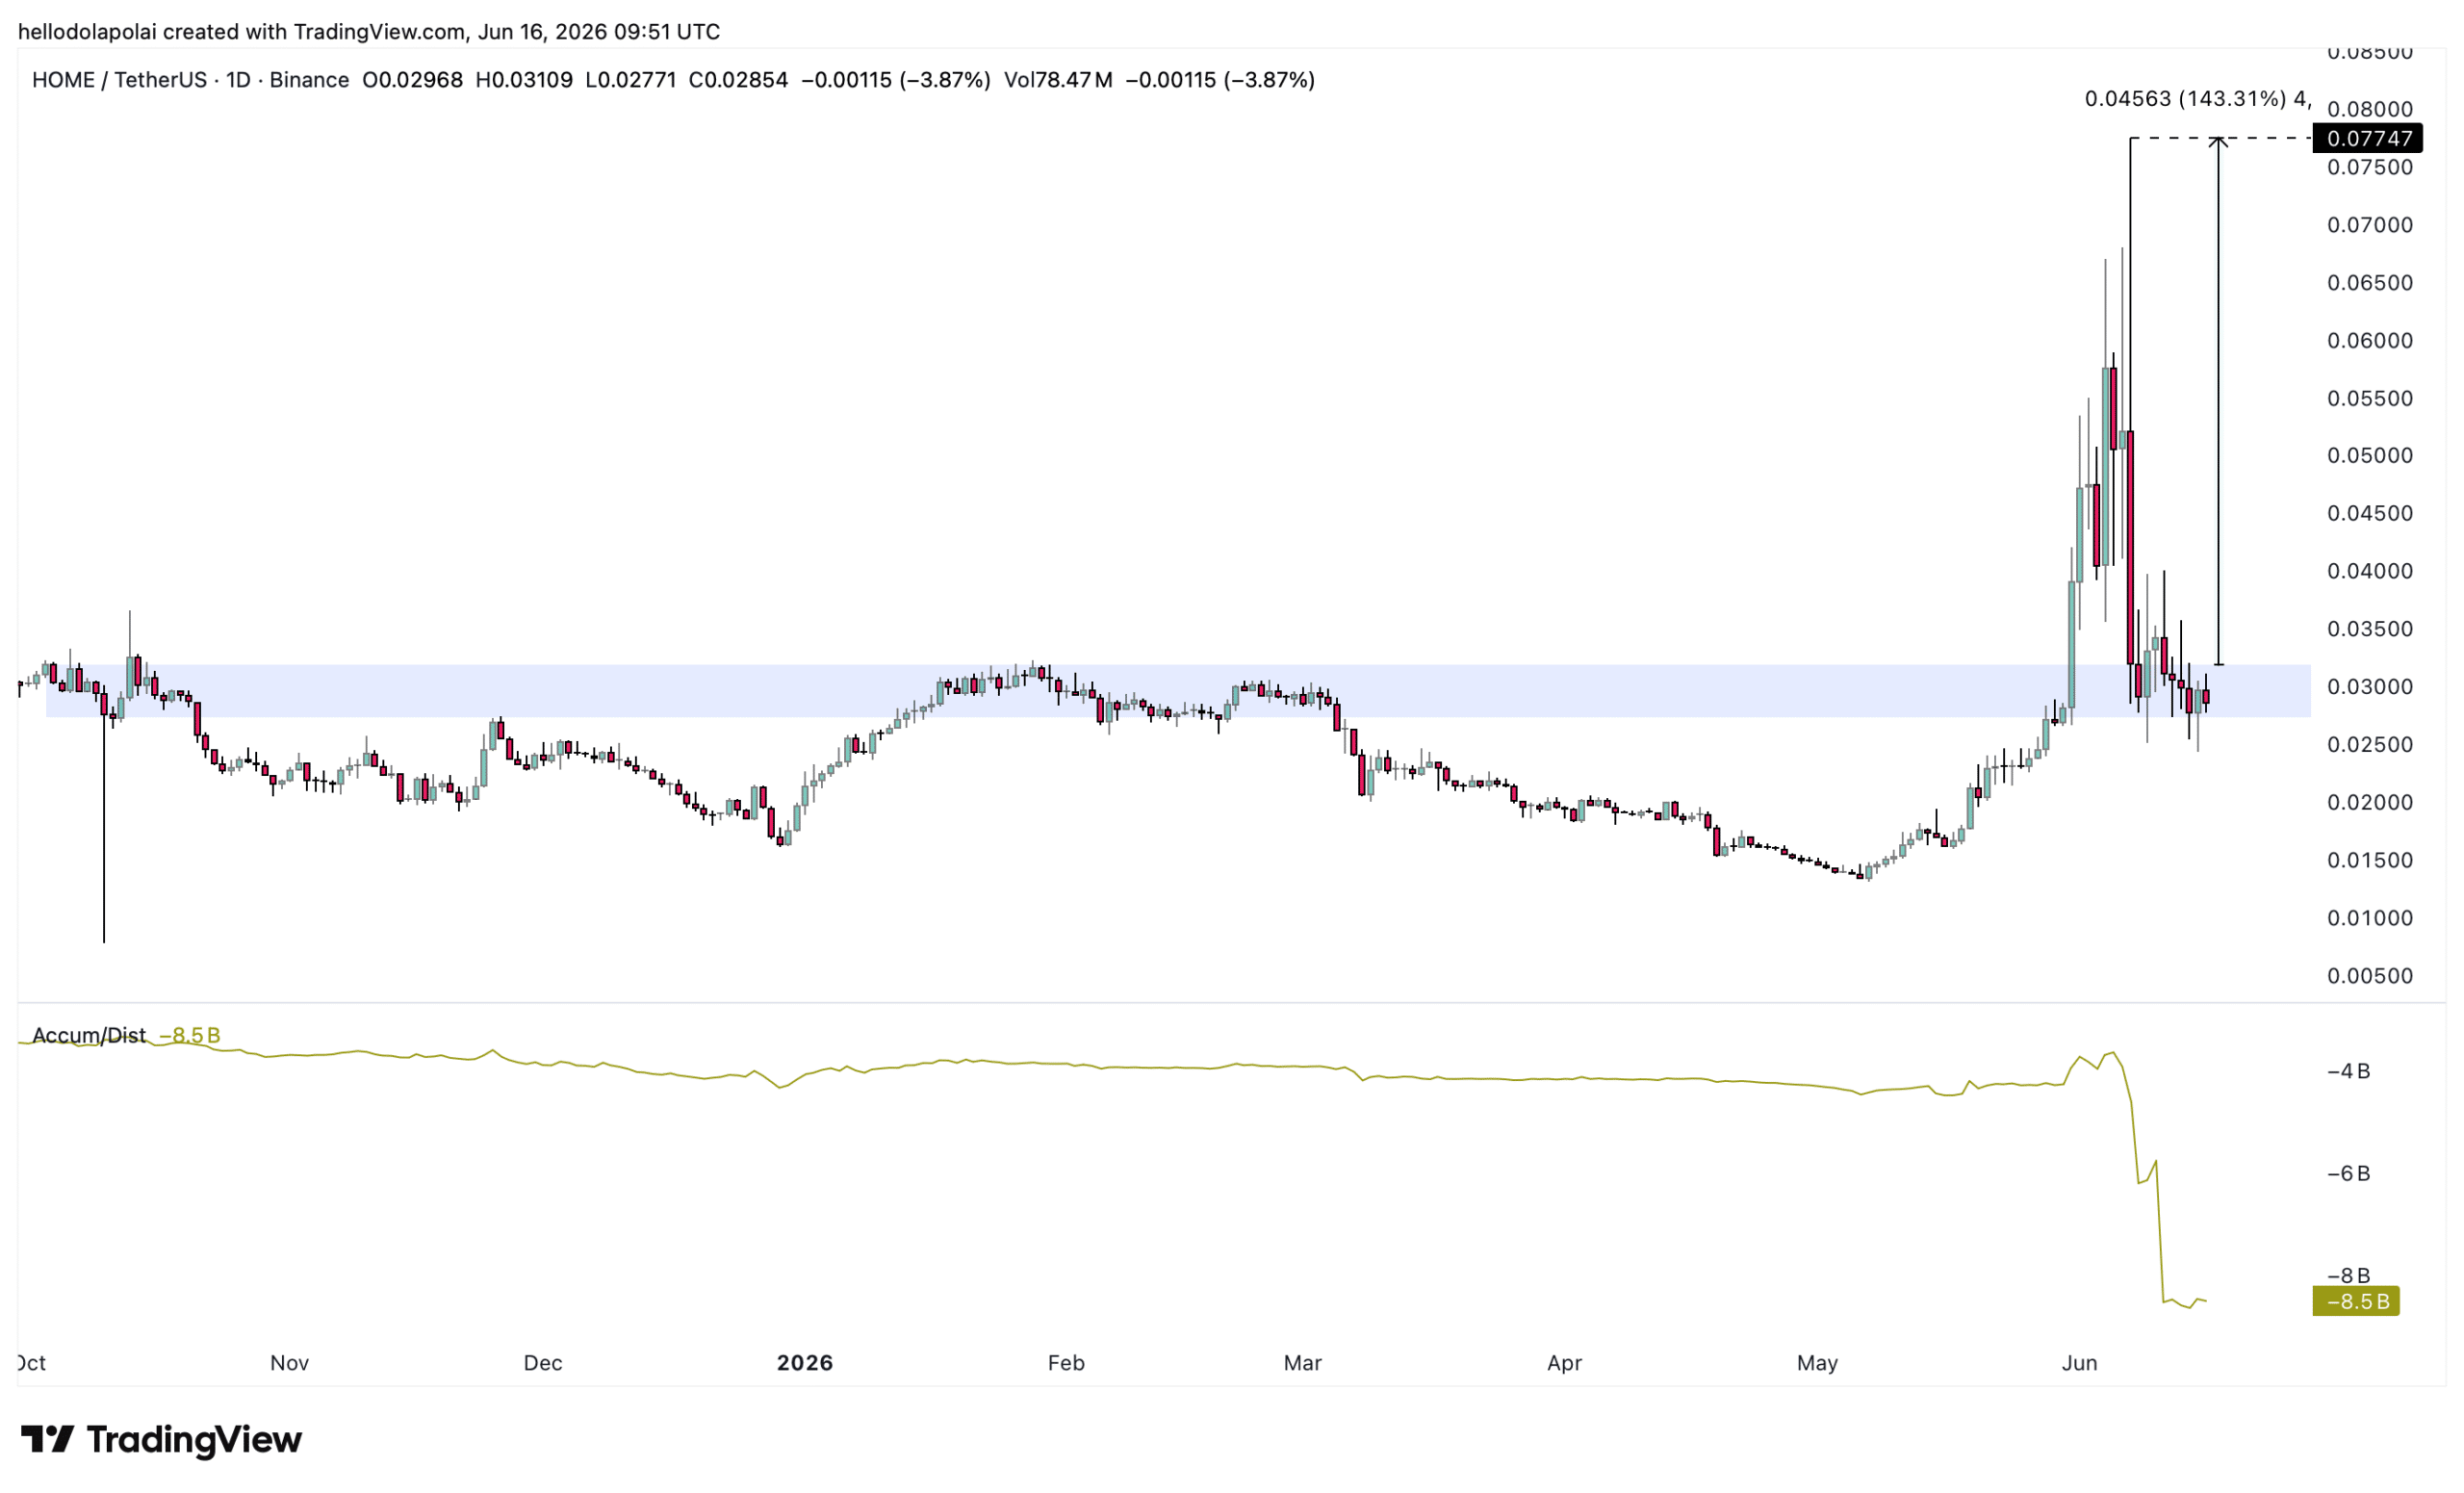
Further down the chart, the accumulation/distribution line reflects heavy selling that has weighed on price, with 8.35 billion HOME sold in total volume over time. The A/D line has since flattened, which in plain terms suggests sellers may be approaching exhaustion.
Short-term price action will set the tone for the broader long-term view, and for now it points to a potential recovery that keeps the long-term rally on the table.
Final Summary
- HOME has gained more than 10% in a day, and traders are buying far more than they’re selling—a sign confidence is coming back into the token.
- If that buying holds, HOME could push back toward its record high, but it first needs to clear a price level that has turned it away before.