Memecoins

DEGEN crypto crashes after a 40% surge in 24 hours: What’s happening?
Posted:
| Last updated: August 7th, 2024

- Degen’s value climbed by 40% between 18th and 19th June.
- As profit-taking intensifies, the token’s price was headed back to its all-time low.
Base memecoin Degen [DEGEN] has witnessed a significant decline in its price in the past few days. This fall follows a 40% spike in its value between 18th and 19th June.
According to CoinMarketCap’s data, on 18th June, DEGEN crypto’s price had plummeted to an all-time low of $0.0074. However, the resurgence in the general meme market that day brought DEGEN to the focus of many traders.
The rally
As gleaned on-chain, its social activity spiked to an all-time high on that day. According to Santiment, DEGEN’s social dominance was 17.92%, while its social volume was 2970 on 18th June.
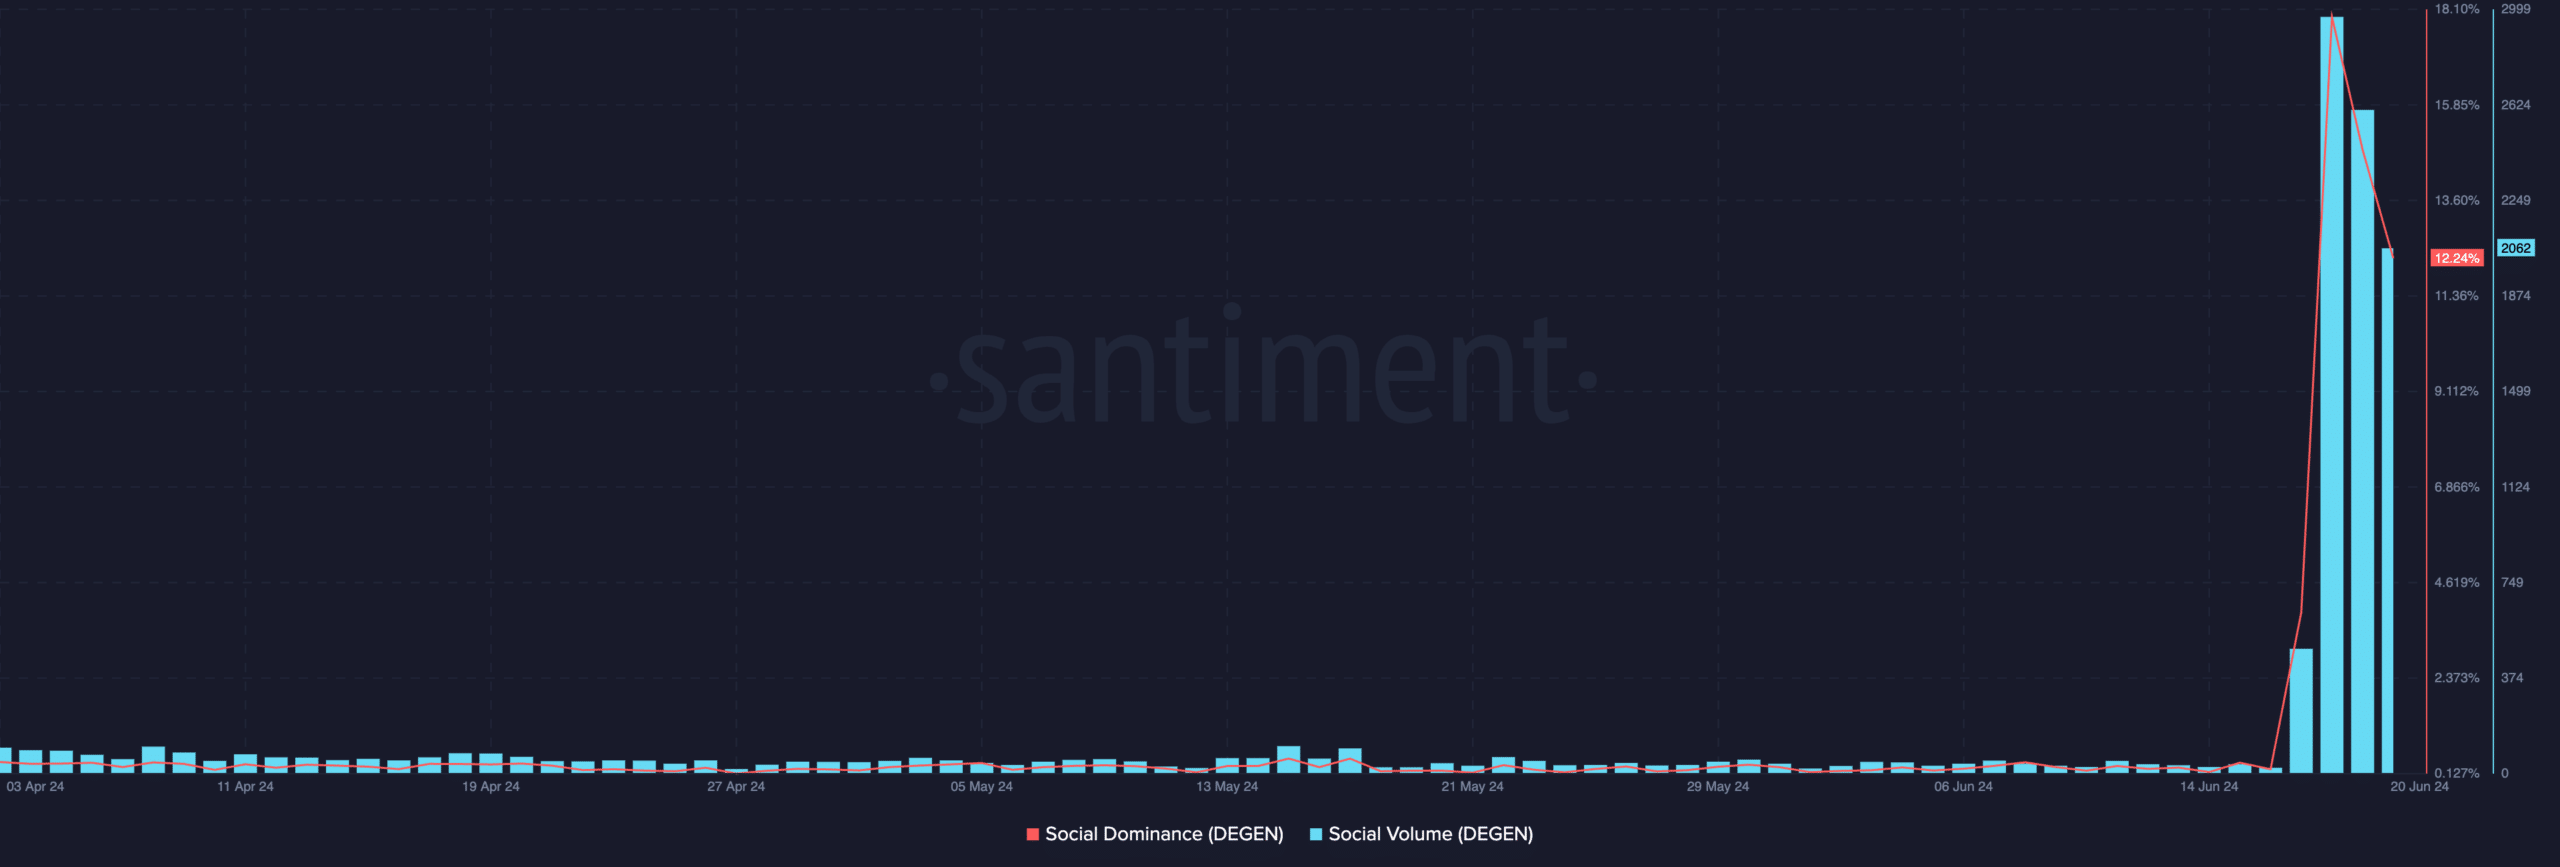
Source: Santiment
An asset’s social dominance measures its share of online discussions that specifically mention it compared to the total discussions around the top 100 cryptocurrencies by market capitalization.
This showed that on 18th June, discussions about DEGEN comprised 17.92% of all online crypto conversations. The token was also mentioned 2,970 times that day.
The market sentiment toward it shifted to become bullish as traders began to “ape in” on the meme coin.
For context, before 18th June, the coin’s weighted sentiment had been bearish since 18th May. However, on 18th June, DEGEN’s weighted sentiment climbed to an all-time high of 2.75.
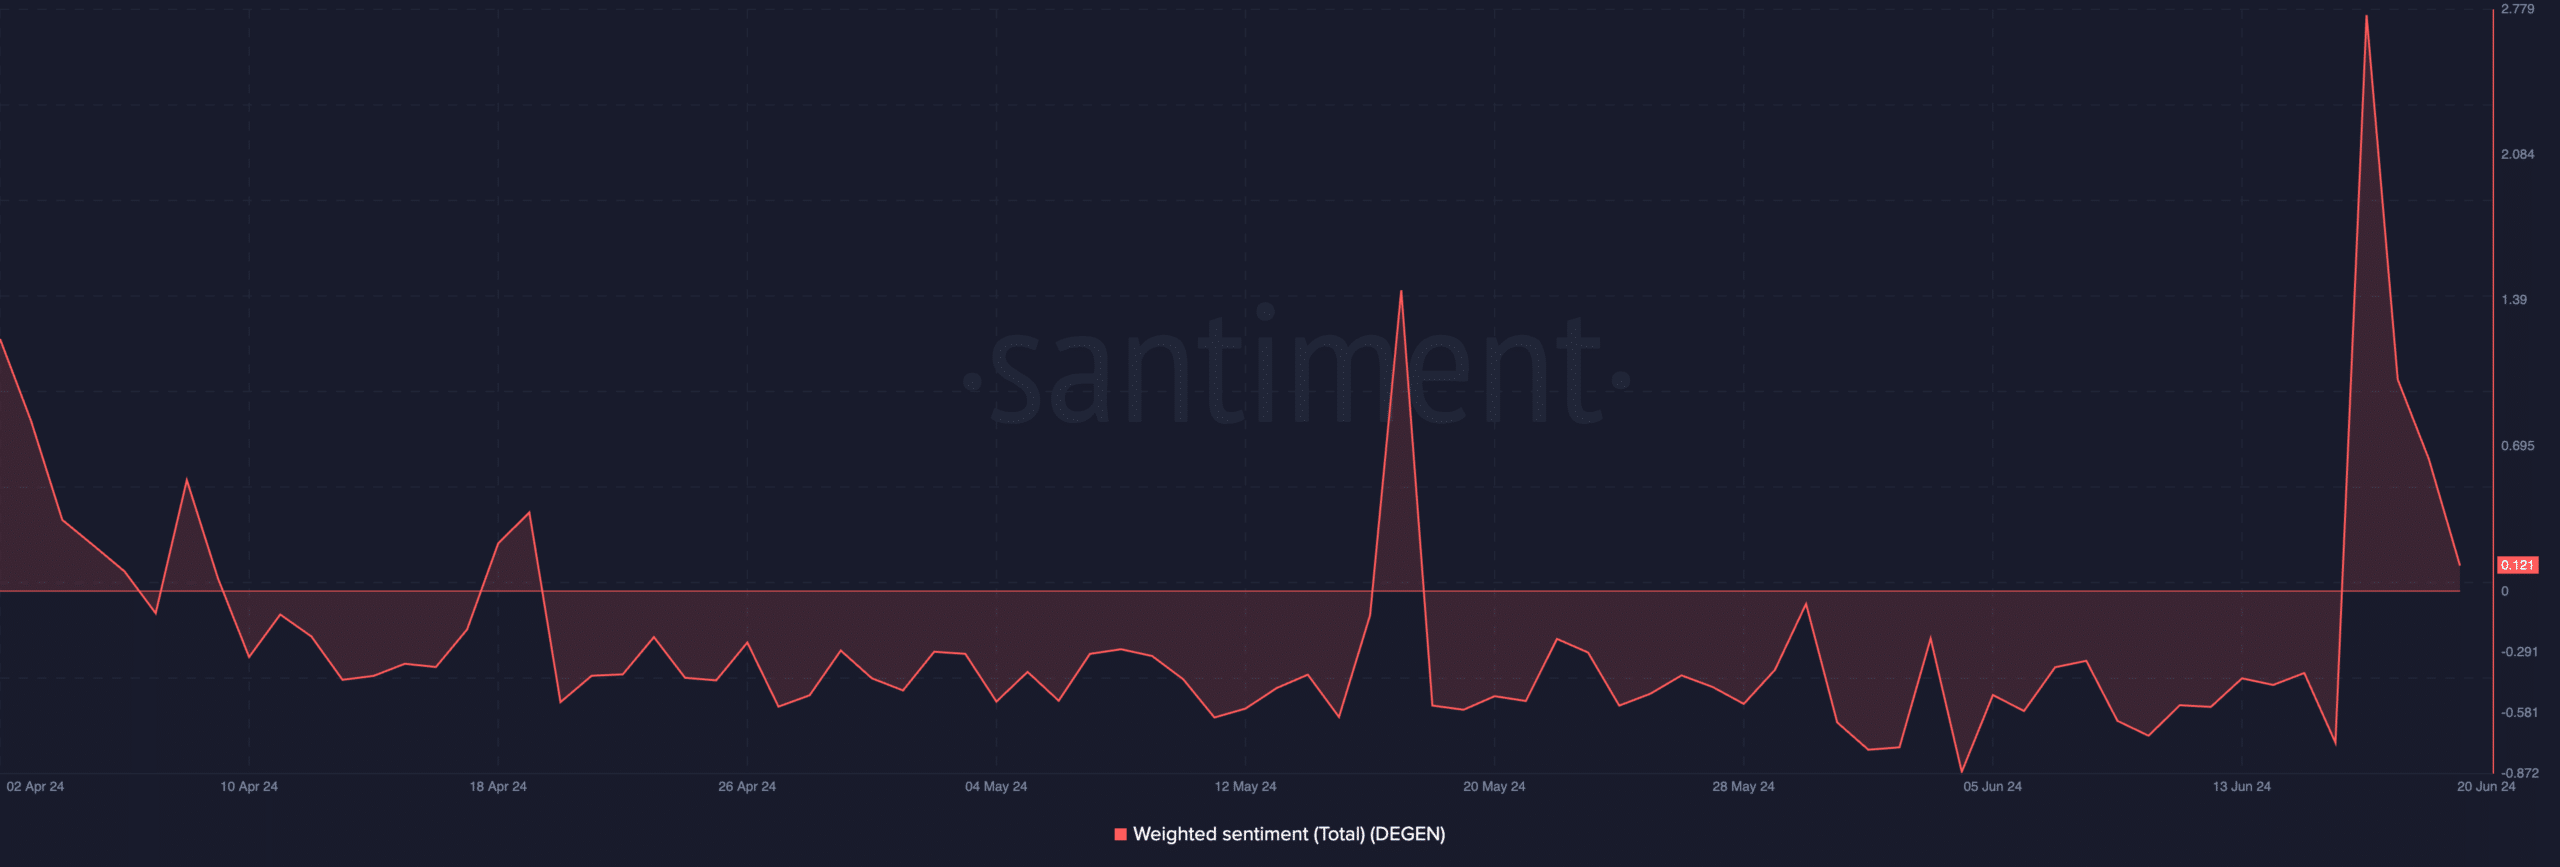
Source: Santiment
The decline
The increased trading activity witnessed between 18 and 19 June pushed DEGEN’s price above $0.01. With many of its holders in profit at this point, sell-offs soon began. At $0.0097 at press time, the meme coin’s value has since plummeted by 14%.
AMBCrypto’s assessment of its price movements on a daily chart confirmed the possibility of a further decline in the meme coin’s value.
The dots that make up DEGEN’s Parabolic Stop and Reverse (SAR) indicator rested above its price at the time of press. They have been so positioned since 6 June, even during DEGEN’s double-digit price rally between 18 and 19 June.
An asset’s Parabolic SAR indicator measures its potential trend direction and reversals. When its dots lie above the asset’s price, the market is said to be in a decline. It indicates that the asset’s price has been falling and may continue.
Is your portfolio green? Check out the DEGEN Profit Calculator
Confirming the strength of the decline, DEGEN’s Aroon Down Line was 78.57%. This indicator measures an asset’s trend strength and identifies its potential price reversal points.
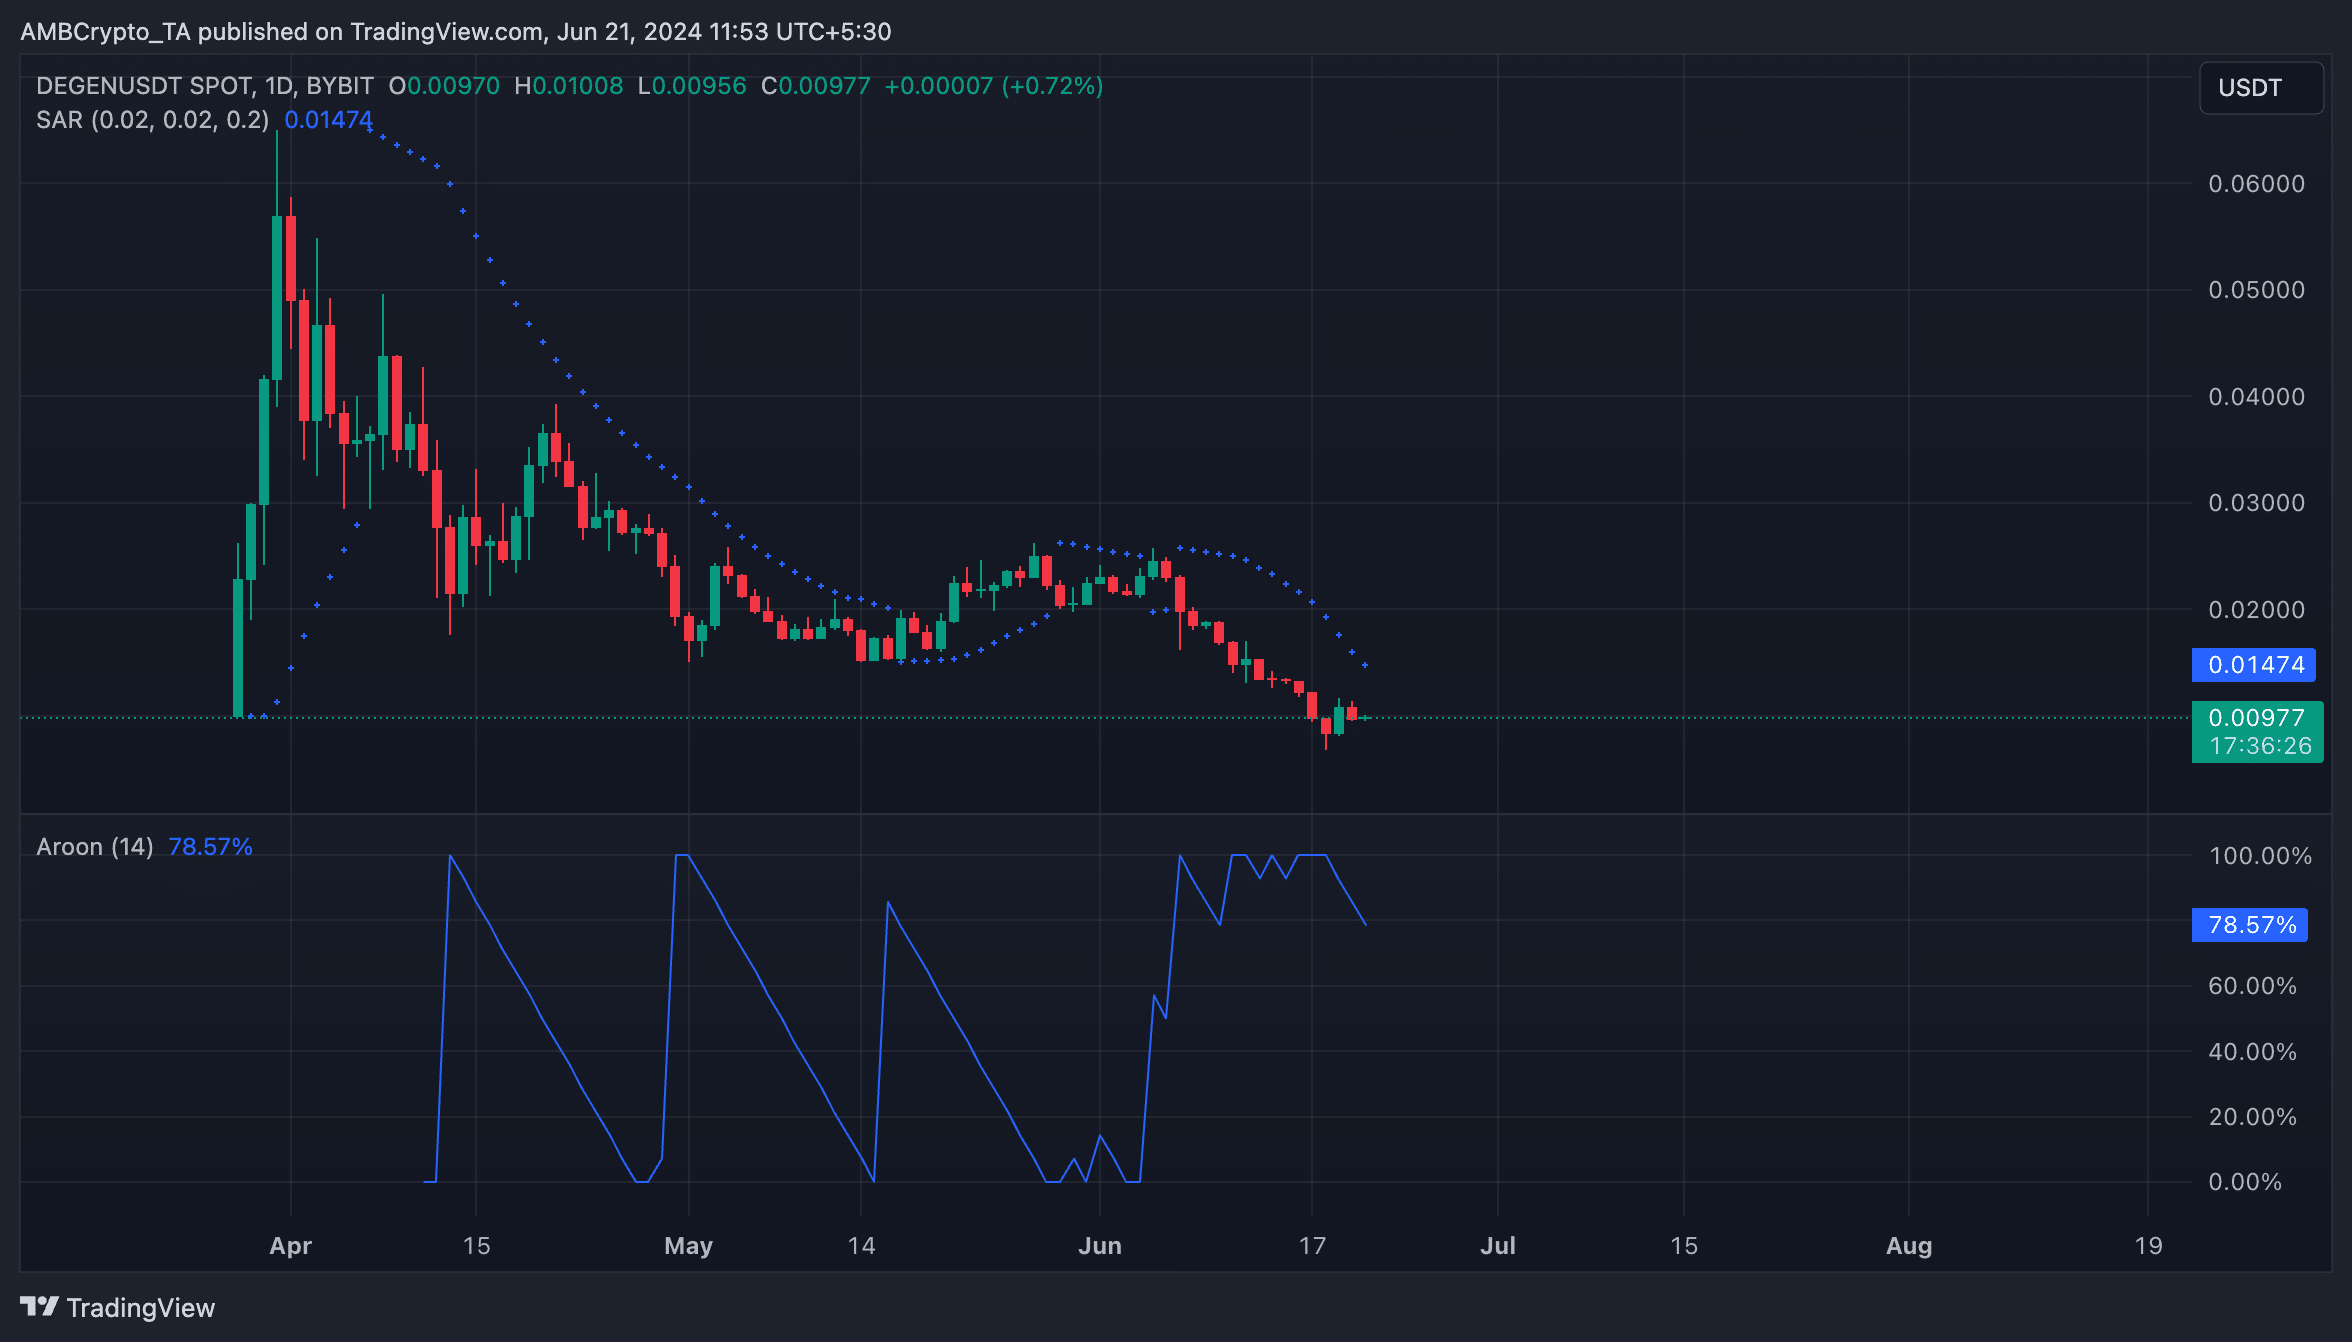
Source: TradingView
When the Down Line is close to 100% like this, it indicates that the downtrend is strong and that the most recent low was reached relatively recently.