Despite everything, Bitcoin’s [BTC] pricing model has something else to say

Bitcoin has finally broken out of the tight range where it was stuck for the better part of May. However, it exited the range courtesy of a strong bearish performance in the second week of June.
Bitcoin’s latest weekly performance was contrary to the expectations of a bullish breakout after April and May’s bearish performance. It continued to extend its downtime and traded at $23,707 at press time. Its price action has also broken below a long-term descending trend line.
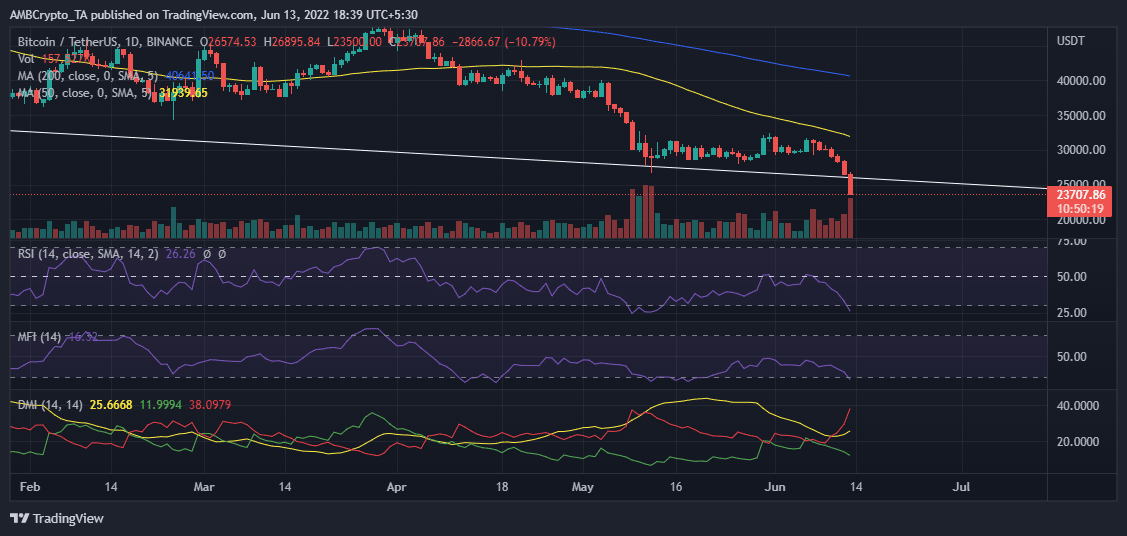
BTC is oversold according to the RSI following its extended downside. However, the market suggests that BTC might be ready for some upside its Money Flow indicator which is also in the accumulation zone. These indicators suggest that BTC is ripe for a recovery rally but could it be a signal that the market is on the cusp of another major bull run?
Bitcoin’s pricing model suggests that the start of the next bull run is near
Although Bitcoin is already oversold at its current level, there is still a chance that it will achieve more downside. The bears are currently running a strong assault resulting in the liquidation of long positions. Margin calls have contributed to the downward pressure and might continue to push the price lower. The lower price levels have pushed BTC’s price closer to its realized price.
Glassnode’s BTC pricing model suggests that Bitcoin enters an accumulation zone when its price interacts with the realized price. It has already touched the realized and additional downward pressure will send the Bitcoin price below the realized price. This scenario has historically resulted in strong accumulation and the start of a bullish wave.

The MVRV ratio also acts as a healthy indicator for confirming the end of a trend. For example, whenever it drops below 1 as the price falls below the realized price line, a bull run starts soon after. The MVRV ratio was at 1.14 at press time.
Bitcoin’s supply distribution by balance on addresses reveals that addresses holding between 1,000 and 10,000 BTC increased their holdings from 26.78% to 27.02% between 11 June and 13 June. This suggests that they were buying the dip. However, addresses holding between 10,000 and 100,000 reduced their holdings from 11.97% to 11.76% during the same period.
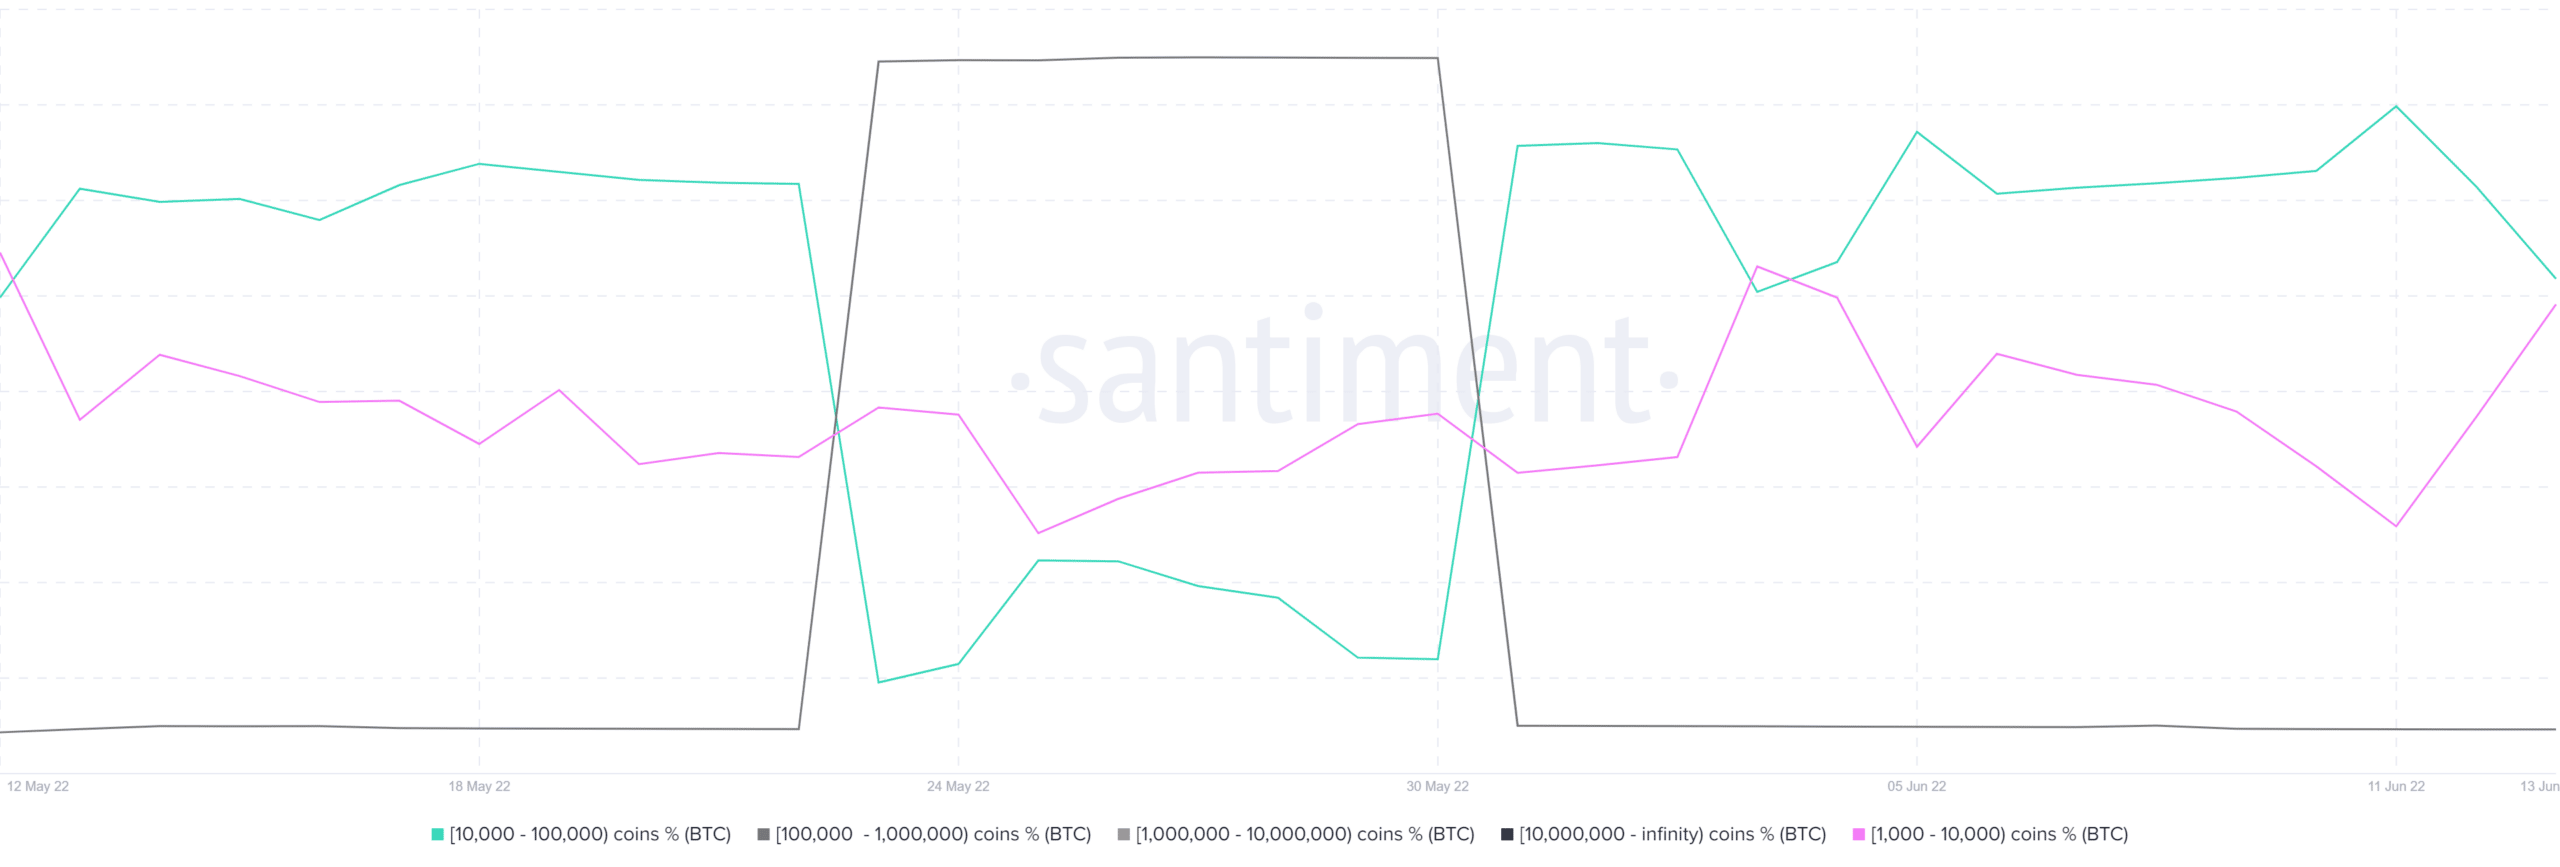
The balance on addresses holding between 100,000 and 1 million BTC coins remained the same. The above observation suggests that some of the addresses with larger balances offloaded a significant amount. This may have contributed to the downward pressure, alongside the selling pressure from margin calls.