Did Bitcoin’s price really bottom out?
The current reading of 1.24 on the Bitcoin LTH MVRV is the lowest in three years and shows the market is approaching historical cycle lows.

Bitcoin [BTC] was down 3.4% in the past 24 hours, with $104.38 million in liquidations. Of these, $91.66 million worth of positions were long and were forced to close as BTC dipped deeper below $60k.
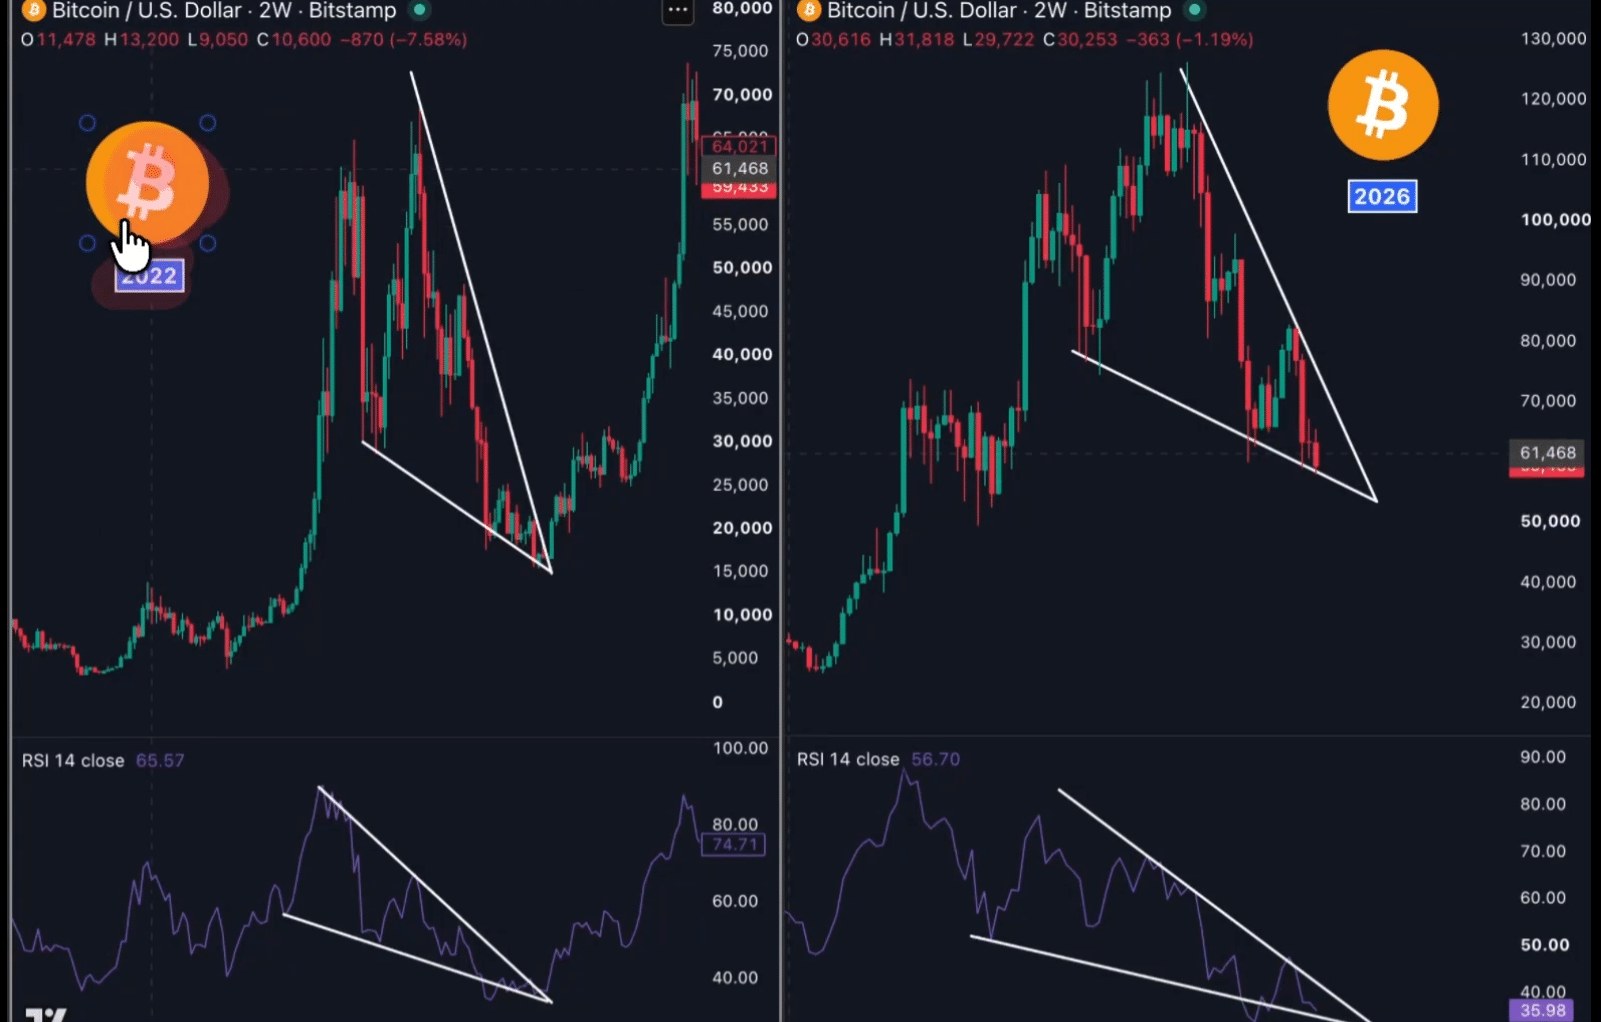
In a post on X, influencer CryptoRover shared a piece of technical analysis. The price chart outlined the descending triangle pattern that Bitcoin made in 2021-2022, and the RSI also formed a similar structure.
The same pattern was repeating in 2025-2026. It is possible that, like the previous time, the market bottom would need some time to form before it breaks out past the triangle pattern.
If the previous cycle repeats itself, a bullish turnaround can commence in Q4 2026. It should be remembered that, as things stand, whale accumulation was underway but not rapid enough to warrant a market turnaround.
Will it be this simple for Bitcoin investors?
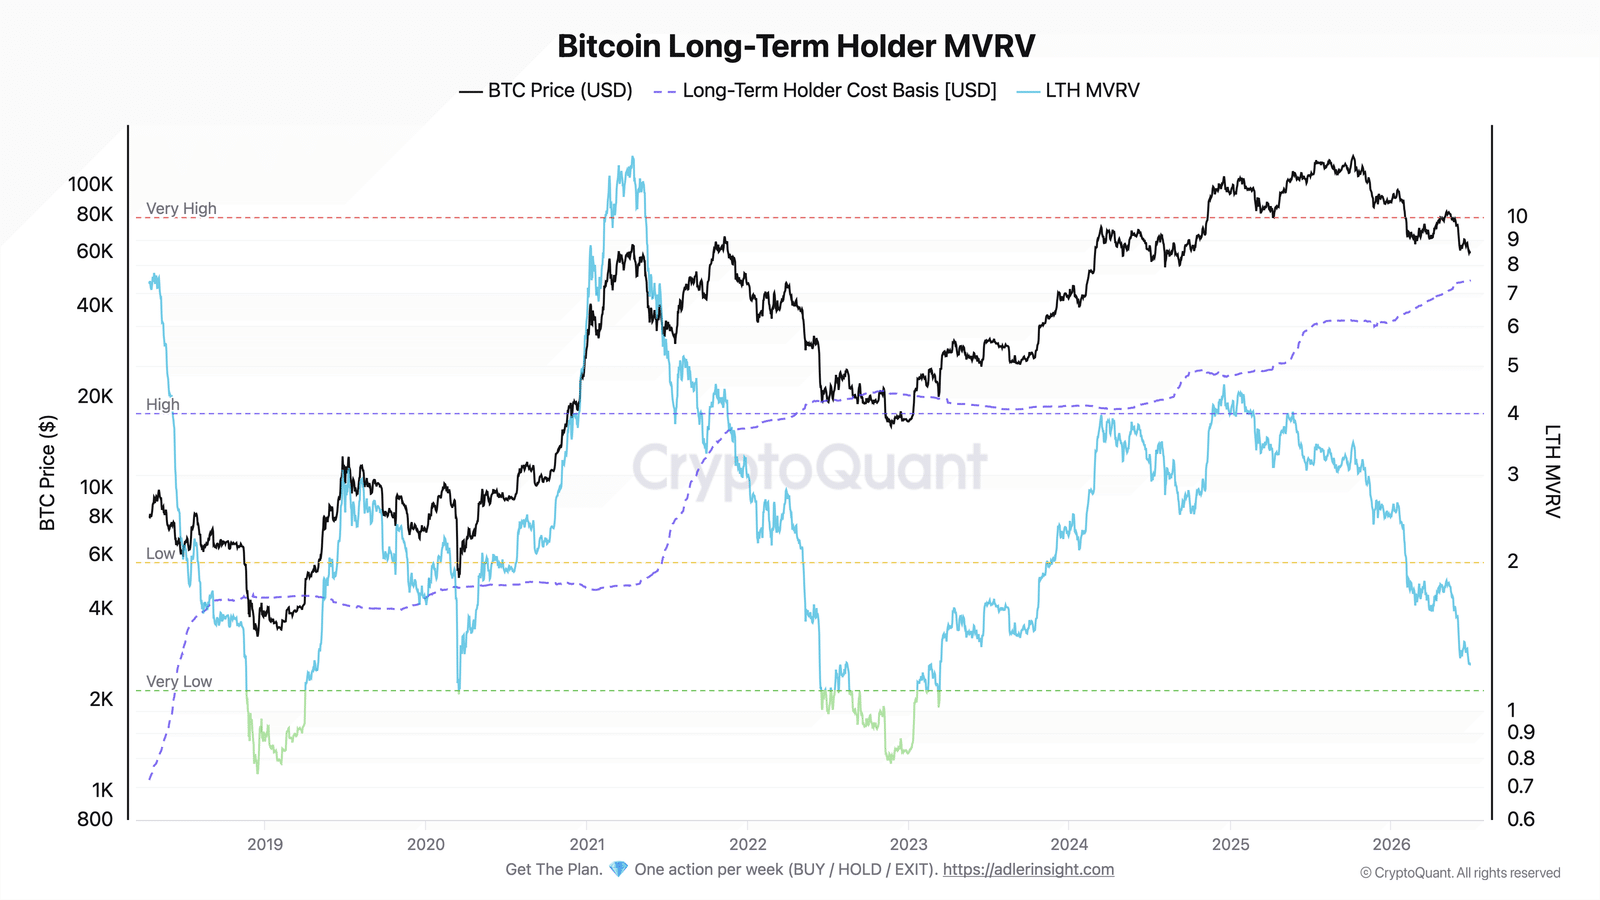
Crypto analyst Axel Adler Jr. observed that the Bitcoin long-term holder MVRV has compressed to 1.24. The metric is the ratio of the market value of long-term holders’ coins, compared to their average purchase price.
The current reading of 1.24 is the lowest in three years and shows the market is approaching historical cycle lows. The MVRV needs to fall into the “Very Low” green capitulation zone to give a bottom confirmation.
Additionally, the long-term holder’s average cost basis is at $48.4k. A price drop below this level will put this cohort underwater, on average, and signal capitulation from even the most hardcore holders.
Bitcoin is on track with the 4-year cycle
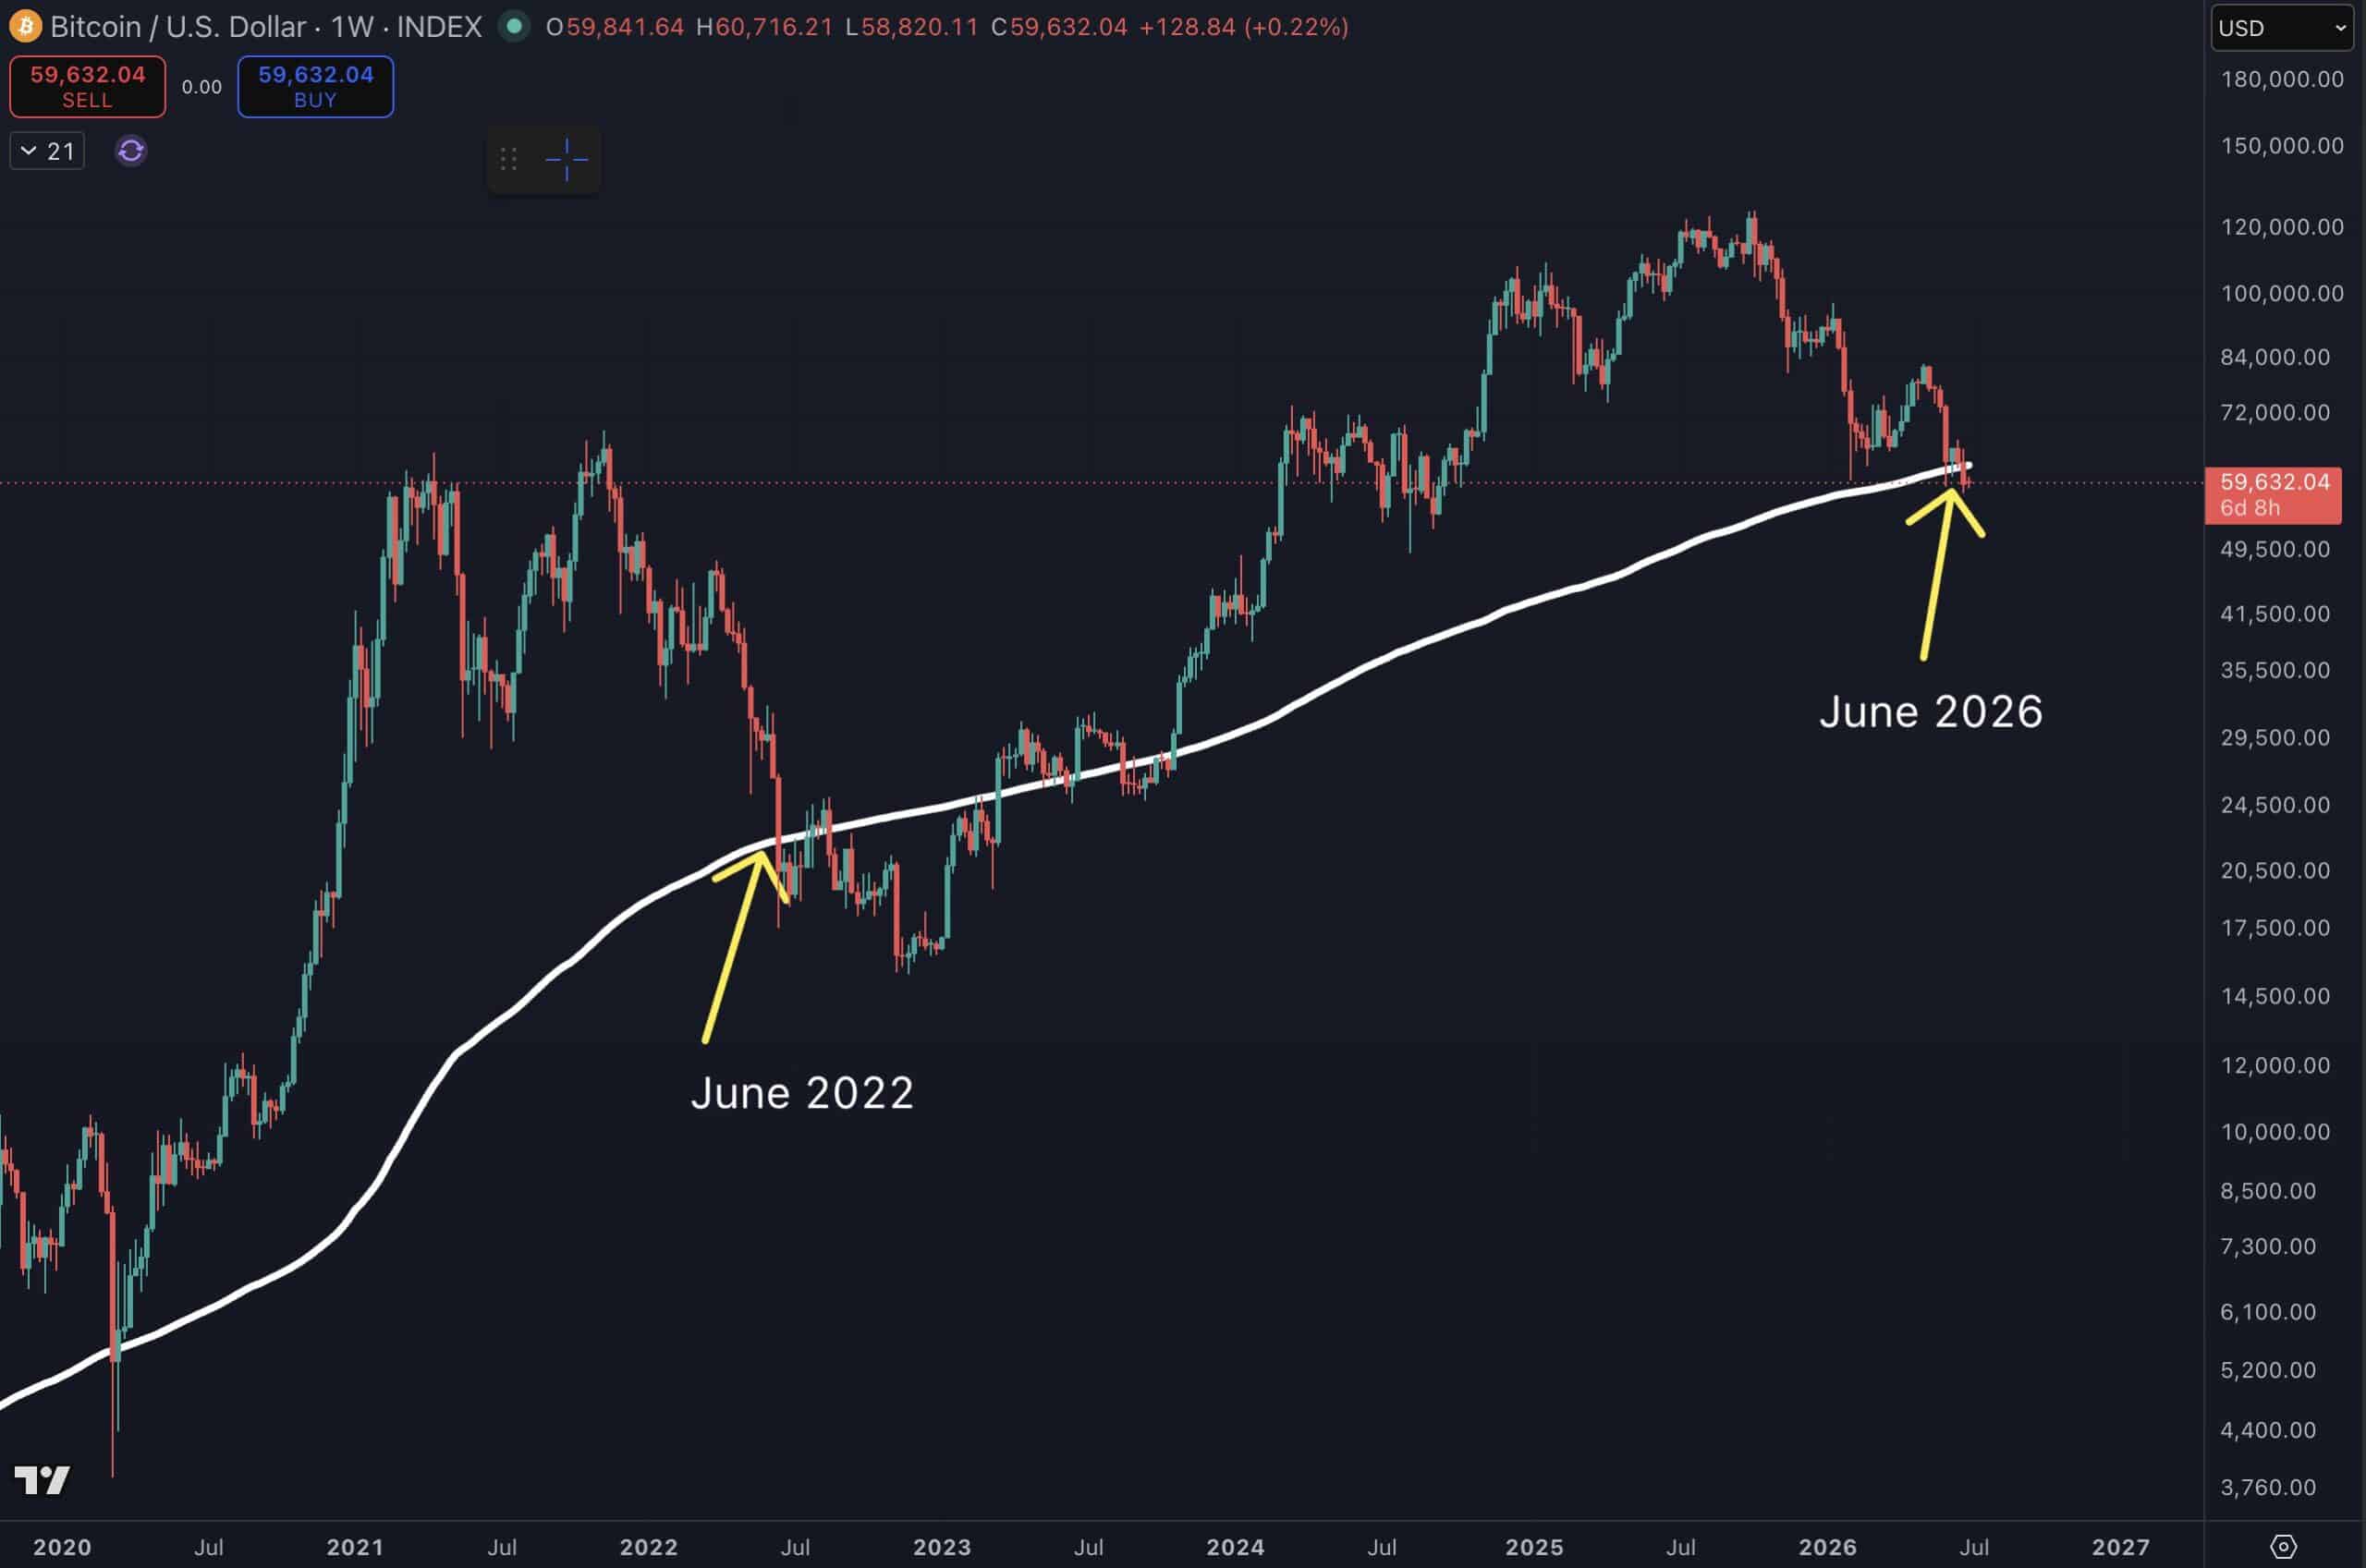
Founder and CEO of Into The CryptoVerse, Benjamin Cohen, used the 200-week moving average to highlight that the 4-year cycle was right on track.
June of 2022 and 2026 saw this moving average breached to the downside, setting up a remarkable similarity across cycles.
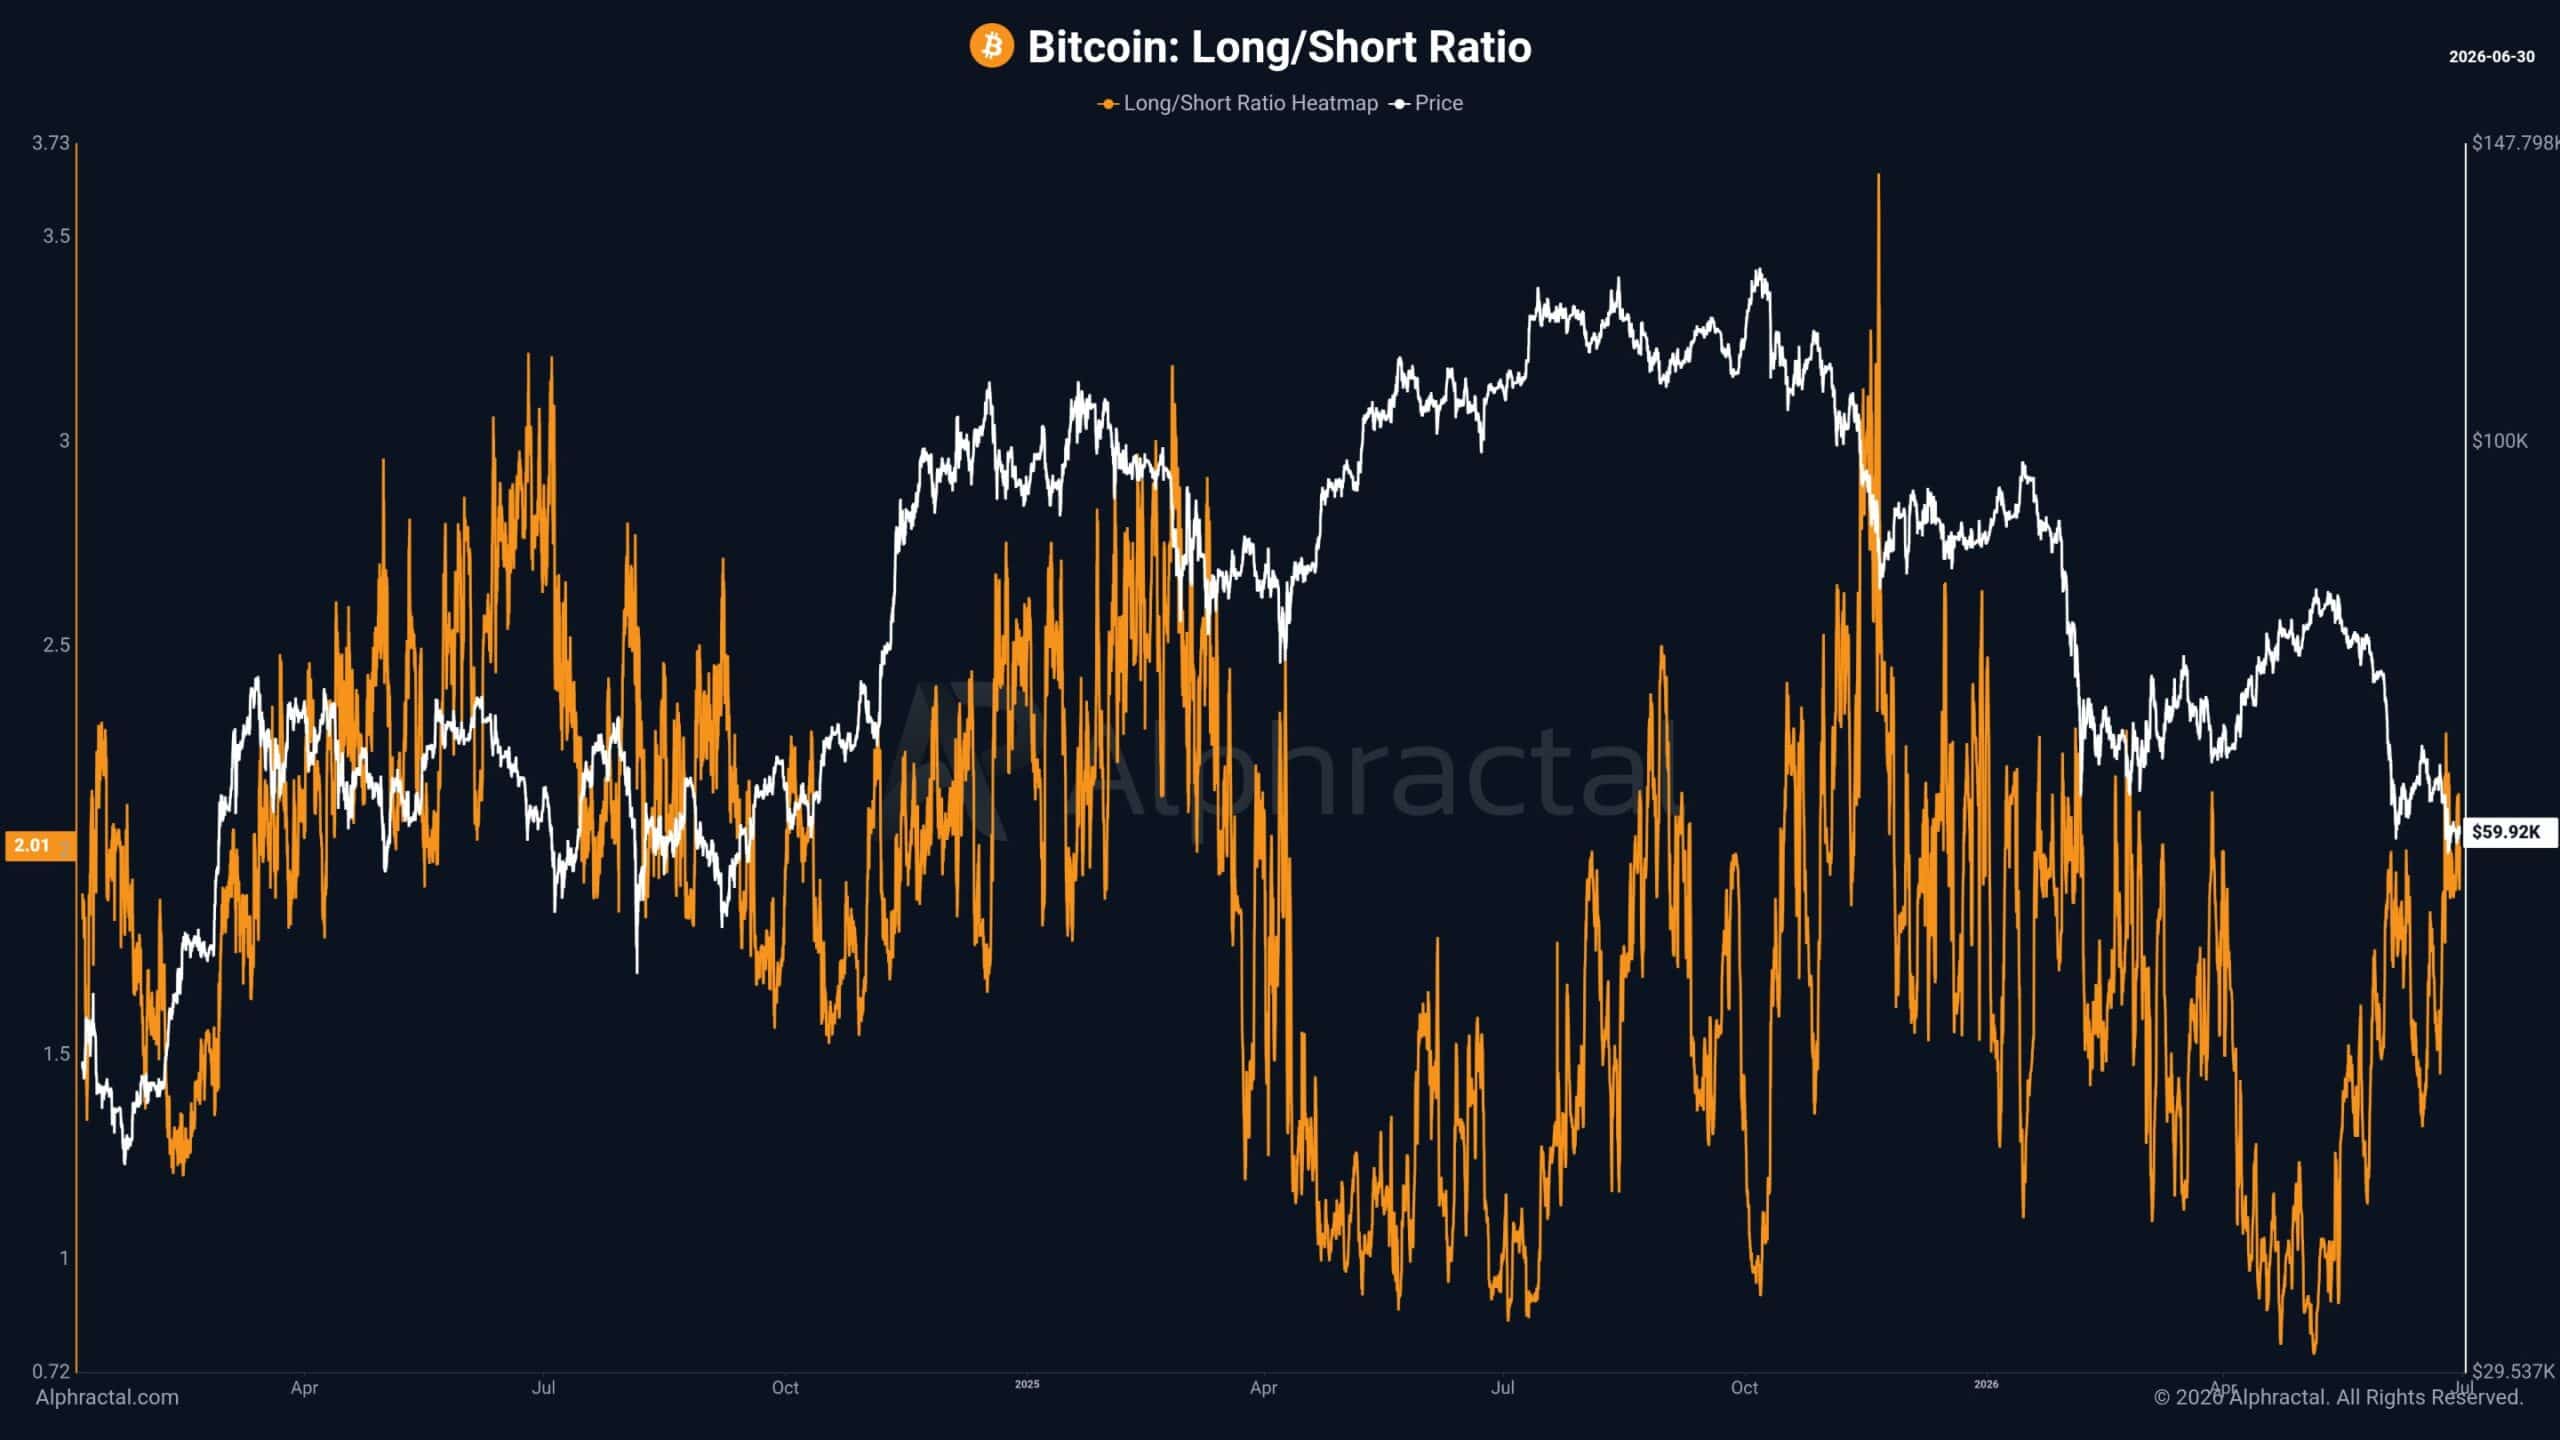
The rising long/short ratio implied more traders were going long in the derivatives market than were positioned short. “This excessive Long exposure is one of the main reasons behind the recent selloffs”, wrote CEO of Alphractal Joao Wedson.
It implied that, like the wave of long liquidations in the first week of June, another long squeeze could commence in the coming days and weeks.
Final Summary
- The Bitcoin price action has breached the 200-week moving average and could go down further in the coming months.
- The market was approaching historical bottom conditions, compared to previous cycles, but was not quite there yet.