Diving into Bitcoin whale activity: 15K BTC snapped up in 2 days
Although BTC whales continue to buy the coin, bearish sentiments remain significant.

- A cohort of BTC whales have continued to fill their bags.
- This has happened despite the coin’s recent price action.
Bitcoin [BTC] whales have intensified accumulation despite the coin’s recent decline below $62,000.
According to on-chain data provider Santiment, BTC whales holding between 1000 and 10,000 coins accumulated 15,121 BTC valued at $930 million between the 7th and the 8th of May.
This pushed the cohort’s total BTC holding to its highest level in 14 days.
🐳 As #Bitcoin ranges tightly between $61K and $64K, large whales have made some accumulation moves over the past 24 hours. Wallets with 1K-10K $BTC have collectively accumulated ~$941M worth of coins, rebounding to their highest holding level in 2 weeks. https://t.co/NkYwRsc8Pd pic.twitter.com/LWAt03TgUP
— Santiment (@santimentfeed) May 8, 2024
At press time, this group of BTC investors held 38% of the coin’s circulating supply of 20 million BTC.
BTC has the bears to contend with
At press time, BTC exchanged hands at $61,621. The coin recently crossed below its 20-day simple moving average (SMA), putting it at risk of a further decline in the short term.
When an asset’s price falls below its 20-day SMA, it suggests that the short-term trend for the asset is downward.
Market participants often view this as a sign that sellers are in control and that the asset’s price will likely continue declining.
Readings from BTC’s price movement on a 1-day chart showed that its price fell below its 20-day SMA on the 7th of May and has since witnessed a 3% decline in its value.
Further, the coin has seen a decline in demand among general market participants. An assessment of its key momentum indicators showed them below their respective center lines at press time.
For example, the coin’s Relative Strength Index (RSI) was 44.12, while its Money Flow Index (MFI) was 23.21. At these values, the indicators showed significant bearish pressure in the market.
Likewise, as of this writing, the coin’s Chaikin Money Flow (CMF) was poised to cross below the zero line. This indicator measures the money flow into and out of the coin’s market.
A CMF value below zero indicates market weakness, suggesting increased liquidity exit.
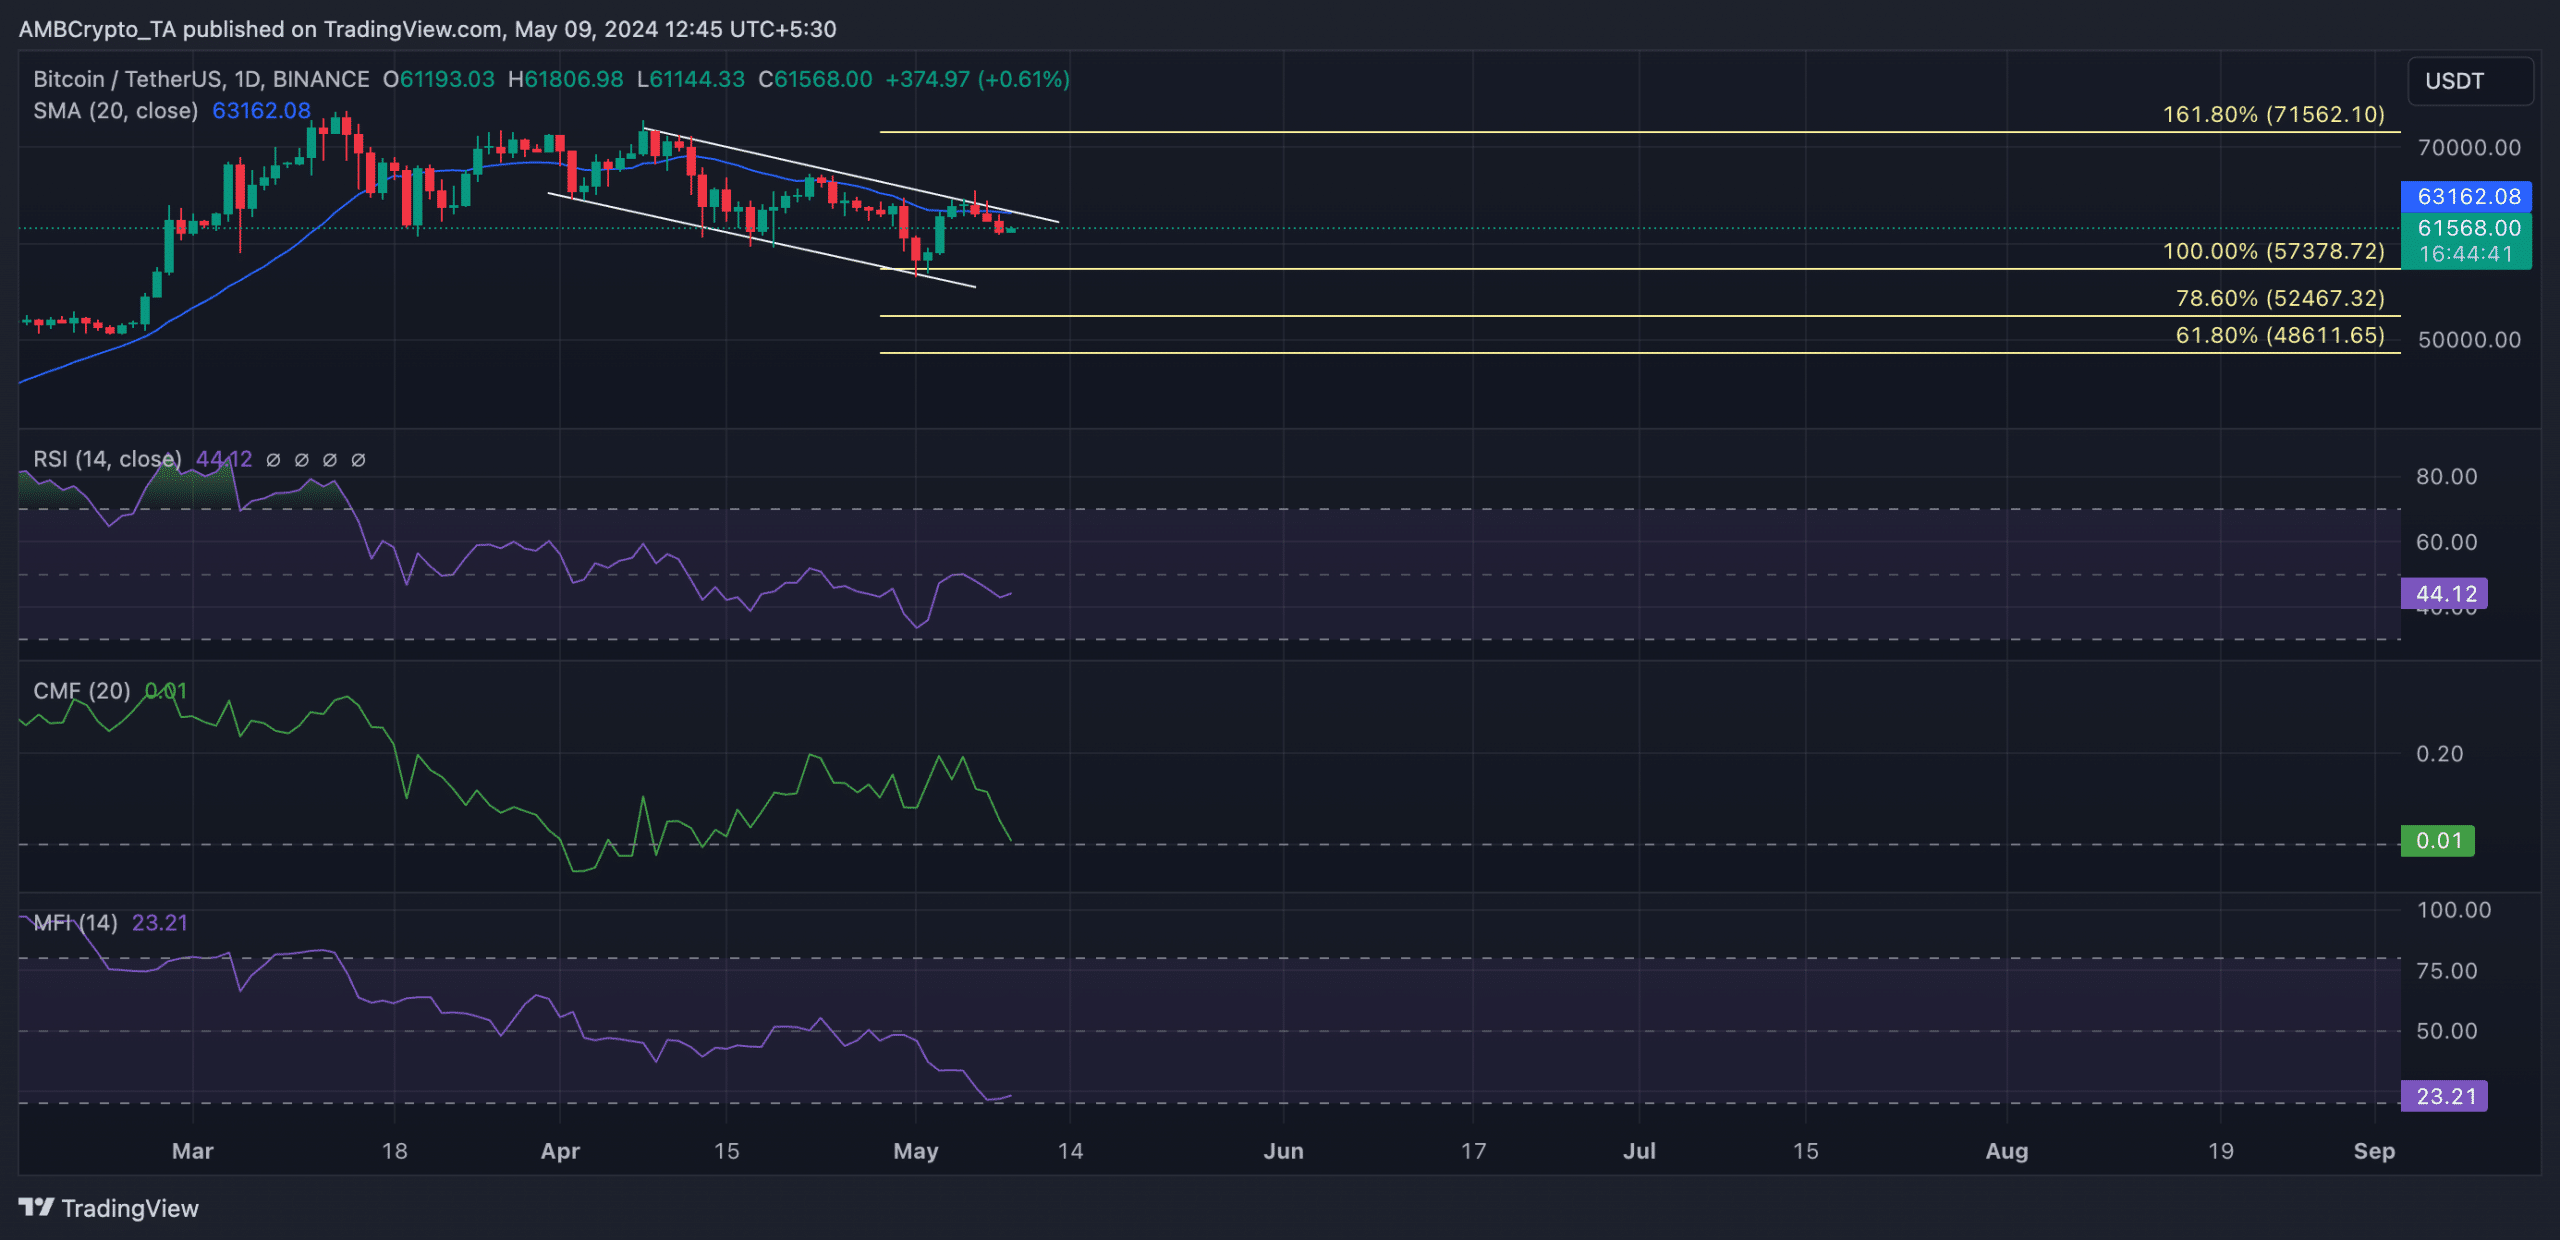
If the bears strengthen their position, they may pull the coin’s price down to the support line of BTC’s descending channel pattern.
Read Bitcoin’s [BTC] Price Prediction 2024-25
If this happens, the leading cryptocurrency asset will exchange hands at the $57,000 price region.
However, if this bearish projection is invalidated as bullish activity gains momentum, BTC’s price may rally toward the pattern’s resistance line and attempt a crossover.