Dogecoin
Dogecoin: Analyst predicts a 200% surge – Buy DOGE today?
Dogecoin’s potential 200% surge was supported by on-chain metrics. Will DOGE break its ATH?
- Dogecoin poised for a 200% surge, eyeing a breakout above $0.163.
- On-chain metrics indicator hints for a possible breakout.
Dogecoin [DOGE] price has been consolidating since early march in a descending triangle pattern until 20th May when it broke outside the ascending triangle resistance and retraced before surging upwards to $0.1748.
Dogecoin could set sights on a 200% price surge in the near future. This prediction was based on a social media post from Ali Martinez, a well know crypto trader and analyst.
Martinez believe that Dogecoin market sentiments are in the same dip levels as it was in early February shortly before a major price spike.
Do the metrics indicate a possible breakout?
AMBCrypto analyzed Santiment’s social volume and weighted sentiment. The market sentiments indicated that Dogecoin was bearish as it was in early March, just before an immense price surge, suggesting that a similar surge may be experienced in the near future.
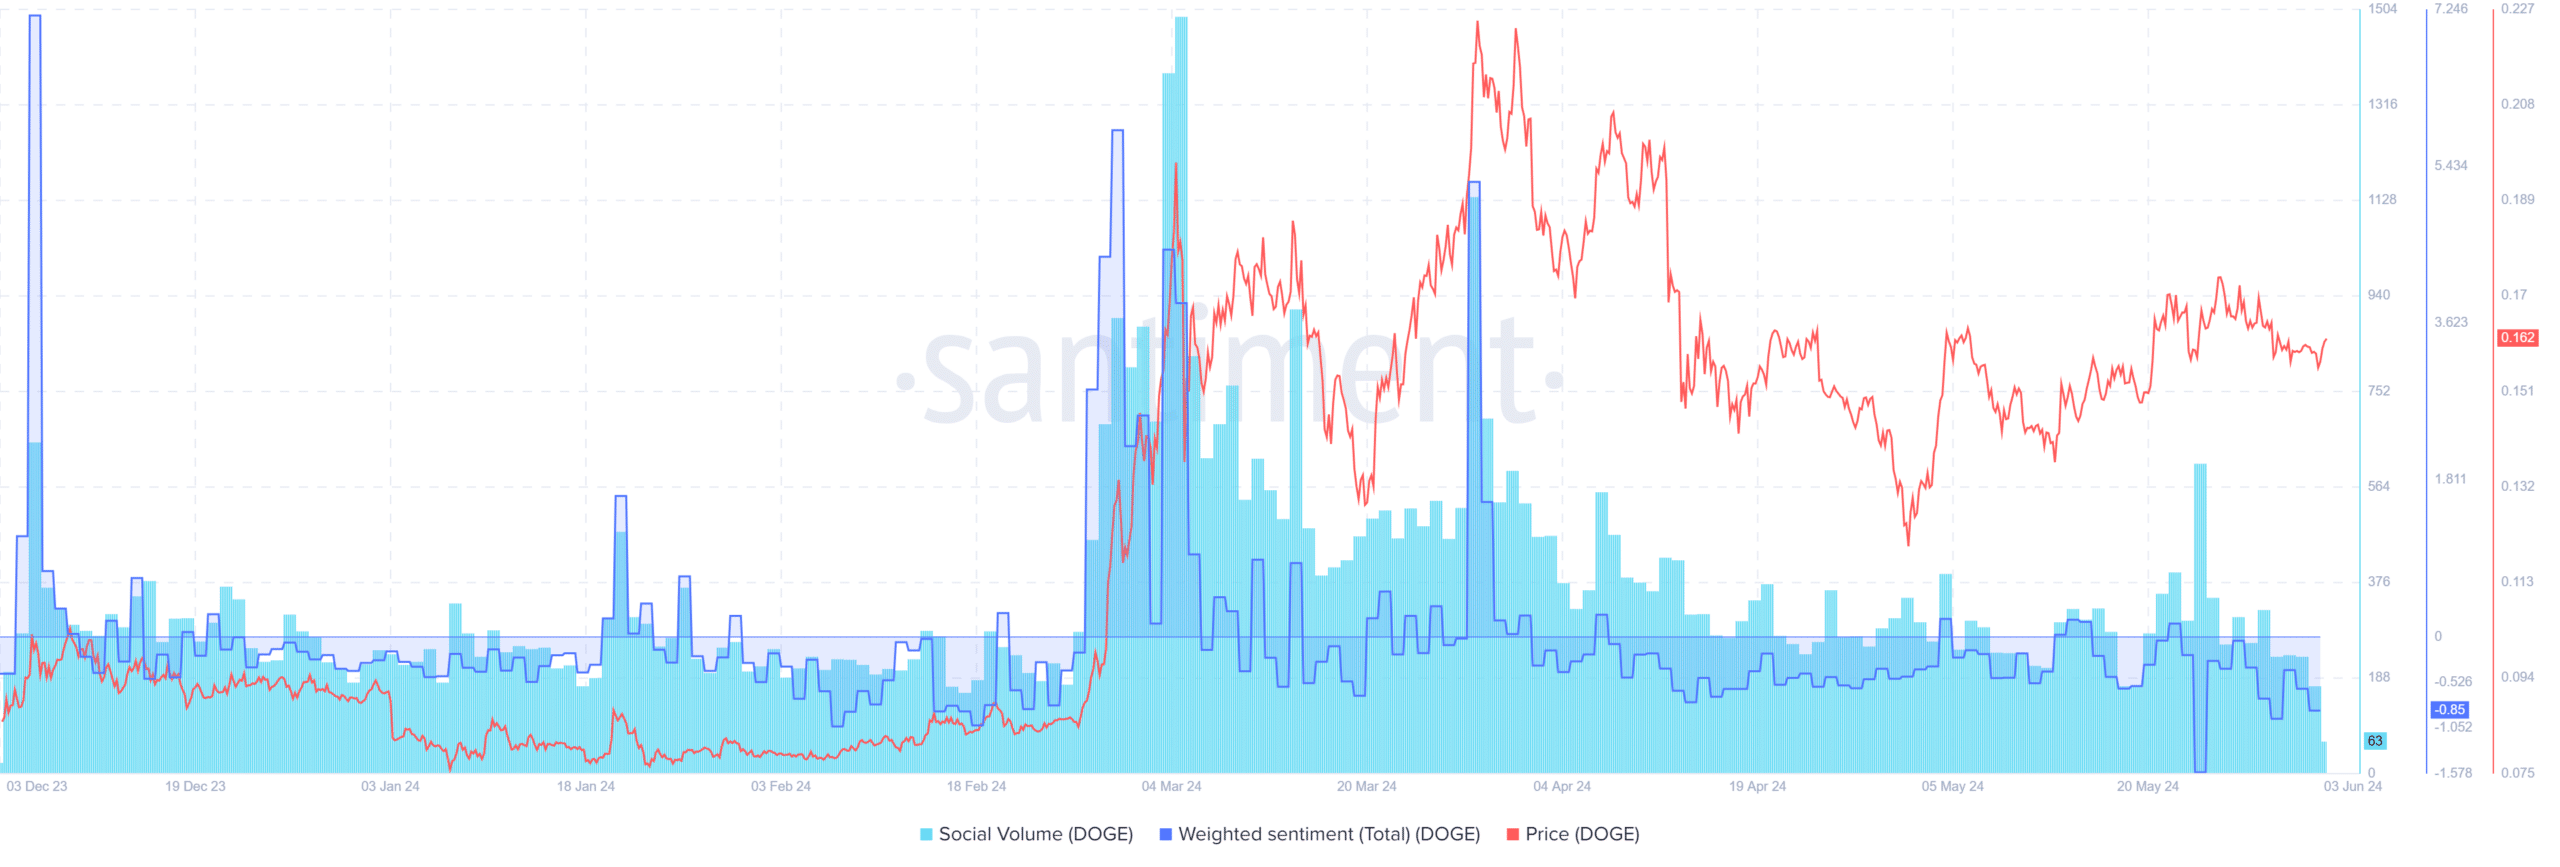
Source: Santiment
In early March, Dogecoin’s price surged to $0.18. The rise followed the approval of Bitcoin ETFs by SEC and the rise in BTC’s price.
As of this writing, according to coinmarketcap, Dogecoin’s price stands at $0.1612, a 1.82% increase in the 24 hours and a 2.25% decrease in the last seven days.
According to Martinez, Dogecoin whales have bought over 700 million Dogecoins in the past 72 hours,worth around $112 millions.
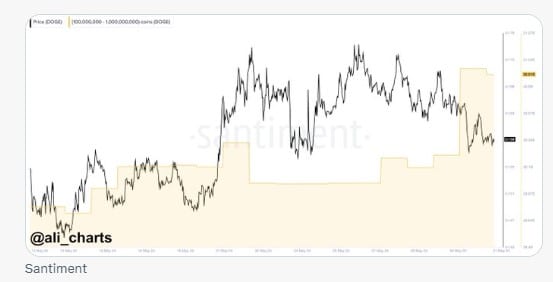
Source: x
AMBCrypto further analyzed the Long/ratio chart which induced several bullish spikes over the last 24 hours. This affirm that bulls are taking control over the market and accumulating a potent Bullish rally.
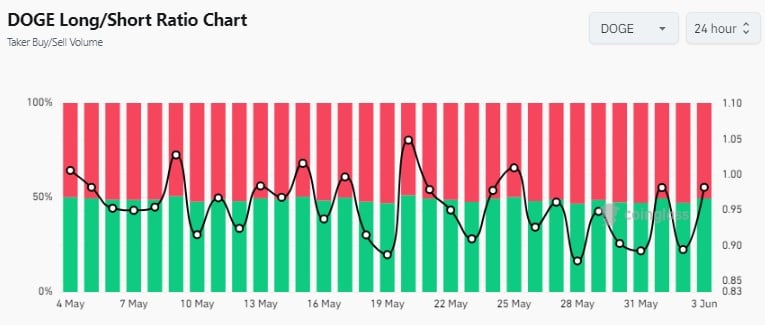
Source: Coinglass
Dogecoin’s price at press time was obeying a ascending trendline that has been rejected thrice over the past 14 days.
This indicate a possible bullish run to its all time high at around $0.1749, if the price manages to breakout from $0.16313 resistance level and close above.
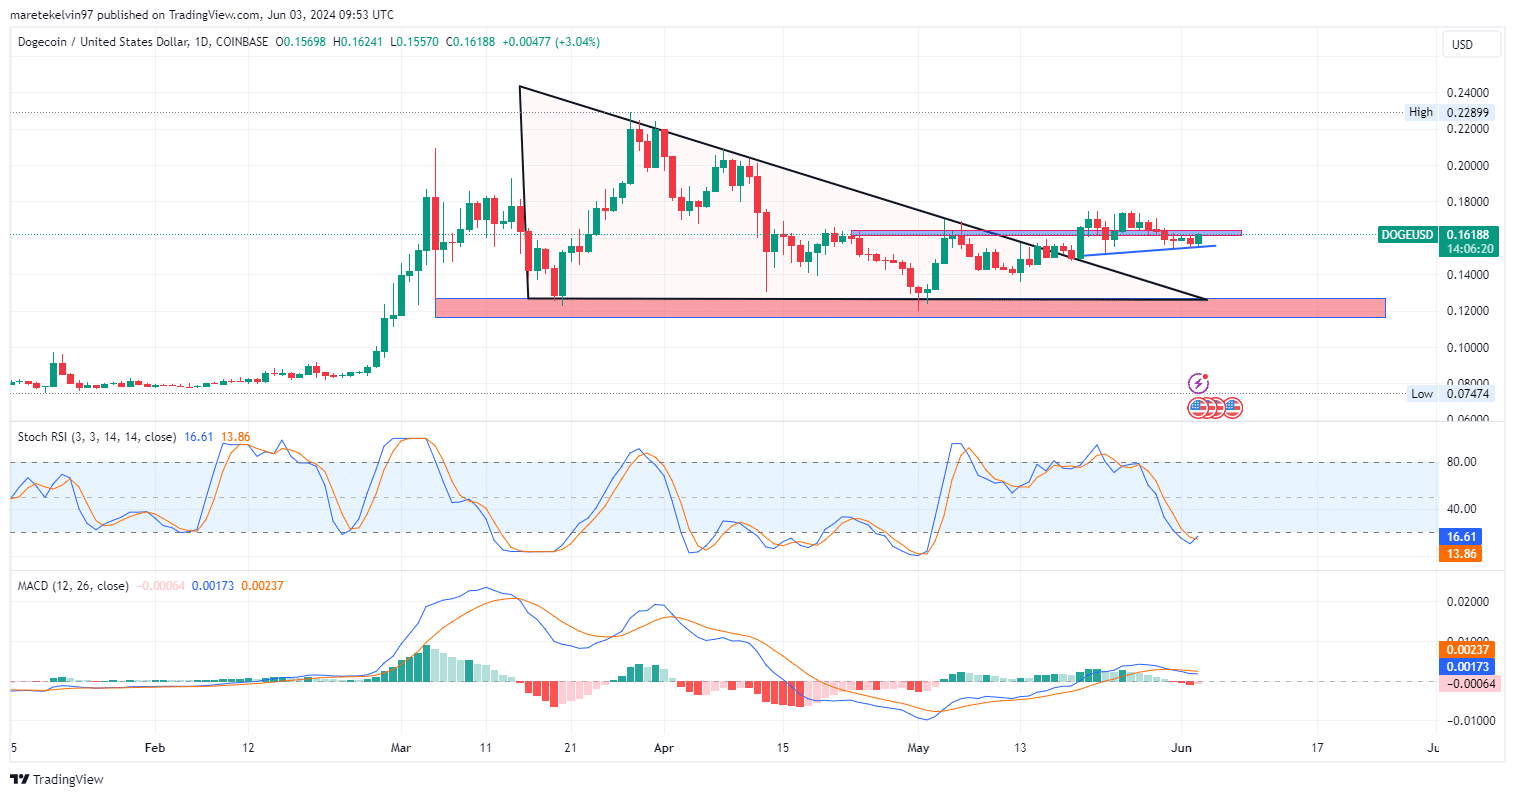
Stochastic RSI (16.61) indicate an oversold position in the market, hence a bullish correction is likely. The MACD charts a streak of bullish bars over the last two weeks.
The histogram bars indicate that the the deviation is skewed to the bulls side.
Is your portfolio green? Check the Dogecoin Profit Calculator
The most recent bearish histogram bars are diminishing as the MACD line crosses the signal line, indicating that a bullish momentum is likely to take over.
The market sentiments and a technical analysis align to the Ali martinez tweet on a possible 200% price surge.