Dogecoin, Apecoin, STEPN Price Analysis: 30 April

Dogecoin has been in a consolidation phase in the past few days, while STEPN and ApeCoin had a bullish outlook. Despite the bearishness in the crypto market in the past couple of days, GMT has managed to bounce from a region of technical importance.
Dogecoin (DOGE)
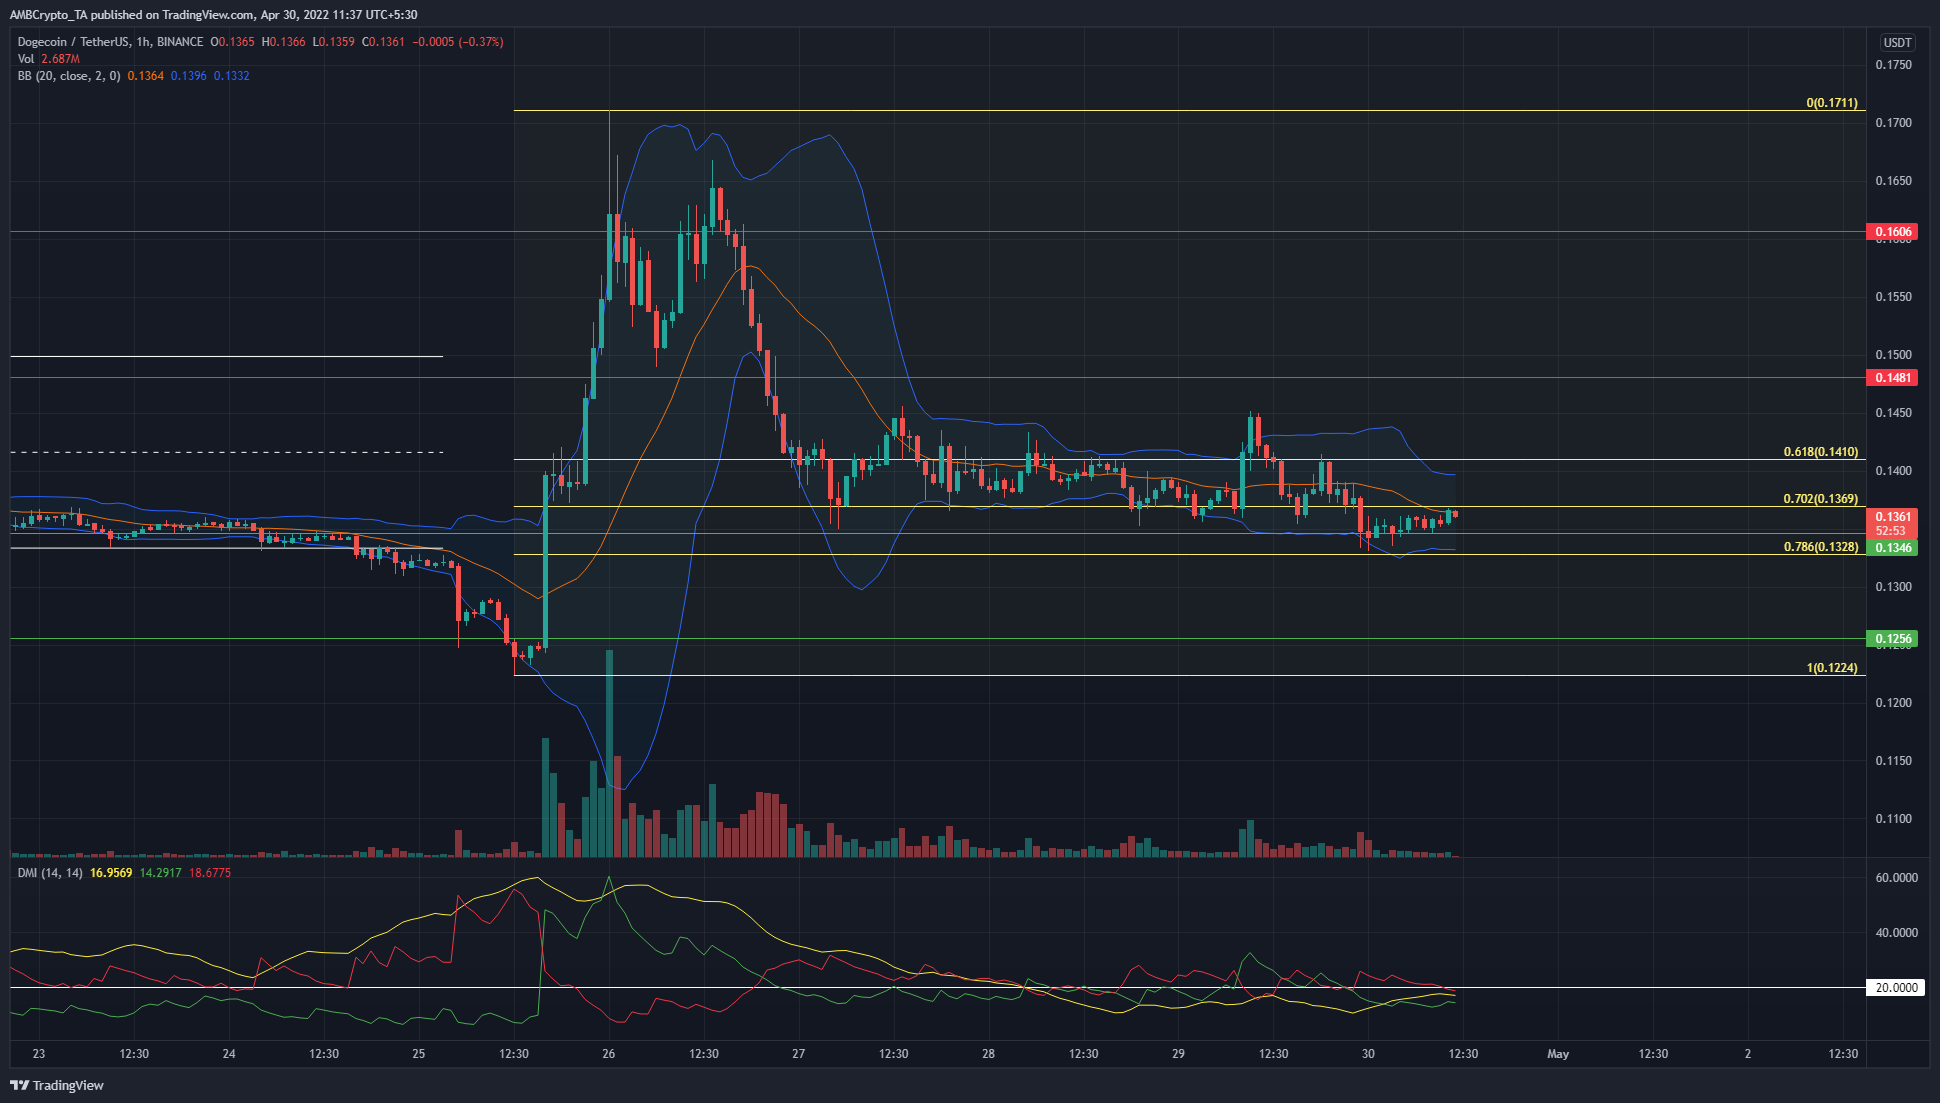
Based on DOGE’s surge from $0.122 to $0.171, a set of Fibonacci levels (yellow) was drawn. It showed the 61.8% and 78.6% retracement levels to be at $0.141 and $0.133 respectively. In the past few days, DOGE has been trading within these levels and has seen a bounce from the $0.134 support level as well.
The Directional Movement Index did not show a strong trend in progress, and all the lines were beneath the 20 mark. This further reinforced the idea of Dogecoin trading inside a consolidation phase. The Bollinger Bands were also tight around the price, to show reduced volatility.
ApeCoin (APE)
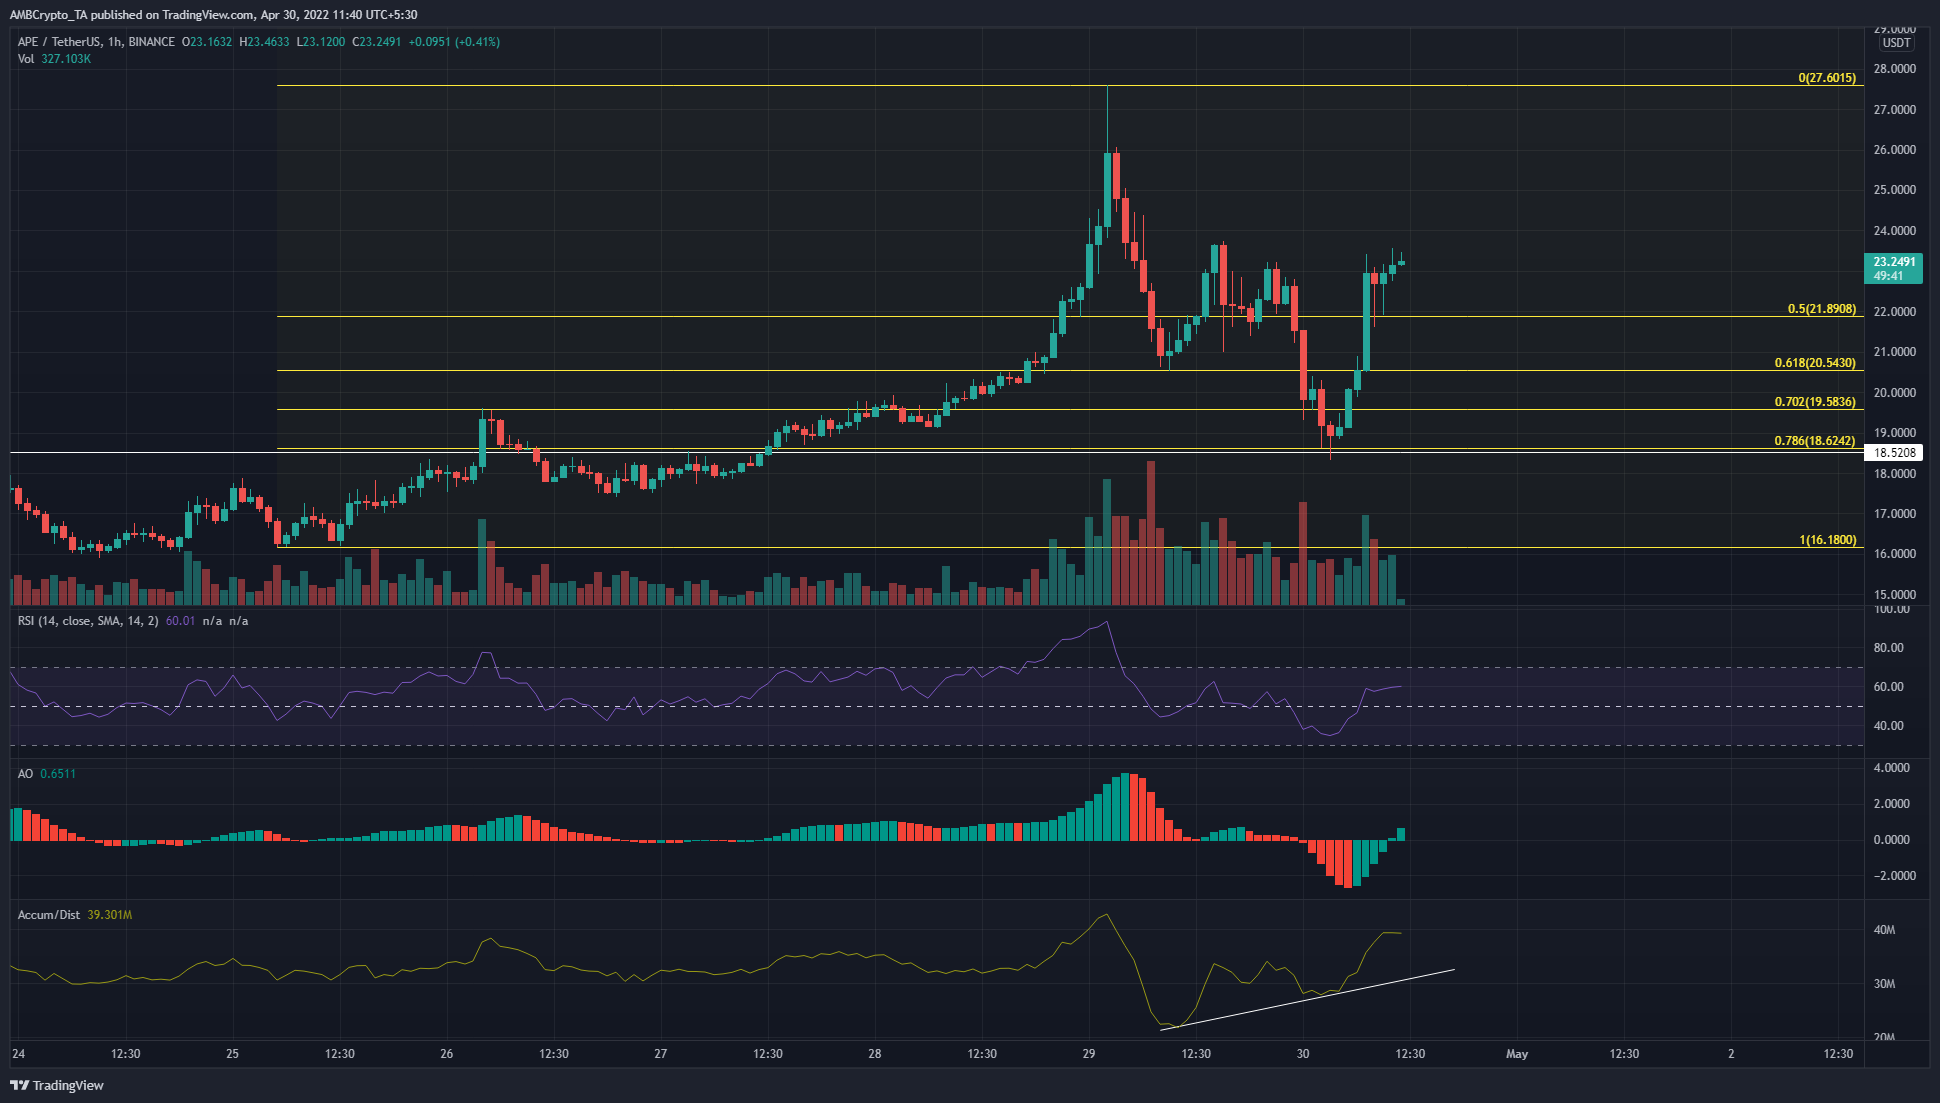
ApeCoin saw a deep pullback from the $27.6 highs. Once more, the Fibonacci retracement levels plotted showed that the price respected the 78.6% retracement level well. Moreover, $18.6 was a level that rejected APE last week and has now been retested as support.
The A/R line has been on an uptrend over the previous day, which suggested strong demand was behind APE’s rally from $19. The Awesome Oscillator climbed back above the zero line, to denote bullish momentum behind APE once more. The RSI moved back above neutral 50 as well, to indicate a shift in lower timeframe momentum.
STEPN (GMT)
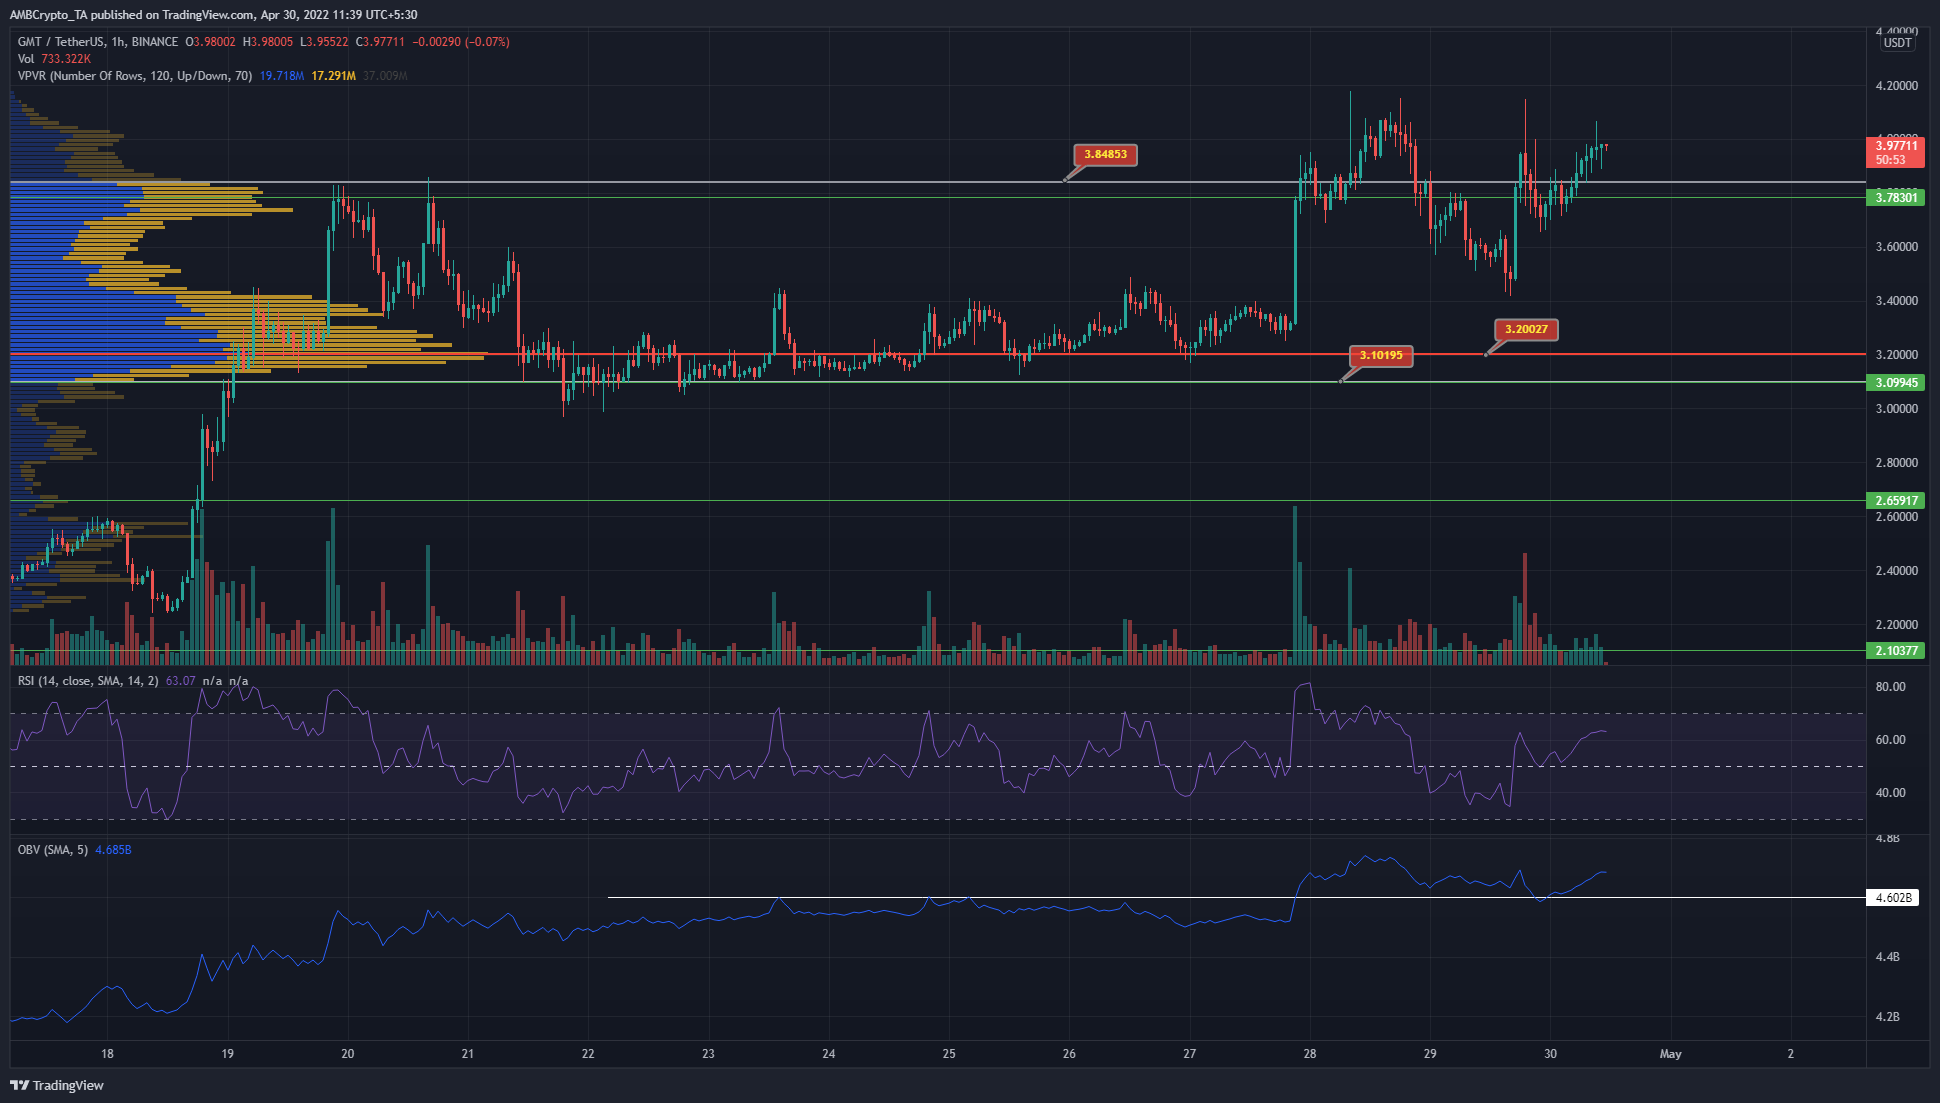
GMT has been on a spaceship in the past few weeks, as far as price action is concerned. At the time of writing, it appeared that the pullback to $3.4 was simply a pullback and not the beginning of a downtrend.
The VPVR tool showed that the Point Of Control and the Value Area Highs lay at $3.2 and $3.84 respectively. At the time of writing, GMT was trading at $3.97 and would need to fall below $3.09 to suggest a bearish bias.
The OBV bounced from a former resistance, which was a bullish development. This suggested the bulls could push prices higher. The RSI also tested neutral 50 as support and climbed higher to show rising bullish momentum.


