Dogecoin, ETC, Fantom Price Analysis: 23 March

With Bitcoin closing in above the $42,000-mark, Dogecoin witnessed a jump above its 4-hour 20/50 EMA. But the bulls still needed to ramp up the money inflows into the crypto to maintain its ongoing comeback.
Moreover, Ethereum Classic hit its four-month high on 23 March while now displaying overbought signals on its technicals. Similarly, Fantom’s technicals also favored the buyers but depicted a weak directional trend.
Dogecoin (DOGE)
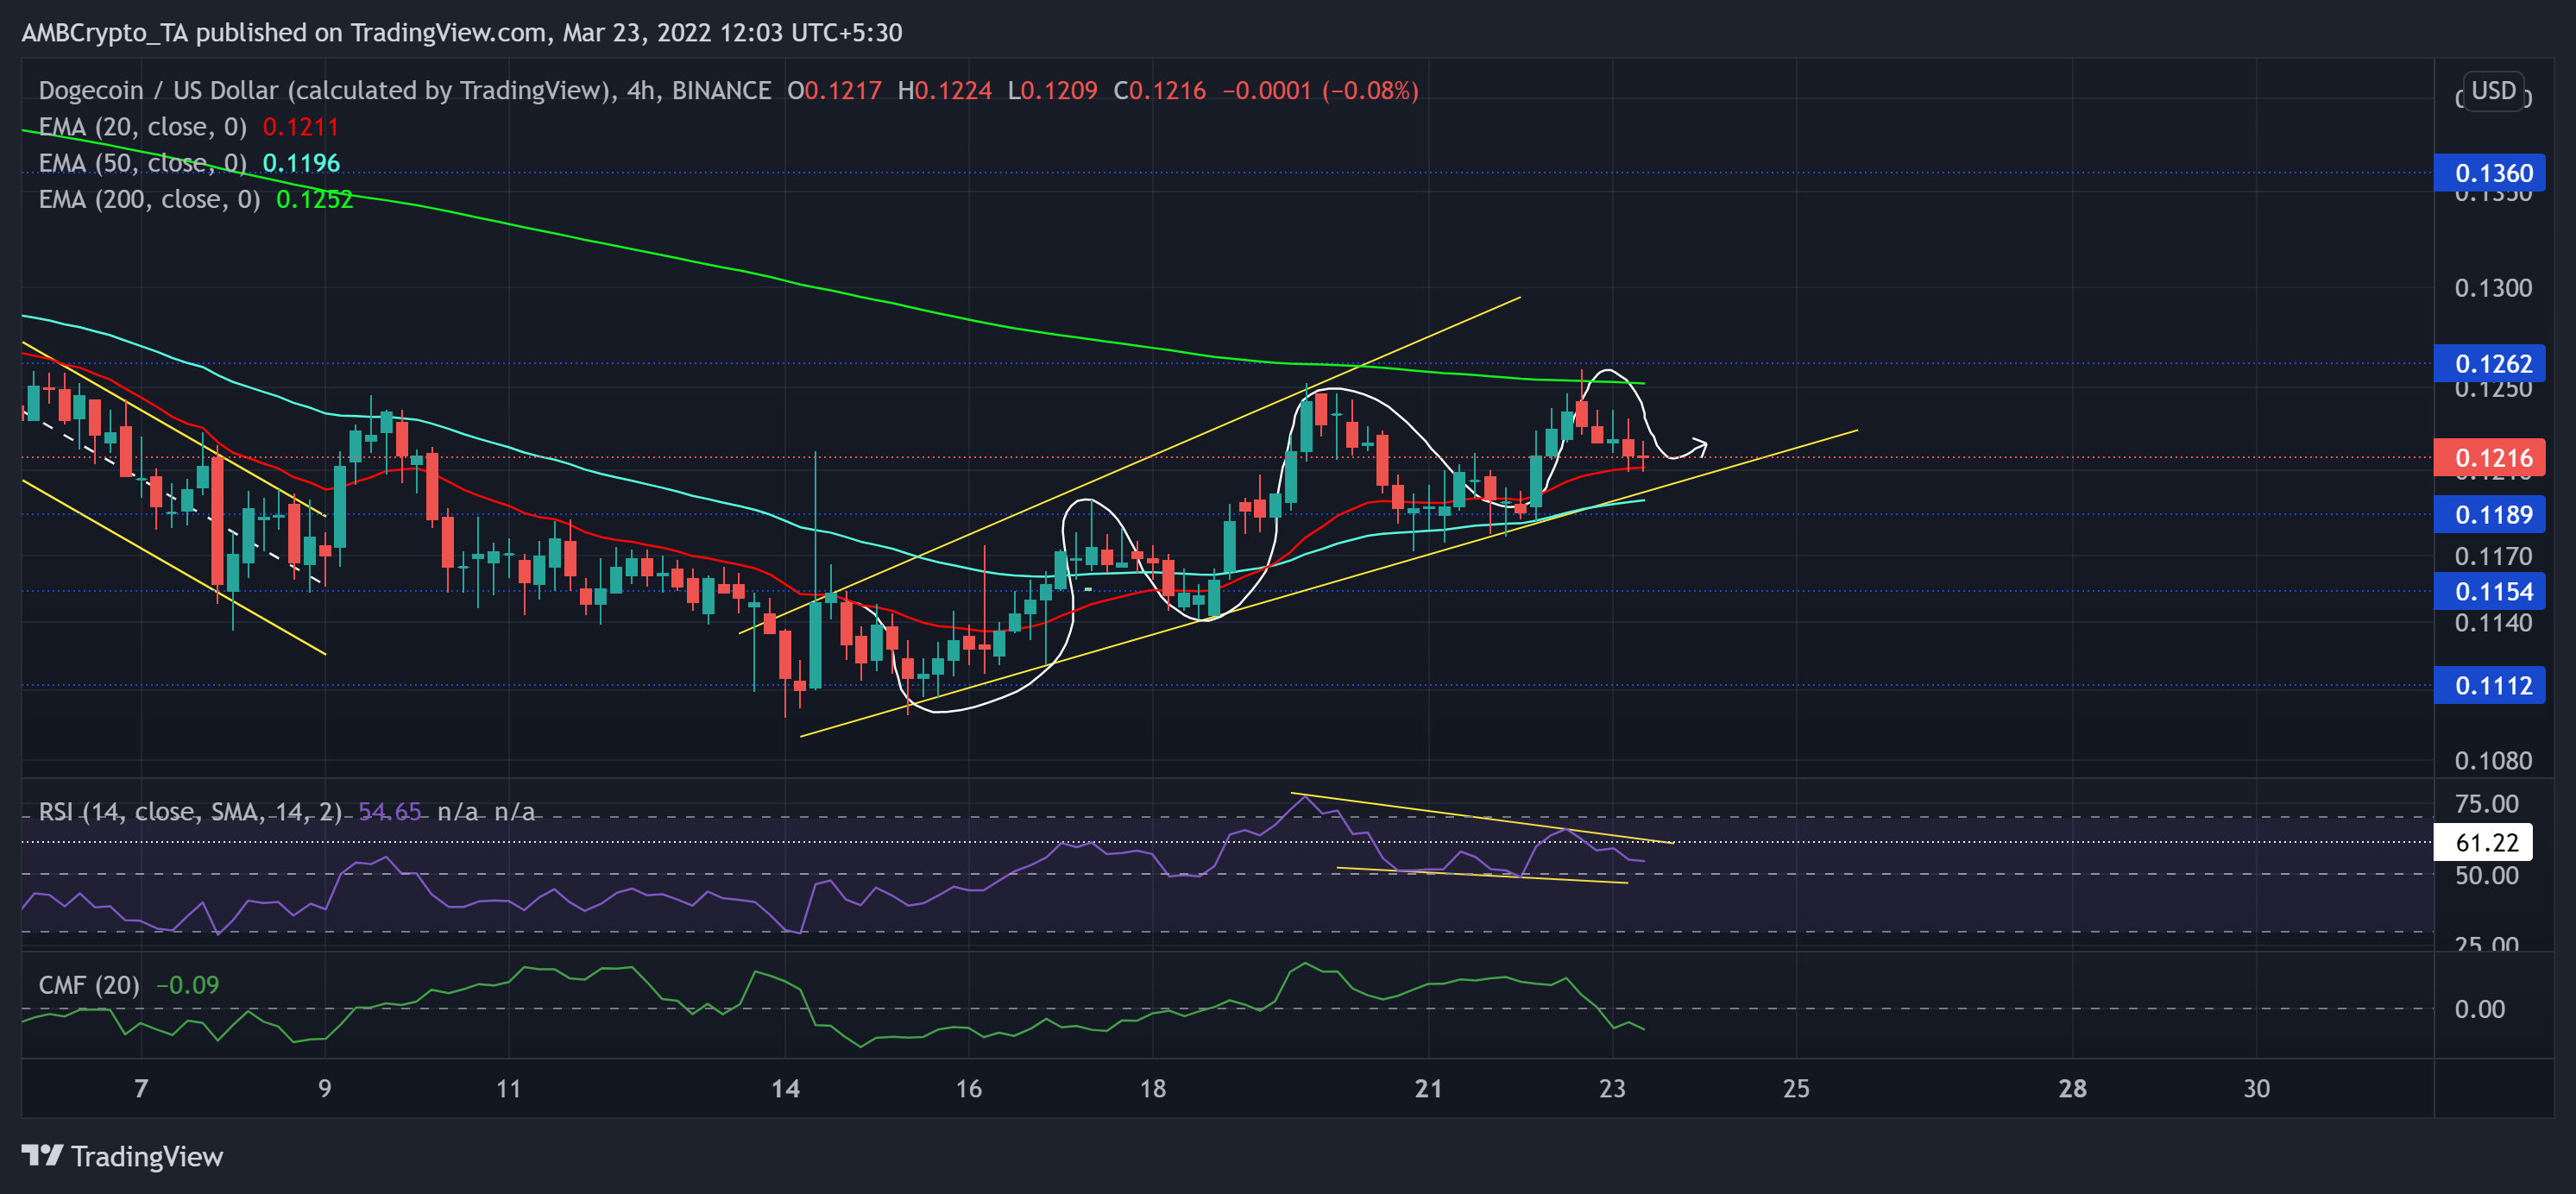
After nosediving to match its February lows, DOGE recovered in an ascending broadening wedge (yellow) on its 4-hour chart. The alt saw a nearly 15% ROI during this recovery week while facing resistance at the $0.1262-mark.
Its recent rally was shunned by the 200 EMA (green) while the bulls endeavored to maintain the 50 EMA (cyan) support intact. Now, the $0.12-zone continued to offer strong resistance.
At press time, DOGE traded at $0.1216. The RSI continued its gradual retracement from the overbought mark while maintaining the mid-line support. From here on, a possible recovery eyed to test the 61-mark before a retest of its equilibrium. Meanwhile, the CMF sharply fell below the zero-line and revealed the decreasing money volumes into the crypto.
Ethereum Classic (ETC)
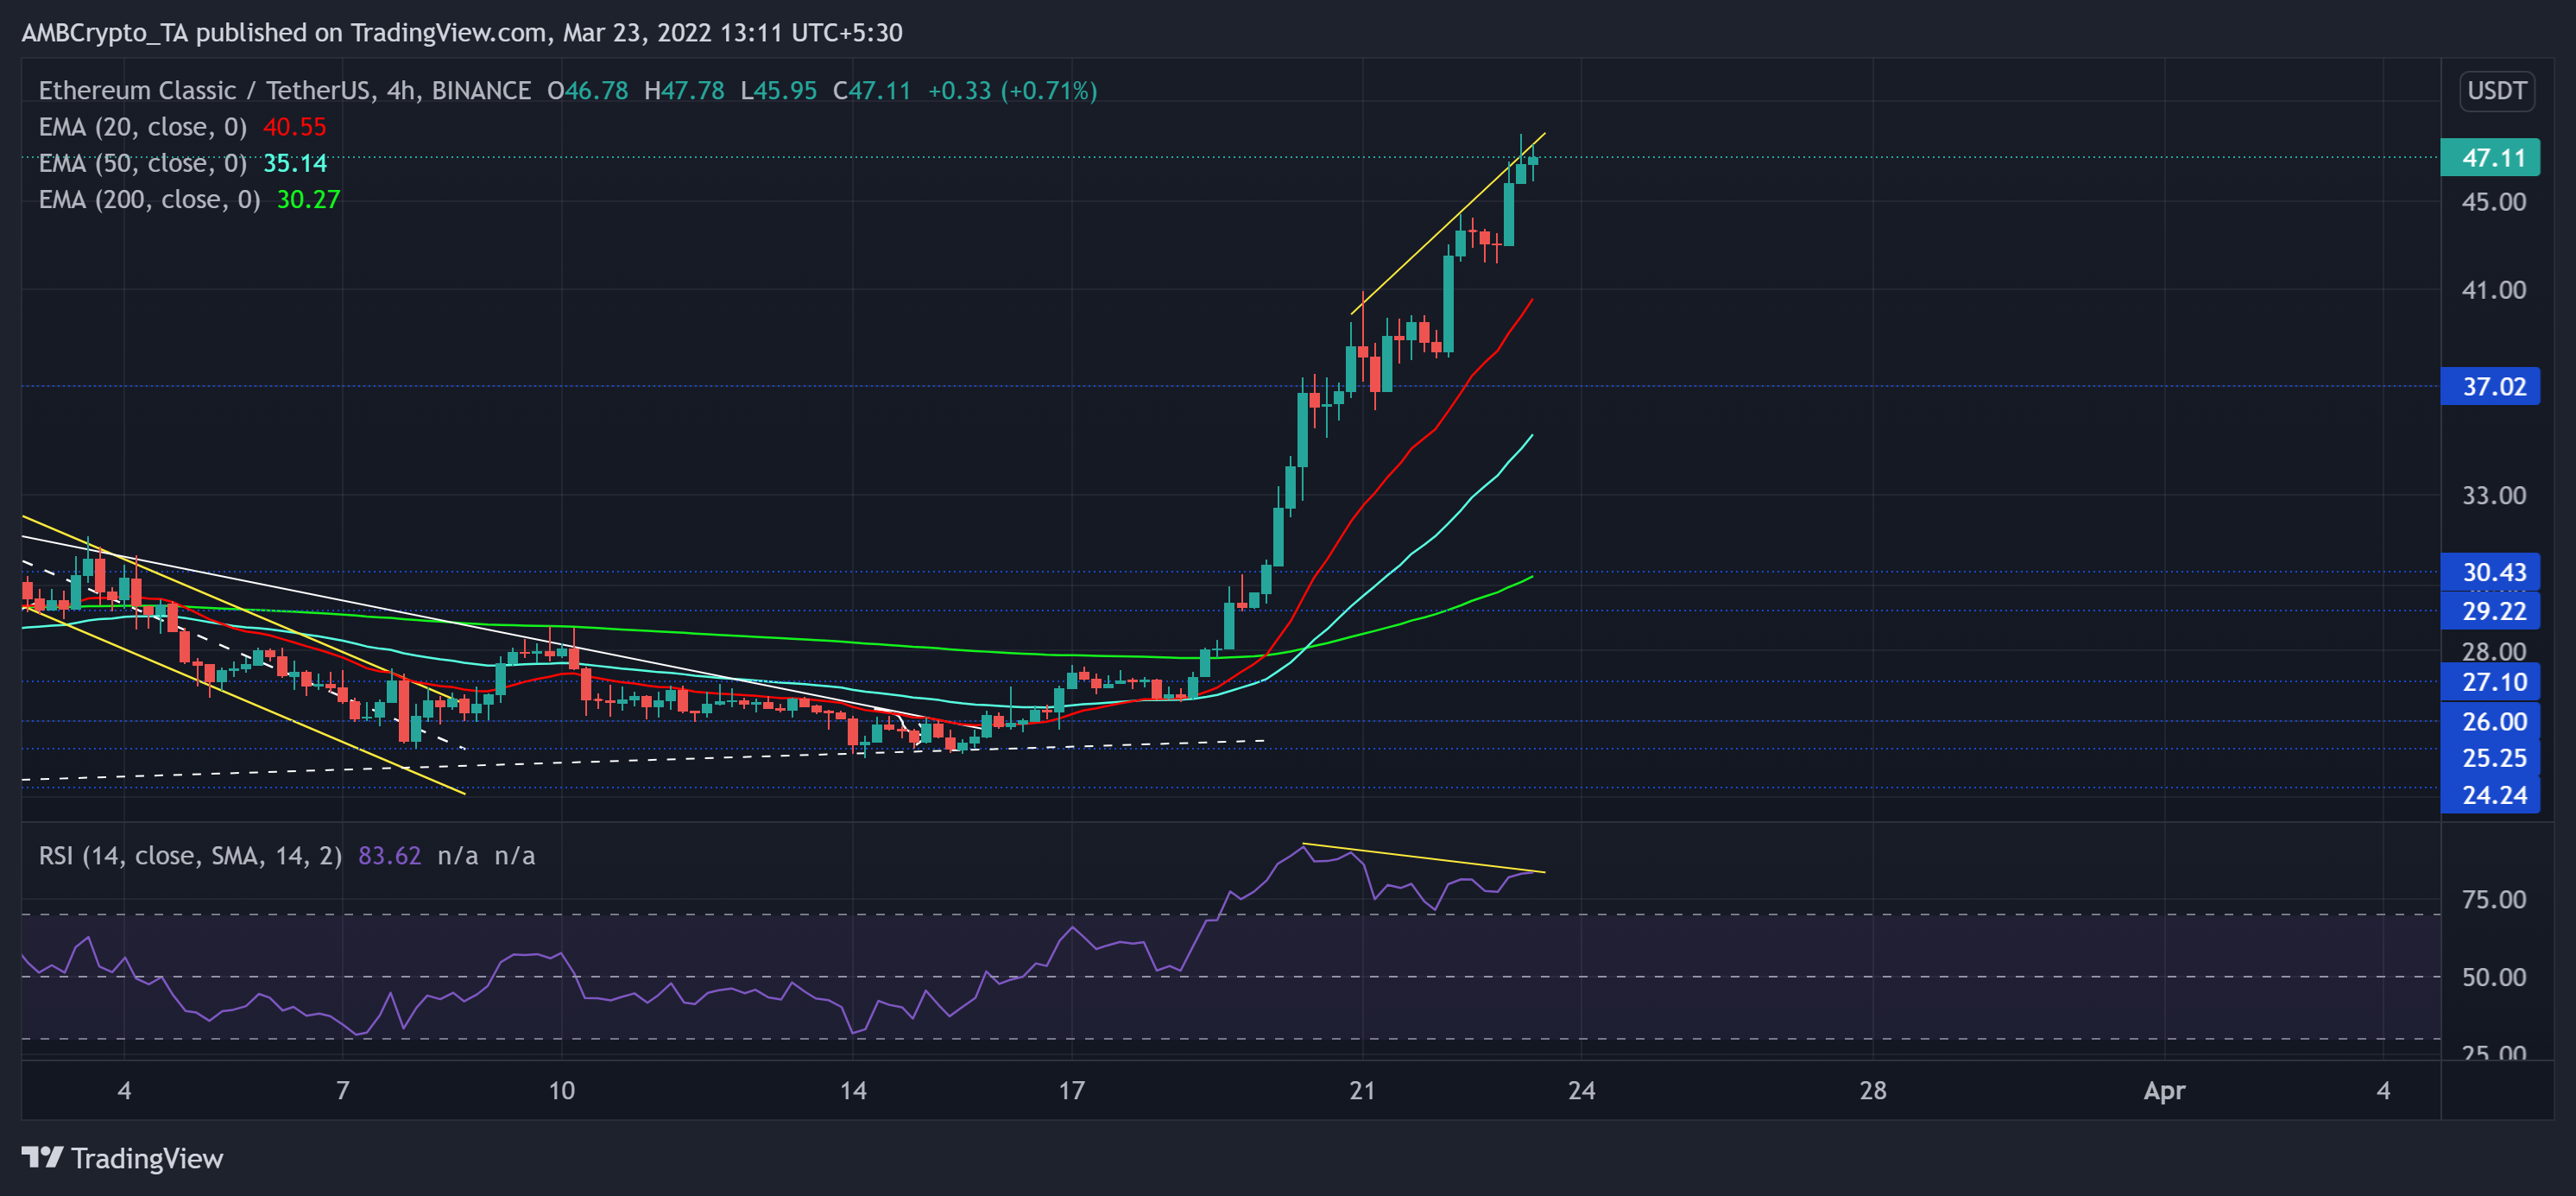
As the sell-off phase initiated, ETC lost more than a third of its value (from 11 February high) and touched its one-month low on 24 February. Since then, the altcoin has been on a roll as it saw a staggering 86.85% ROI in just the past week.
After entering into price discovery, ETC jumped above its 20/50/200 EMA and flashed a one-sided bullish momentum. Consequently, it touched its four-month high on 23 March.
At press time, ETC traded at $47.11. The RSI was deep into the overbought region while displaying a strong bullish bias. Over the past three days, it formed a bearish divergence with the price. This trajectory could stall the current rally in the near term.
Fantom (FTM)
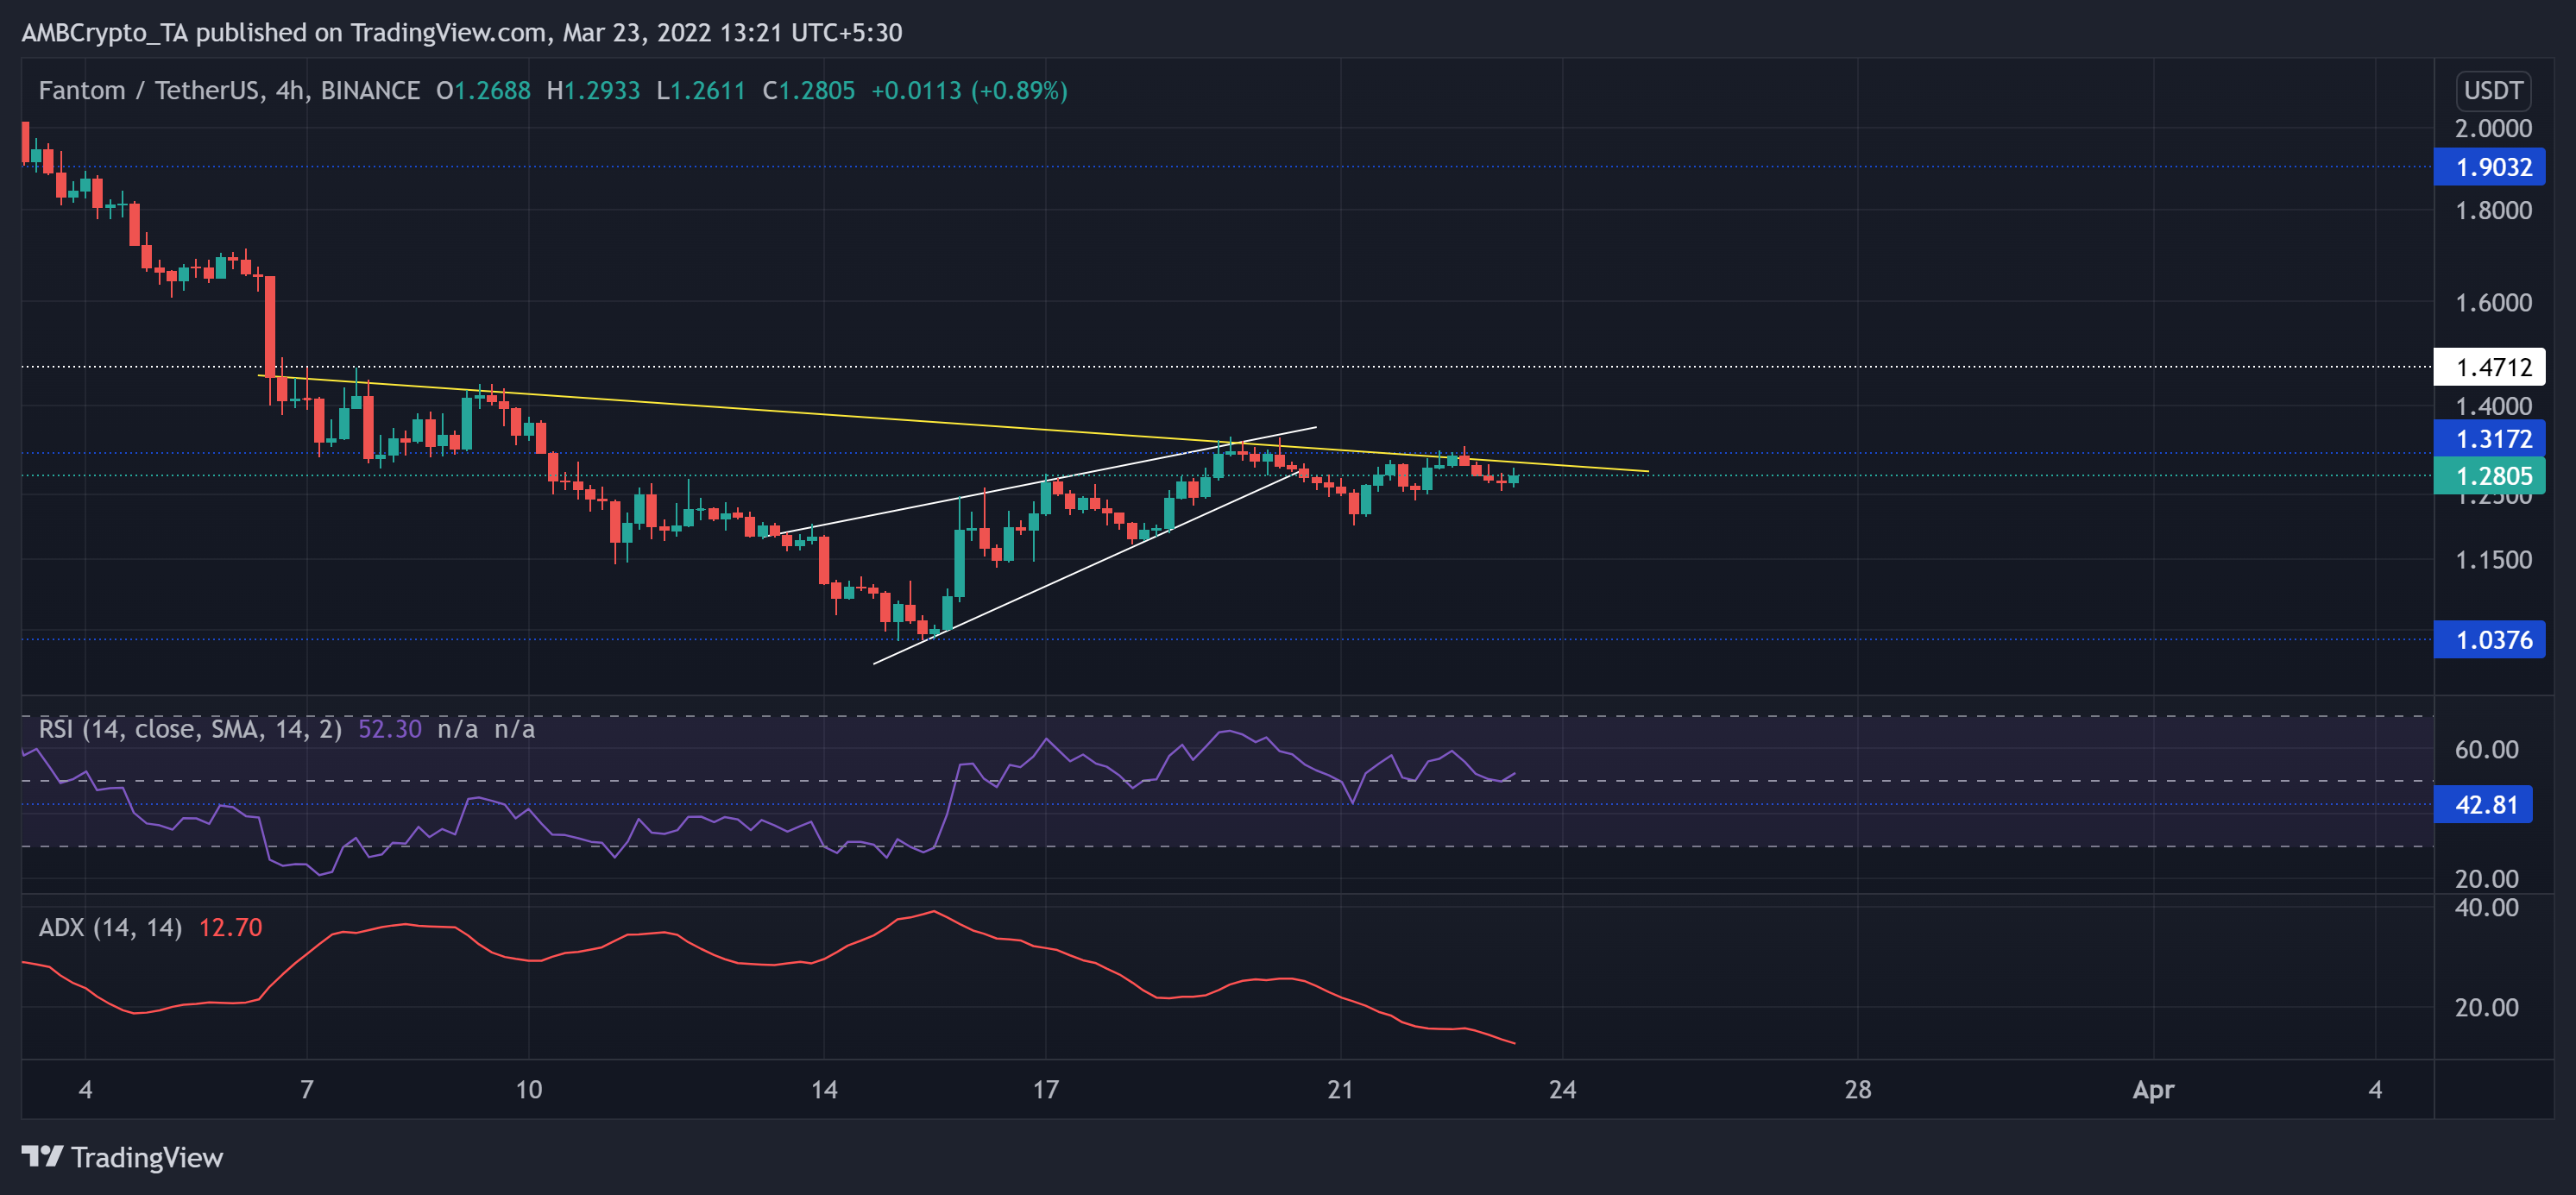
Since FTM lost the $1.9-level, the bulls have not been able to find an unrestrained rally. Consequently, it lost nearly 70% of its value (since 17 January) and hit its six-month low on 15 March.
While maintaining the $1-mark, FTM kept marking lower peaks until it flipped the critical $1.3-mark from support to immediate resistance. A close above the trendline resistance (yellow) would reignite the chances of breaking above the $1.3-level.
At press time, FTM was trading at $1.28. The RSI saw a sturdy recovery from the 42-support. It now displayed a bullish edge and even reclaimed the mid-line support. Nevertheless, the ADX depicted a substantially weak directional trend for FTM.


