Dogecoin, ETC, Monero Price Analysis: 29 March

After Bitcoin flipped its 4-hour 20 EMA from resistance to immediate support, Dogecoin revealed a bullish edge on its near-term technicals. The alt along with Monero also saw a rising wedge (reversal pattern) on its 4-hour chart.
Further, Ethereum classic also affirmed a bullish edge while moving near its liquidity range.
Dogecoin (DOGE)
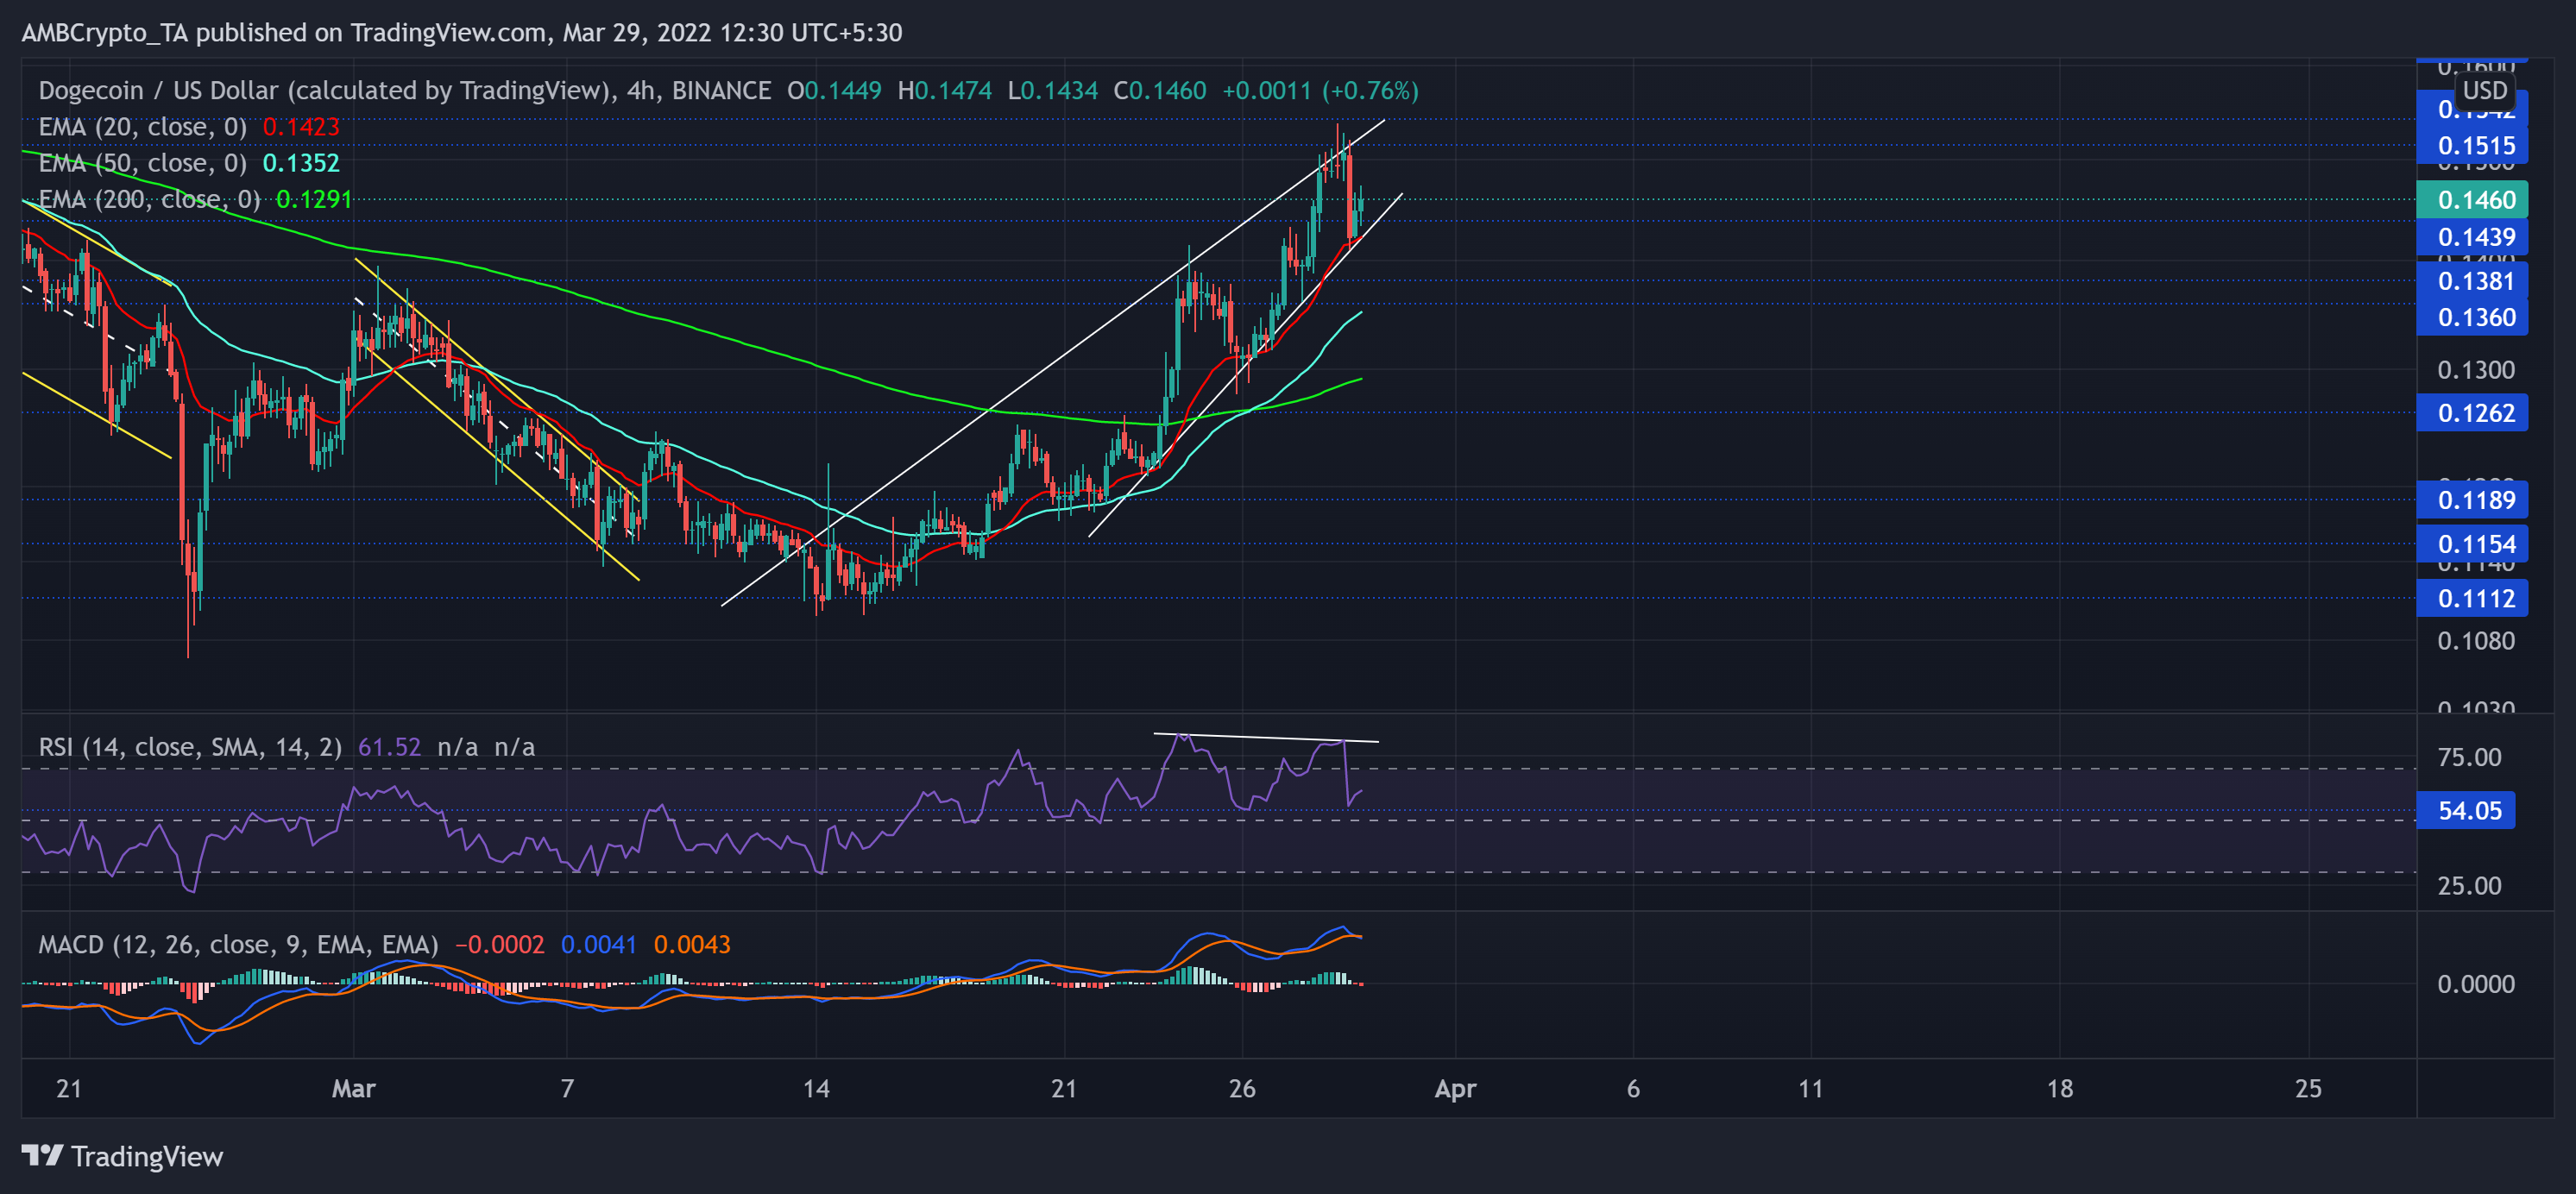
After losing the $0.16-mark to test its long-term $0.11 floor, DOGE recovered between two converging lines (white) on its 4-hour chart. The alt saw a nearly 32.8% ROI in the last 14 days while it reclaimed the vital $0.14-support.
The recent rally pushed DOGE above the 20/50/200 EMA as the bulls turned the tide in their favor. Now, the long-term trendline resistance at the $0.15-mark stood sturdy.
At press time, DOGE traded at $0.146. The RSI kept testing the overbought mark while maintaining the 54-support. If DOGE reverses from the $0.15-level, it would affirm a bearish divergence with the RSI. Meanwhile, the MACD lines saw a bearish crossover while its histogram plunged below the zero-line. This trajectory could propel a fall towards its 20 EMA support.
Ethereum Classic (ETC)
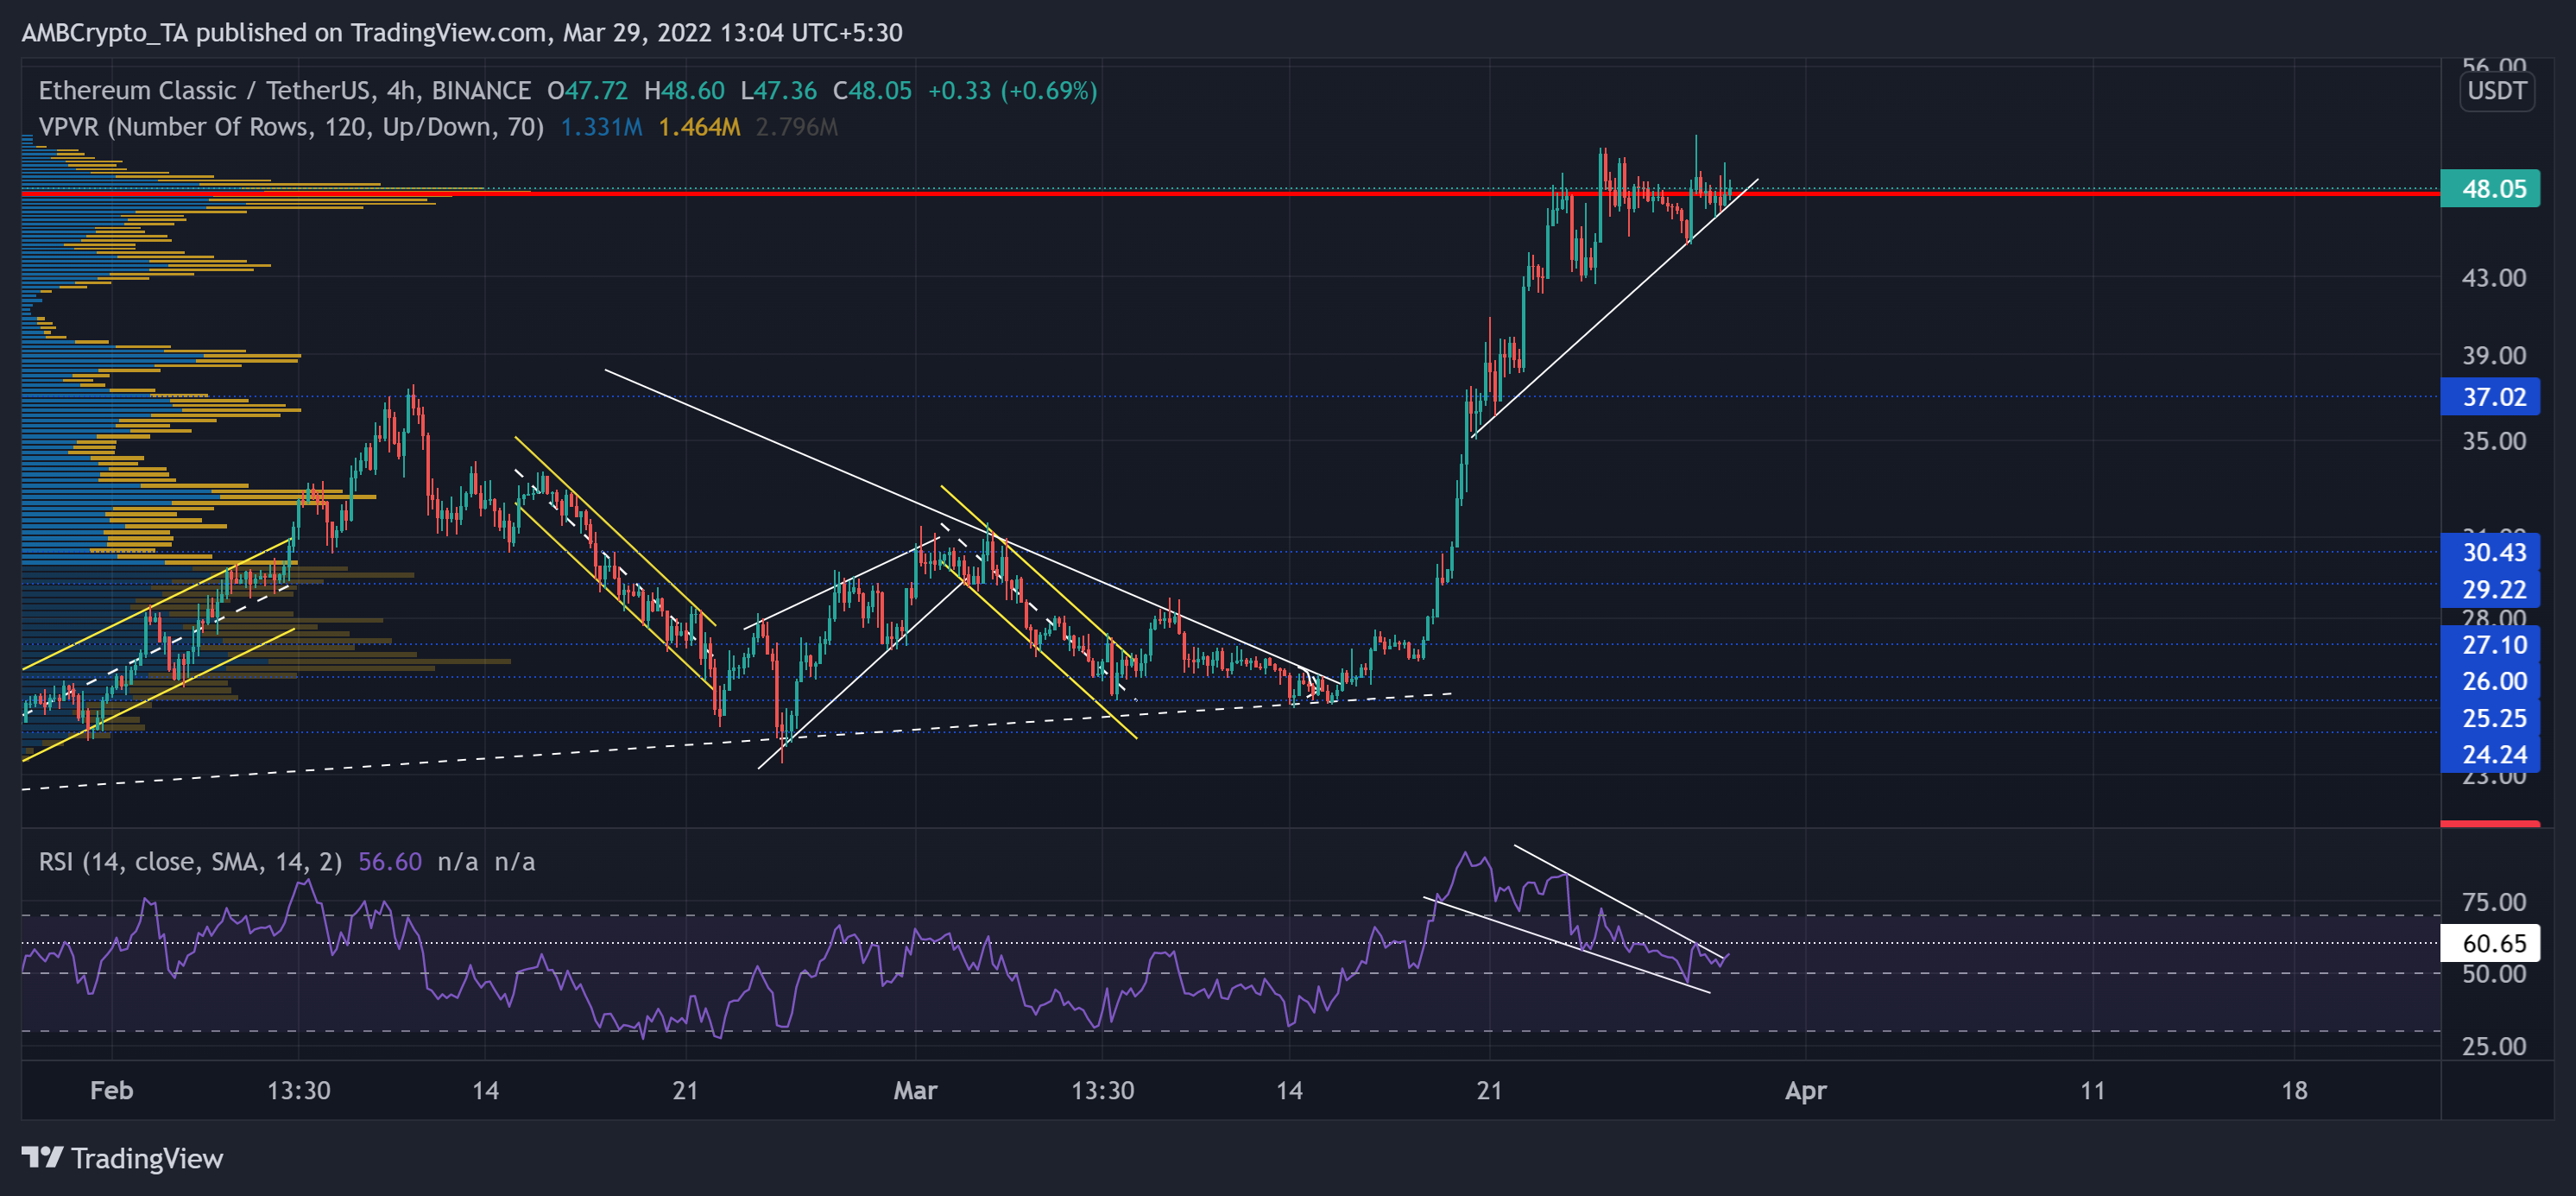
ETC lost more than 70% of its value from its September highs and touched its nine-month low on 22 January. Since then, the altcoin saw an aggressive 91.9% recovery in the last two weeks.
As a result, it touched its four-month high on 29 March. After breaking above the $37-mark, ETC jumped towards its Point of Control (red).
At press time, ETC traded at $48.05. The bullish RSI declined between a falling wedge. But the bulls ensured the mid-line support. Thus, it saw a patterned breakout that aimed to challenge the 60 mark.
Monero (XMR)
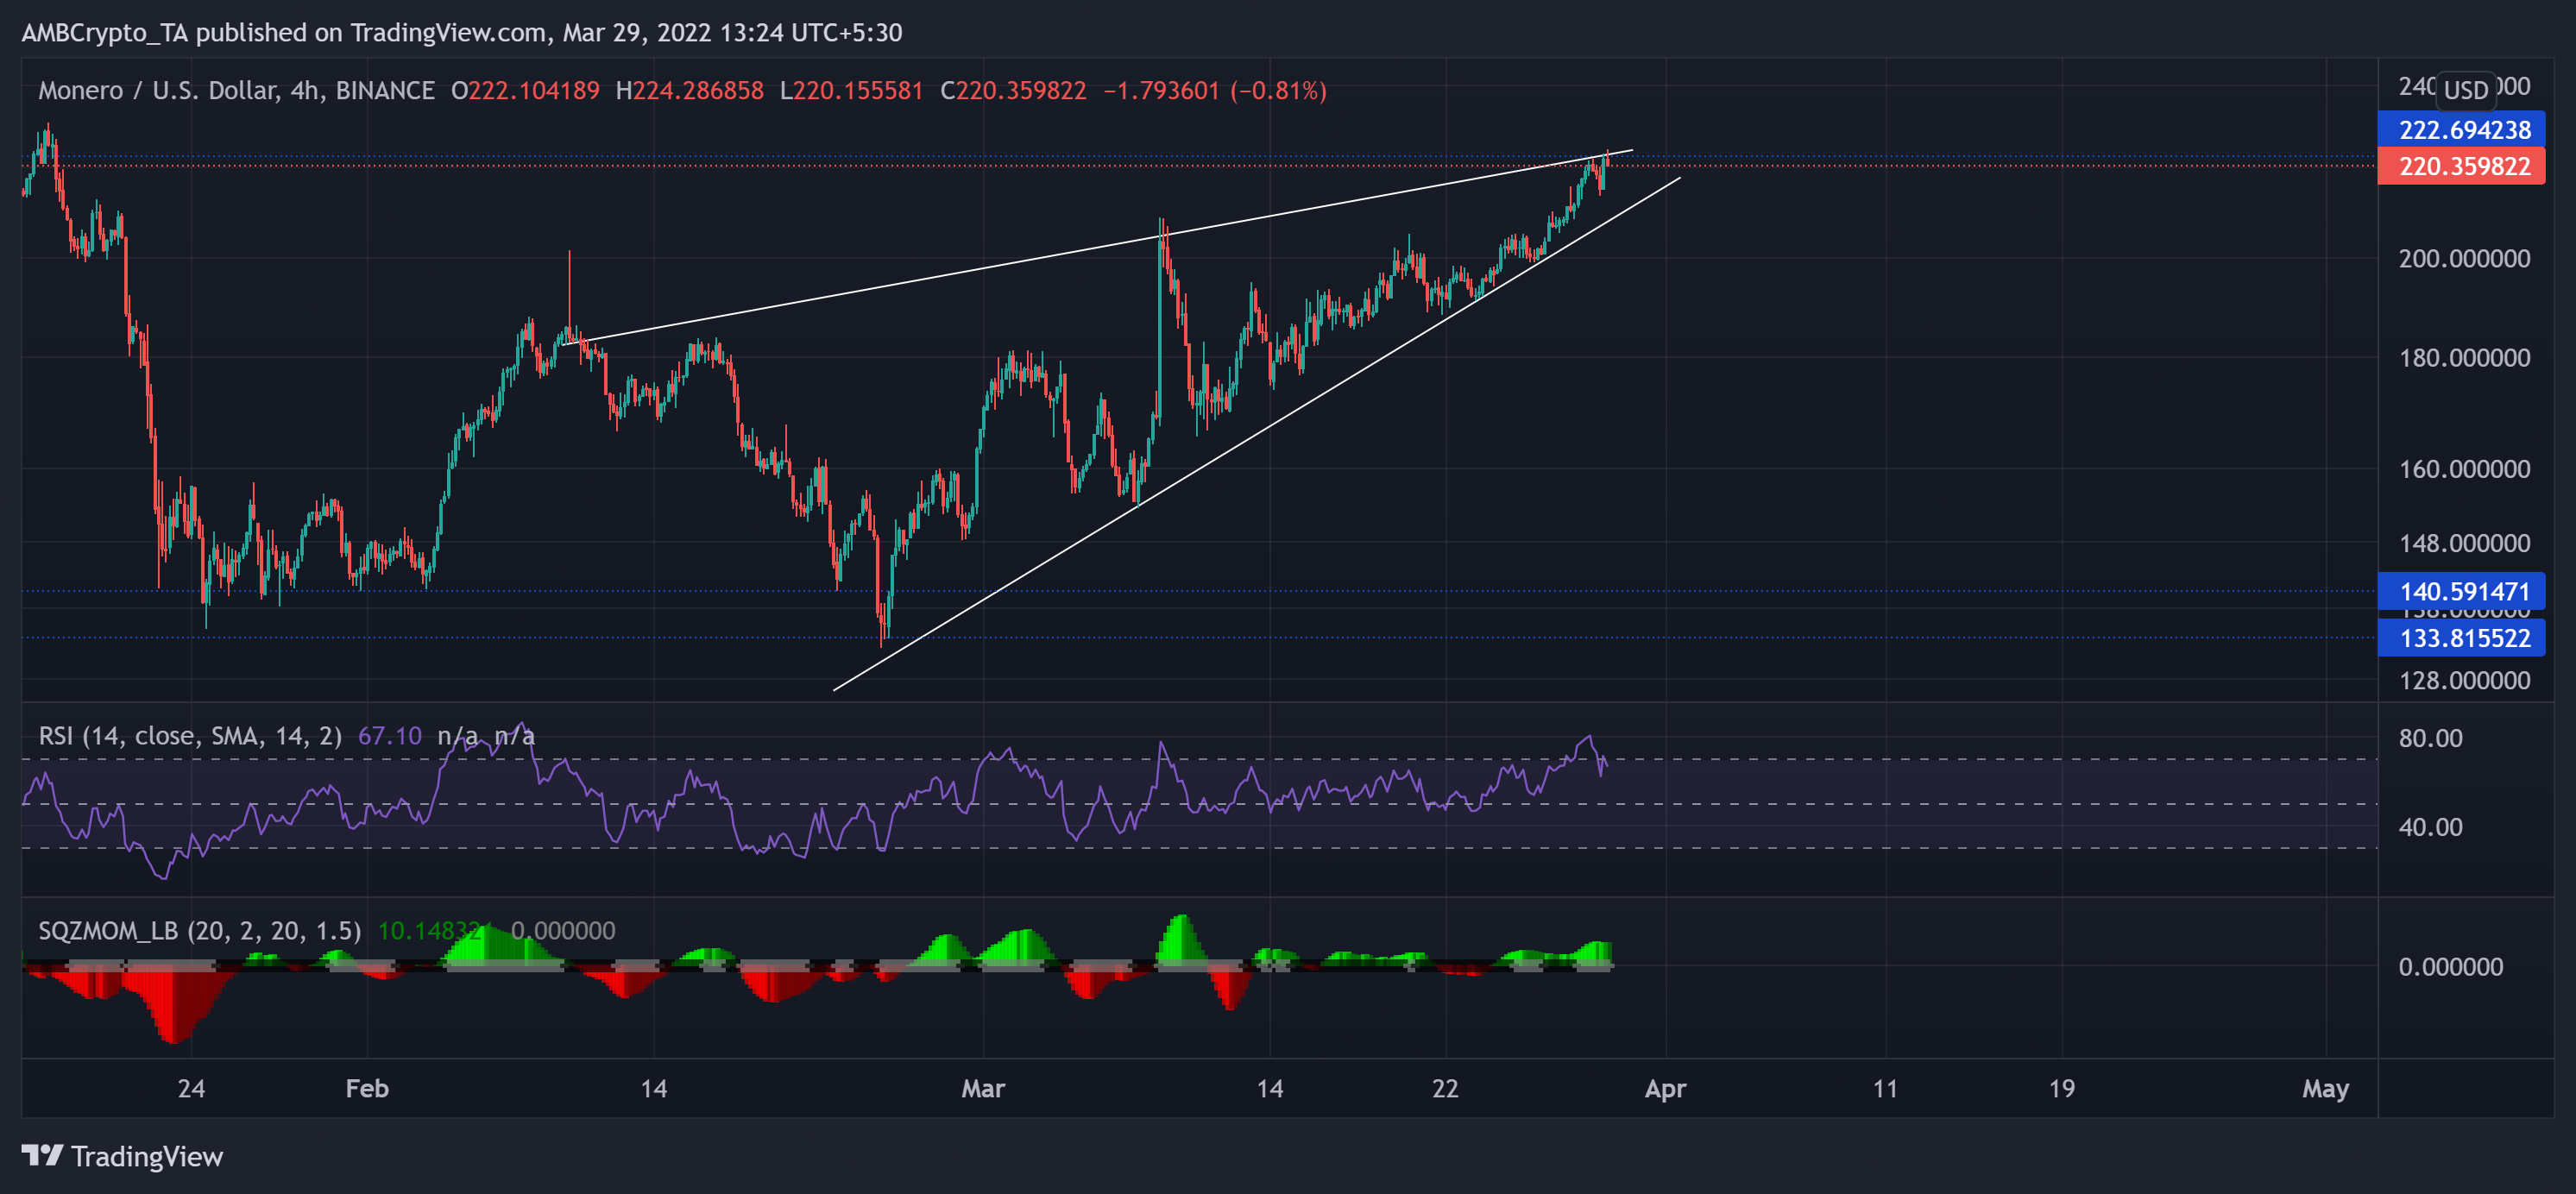
XMR fueled its bearish inclination after struggling to overturn the $296-mark resistance. Since then, the price action kept dropping below vital price points, and the alt lost more than half its value from its November highs.
Since poking its 13-month low on 24 February, XMR recovered by nearly 70% towards its long-term $222-mark resistance. Meanwhile, it saw a rising wedge on its 4-hour chart.
At press time, the alt traded at $220.359. The RSI continued its gradual growth and moved near the overbought territory. A potential reversal from here should not surprise the investors/traders. Also, the Squeeze Momentum Indicator flashed grey dots on its readings. This reading entailed a high volatility phase in the near term.


