Dogecoin, Ethereum Classic, SAND Price Analysis: 20 November

After a challenging week for the bulls, they seemingly resurged as most cryptos traded in green over the last day. While the market gasped on 18 November, SAND registered double-digit gains to strike its ATH on that day.
Now, near-term technicals for Dogecoin and Ethereum Classic point at decreasing bearish momentum. Contrarily, SAND depicted signs of easing bullish influence and yet again defied the market trend.
Dogecoin (DOGE)
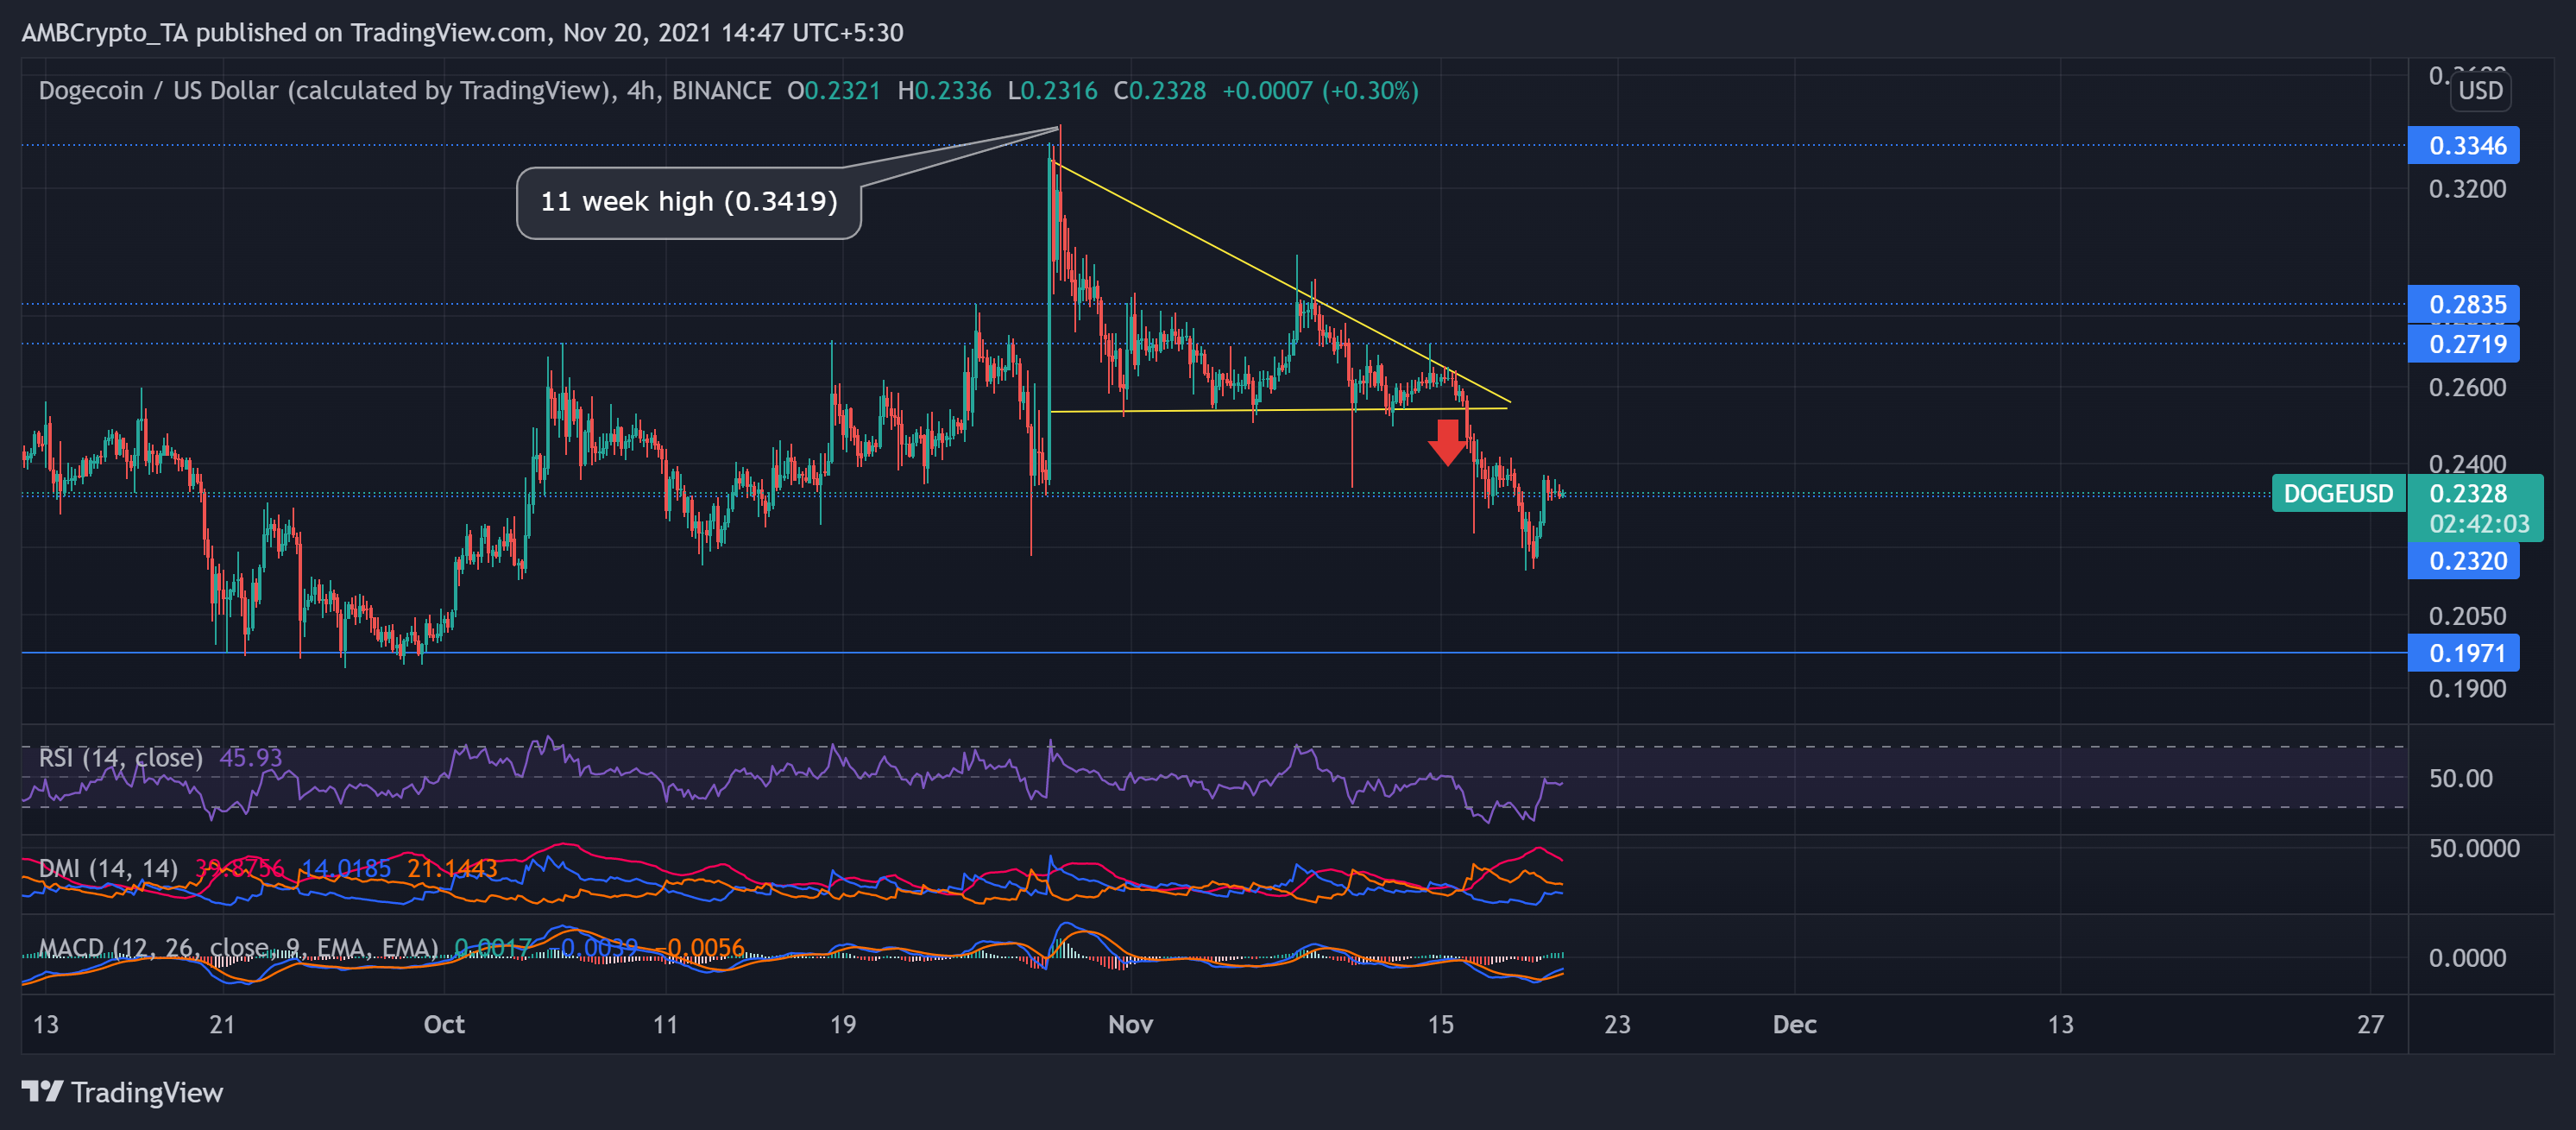
The dog-themed coin relished a solid upturn in October. Since late September, the meme coin rallied by over 72% to touch its 11-week high on 28 October. But, the bears were quick to counter as the price reversed in a descending triangle. The bulls failed to counter the sell-off as DOGE lost over one-third of its value from 28 October to 18 November. As a result, it touched its six-week low on 18 November.
Over the past two days, bulls gathered enough momentum as the alt was up by 8.19% during that time. Accordingly, at press time, DOGE traded near its immediate support at $0.2328.
The RSI recovered by over 25 points but couldn’t breach the midline. This reading depicted a slight bearish preference while pointing at increasing bullish vigor. While DMI preferred the bears, MACD hinted at their decreasing power.
Ethereum Classic (ETC)

Since 27 October, ETC bulls triggered an upturn as the price rallied by 39.6% to poke its ten-week high on 9 November.
However, the bulls lost their edge as the price declined in a down channel since then. Price action downturned by 28.67% to touch its three-week low on 18 November. Now, the bulls retaliated as the price saw a 7% increase over the past two days.
At press time, ETC traded at $50.45. The RSI stood slightly below the midline after a 15 point surge in 24 hours. While DMI preferred the bears, MACD hinted at their decreasing power. However, the revival was on low trading volumes, signaling its weak nature. The bulls will need more momentum to breach the $51.5-mark (immediate resistance).
The Sandbox (SAND)
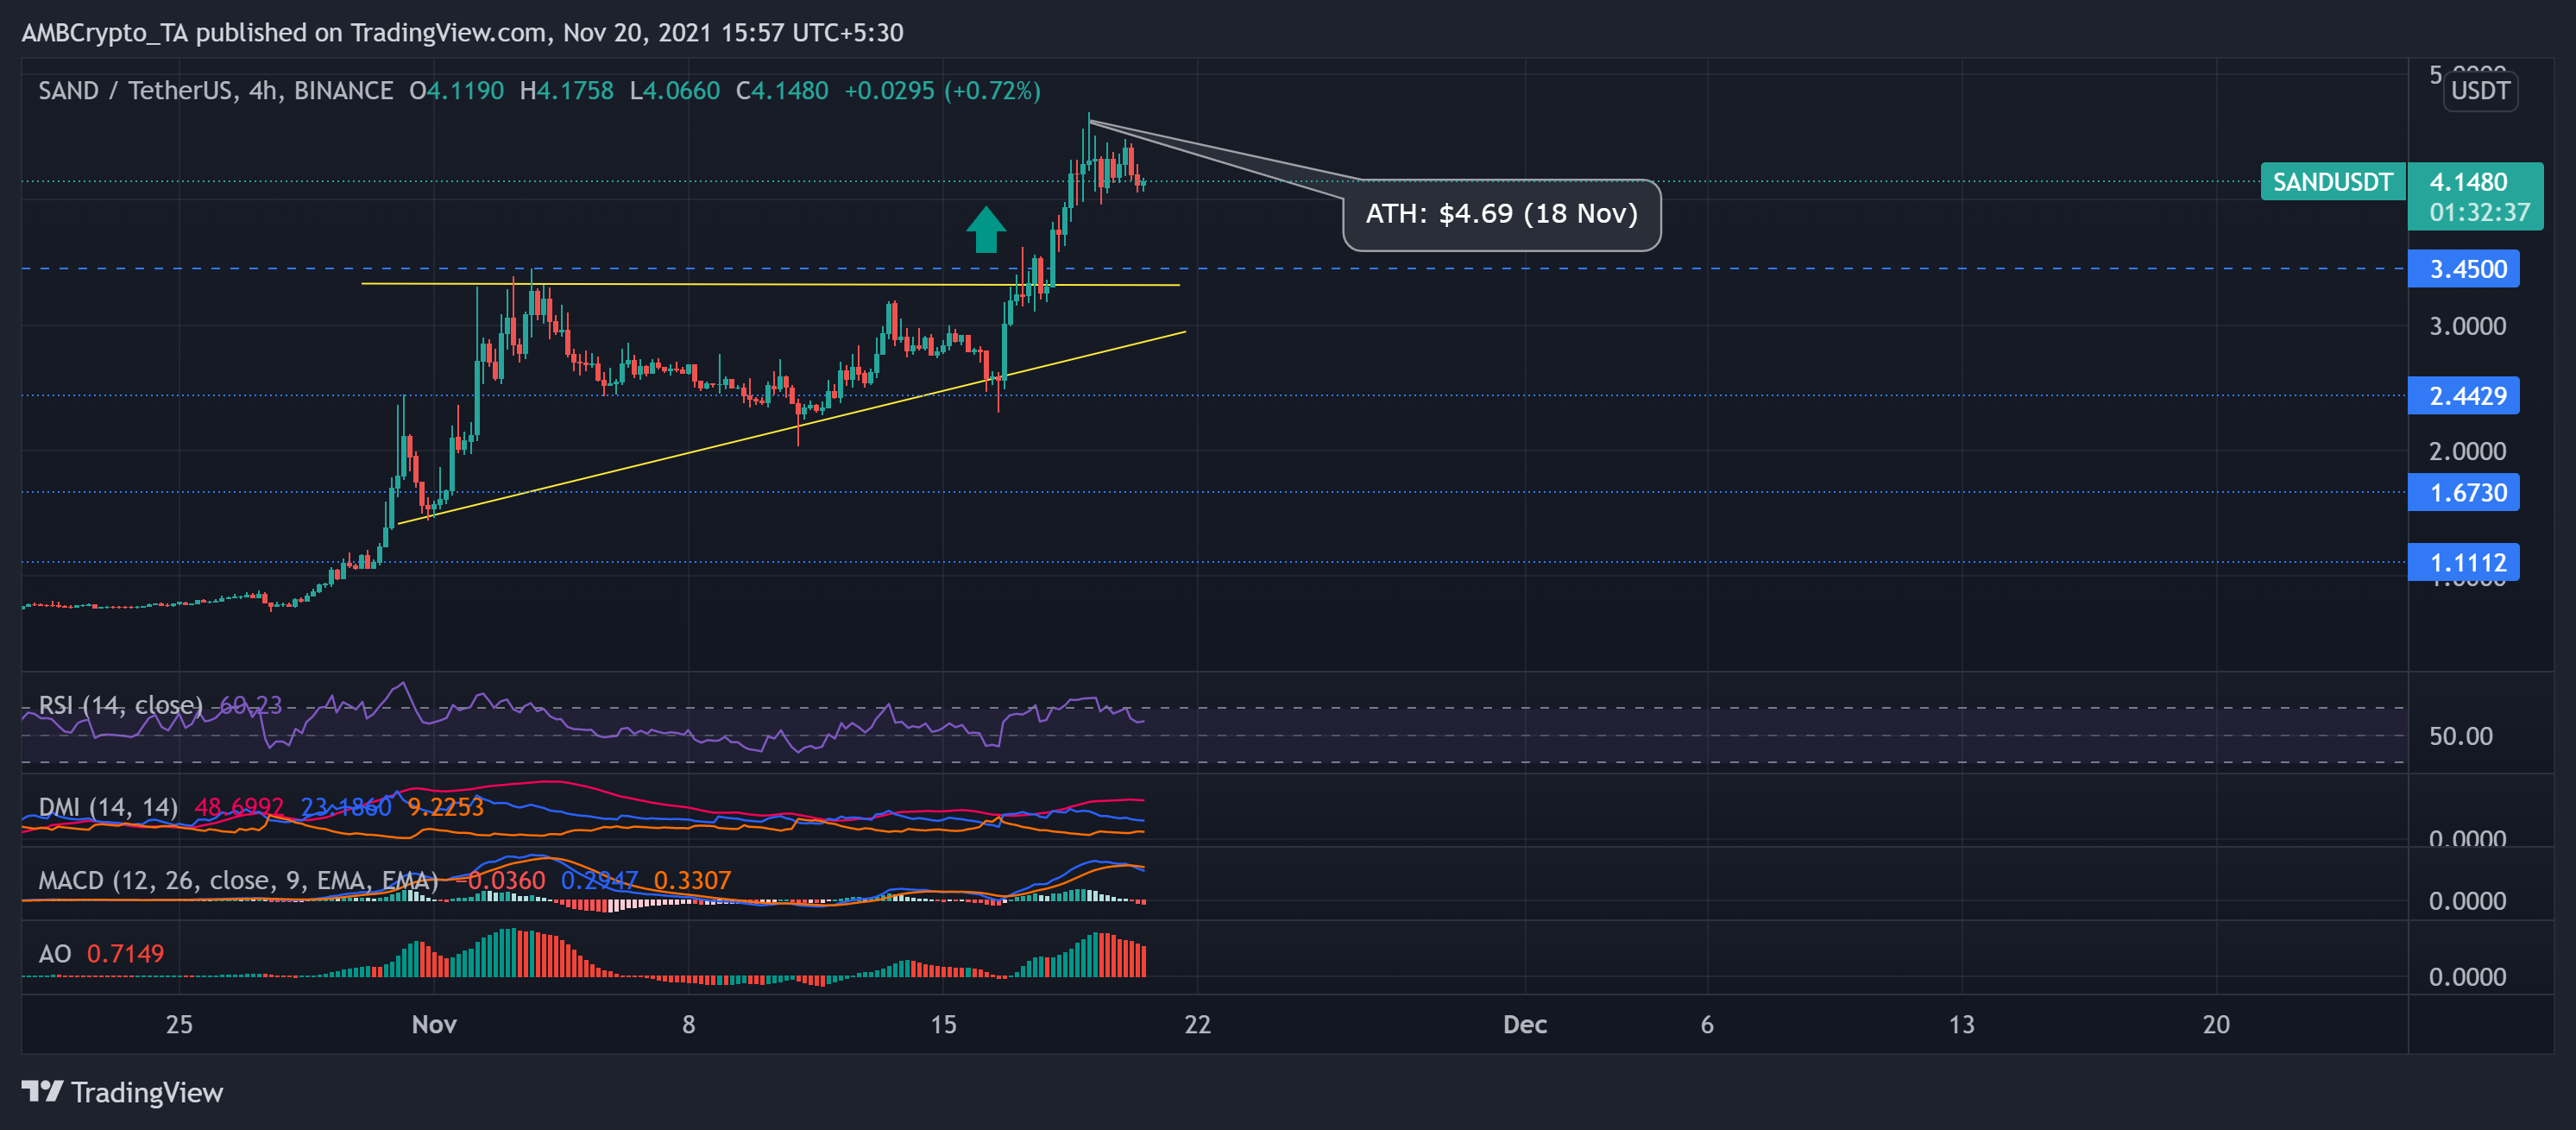
From 28 October, SAND saw an outstanding 349% rally as it touched its then ATH on 3 November. Since then, the price action saw slightly retraced but formed an ascending triangle for the next two weeks.
Afterwhich, the anticipation of an upcoming project possibly became the trigger point for an ascending triangle breakout on 16 November. Consequently, this rally led SAND into price discovery as it touched its ATH on 18 November.
While the near-term technicals favored the bulls, they hinted at their decreasing power. Consequently, at press time, the alt traded at $4.148 after noting a 5.7% 24-hour loss. The RSI plunged from the overbought territory to the 60-mark. While DMI preferred the bulls, MACD and AO hinted at their decreasing strength. The bears will need more force to breach the $3.45-mark (immediate support).