Dogecoin hauls itself past $0.14, but can it flip the long-term downtrend

Disclaimer: The findings of the following analysis are the sole opinions of the writer and should not be considered investment advice
Bitcoin attempted to climb above the $44.4k resistance a few hours prior to press time. In the past couple of weeks, Bitcoin has made steady gains, and the altcoin market also piggybacked on this bullish momentum. Dogecoin rose above the $0.14 area, which had been flipped from demand to supply last month but was flipped back to demand once again. The $0.17 and $0.19 levels are likely to see sellers step in. Can the prices climb past these levels in the weeks to come?
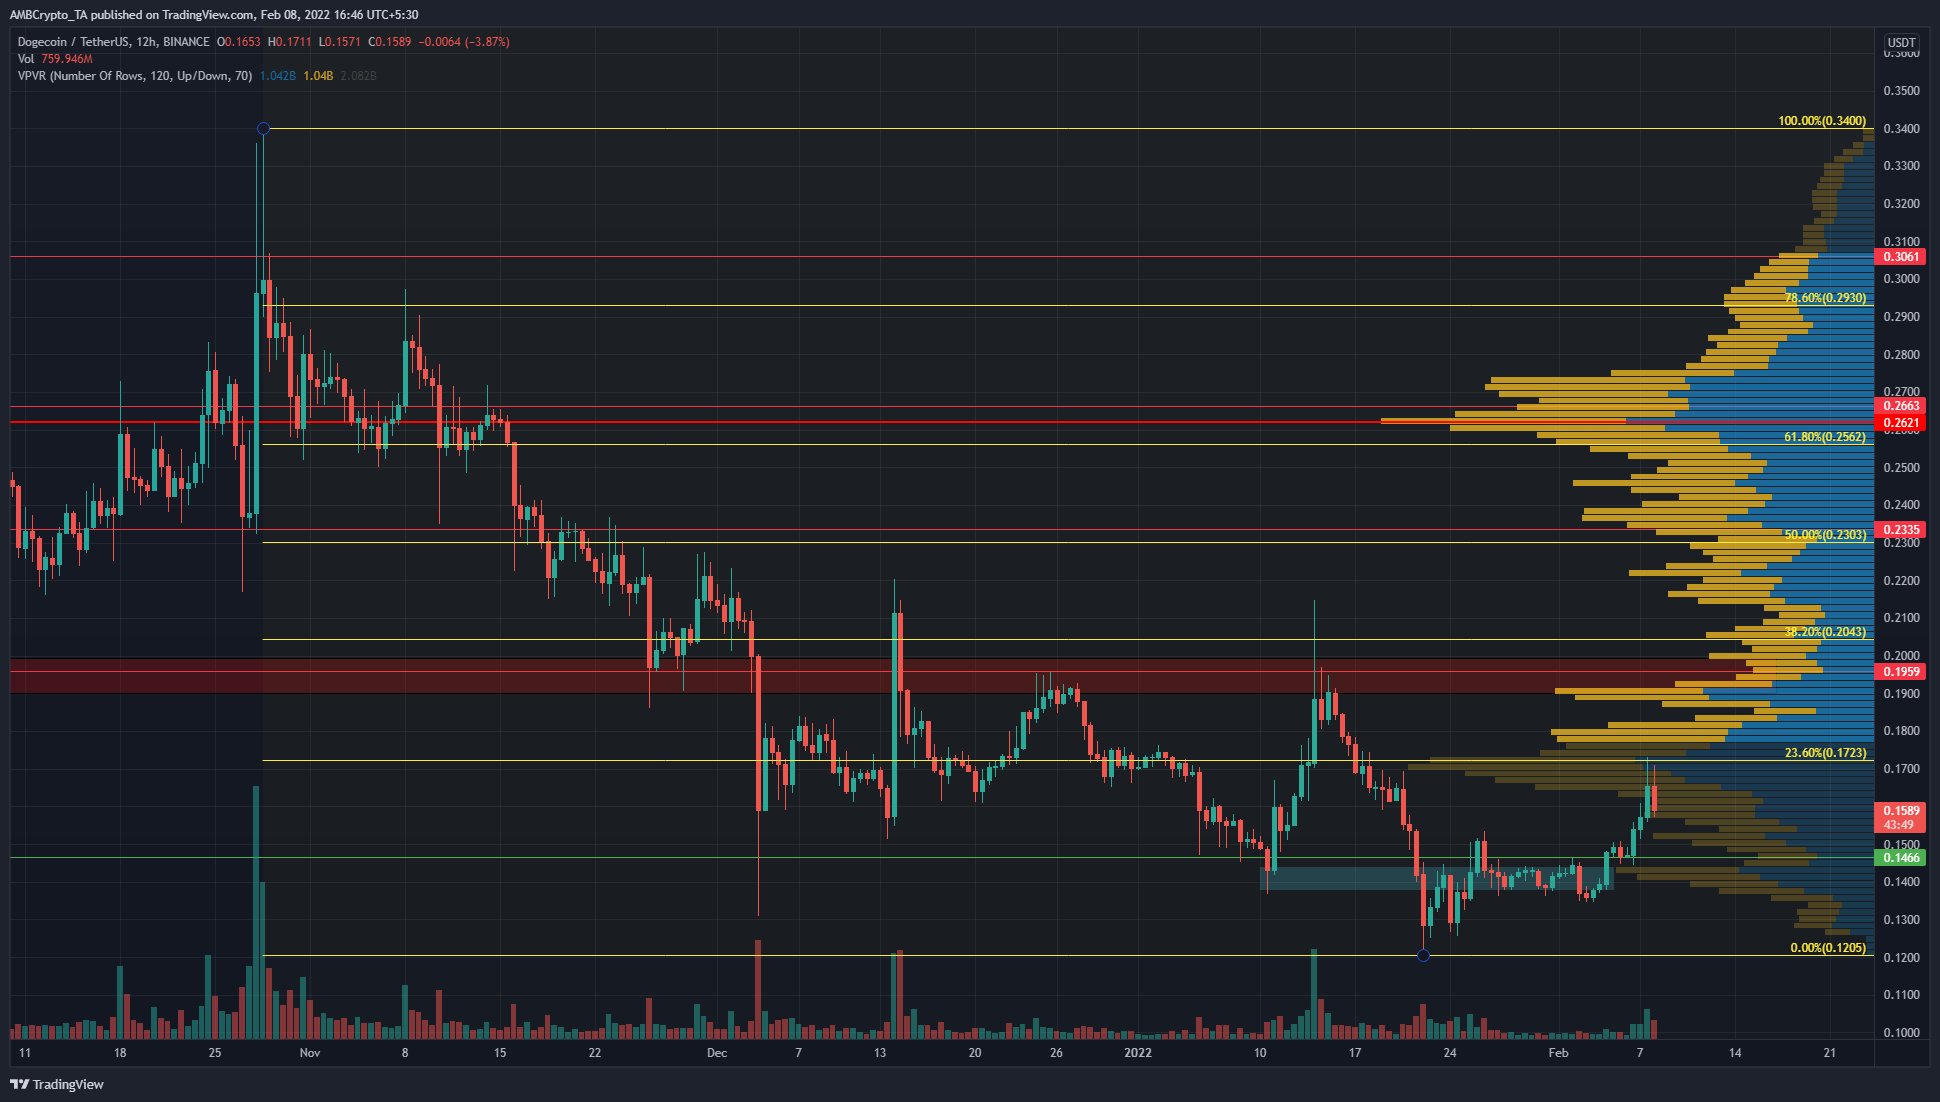
A set of Fibonacci retracement levels (yellow) were plotted from the swing high at $0.34 to the swing low at $0.1205. This move was only a part of DOGE’s continuous cascade downward from the $0.73 highs in May last year.
The 23.6% retracement level at $0.1723 was important- a move above the 23.6% level and its flip to support was one criterion that could indicate further upside for an asset. Moreover, the Visible Range Volume Profile showed that the $0.17 area was a high trading volume node in the past three months, which meant that DOGE would likely face heavy resistance at this level. The Point of Control lay much higher, at $0.26, which showed that DOGE has seen huge losses in recent months and would likely need time to recover, if it does.
It was encouraging for bulls to see the $0.14 level flipped to support, as the $0.14 region has offered resistance in recent weeks. The $0.19 area (red box) was another area of significance on the charts. The price was unable to close above this session and retest it as support since December, and its only foray higher in this time period was met with decisive selling pressure.
Rationale
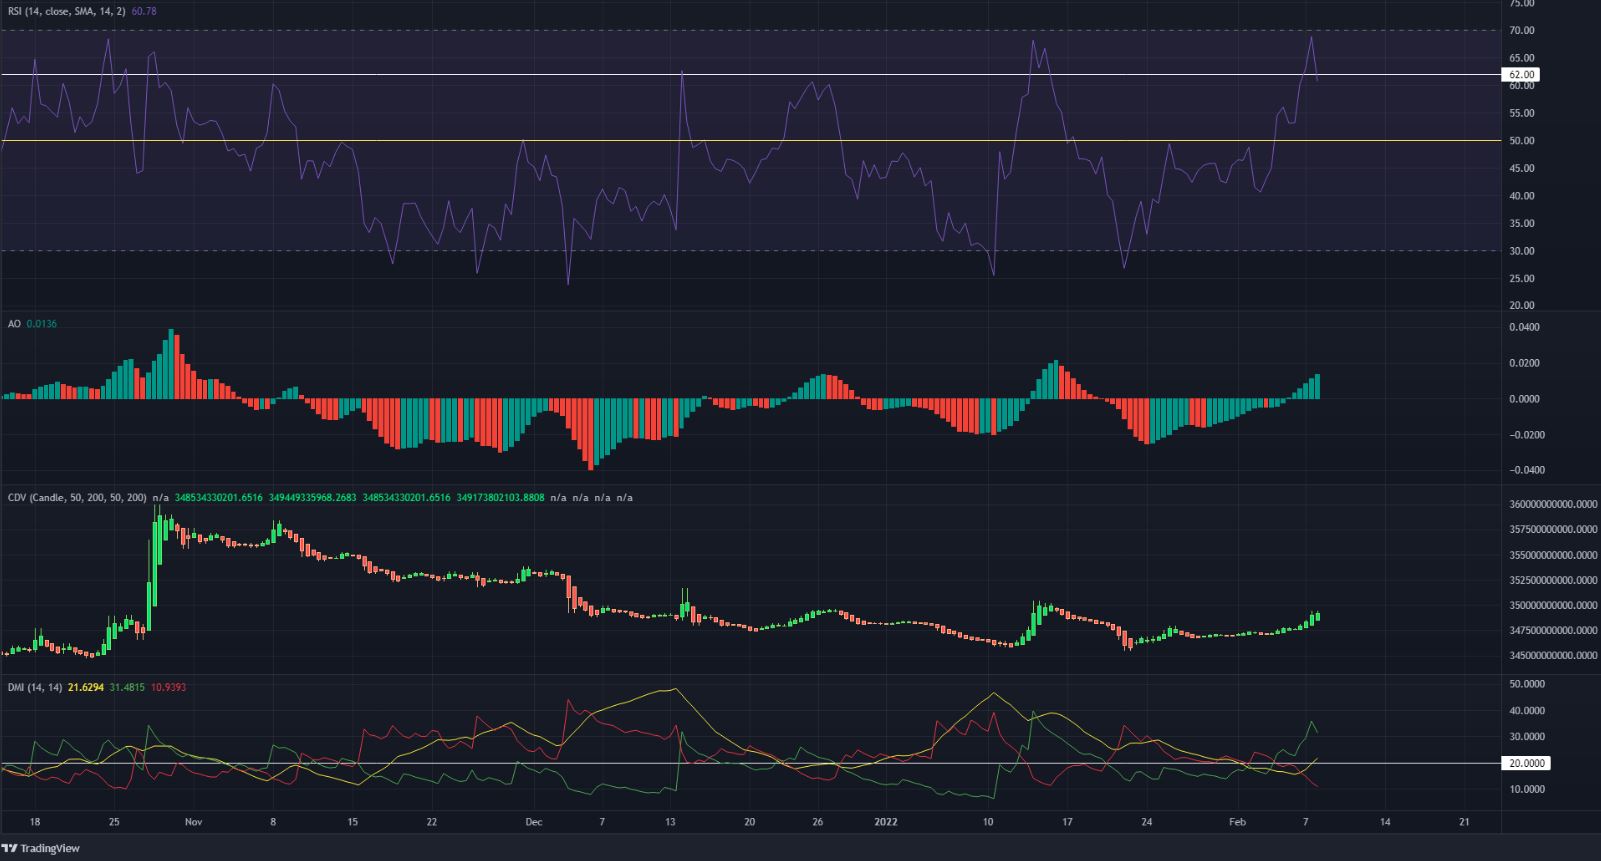
The RSI almost reached 70 before a dip, and the 62 value has been highlighted as a level where the RSI has generally stopped its ascent at. Brief moves past this mark have been expunged quickly by selling pressure. Hence it would be telling if the RSI can stay above 62 and climb higher once again.
The Awesome Oscillator crossed over into bullish territory- but has been beneath the zero level for the majority of the past few months. If the AO can climb above the shallow peaks it has formed since December, it would highlight strong upward momentum.
The Cumulative Delta Volume showed that the past few days have seen considerable buying, hence the recent rally was likely on the back of genuine demand. The Directional Movement Index was on the verge of showing a strong bull trend in progress.
Conclusion
The indicators highlighted recent upward pressure but it was not clear if DOGE can follow through and climb past the $0.19 area. At the time of writing, the $0.17 and $0.19 levels are of significance.


