
The past 24 hours had been positive in terms of recovery but no coin saw an immediate price boom. Bitcoin rallied up by 9.5% owing to the hype of El Salvador adopting it as legal tender. Yet, most altcoins could not join that bandwagon; Dogecoin, Polkadot, and Binance Coin fell under that category.
Dogecoin [DOGE] :-
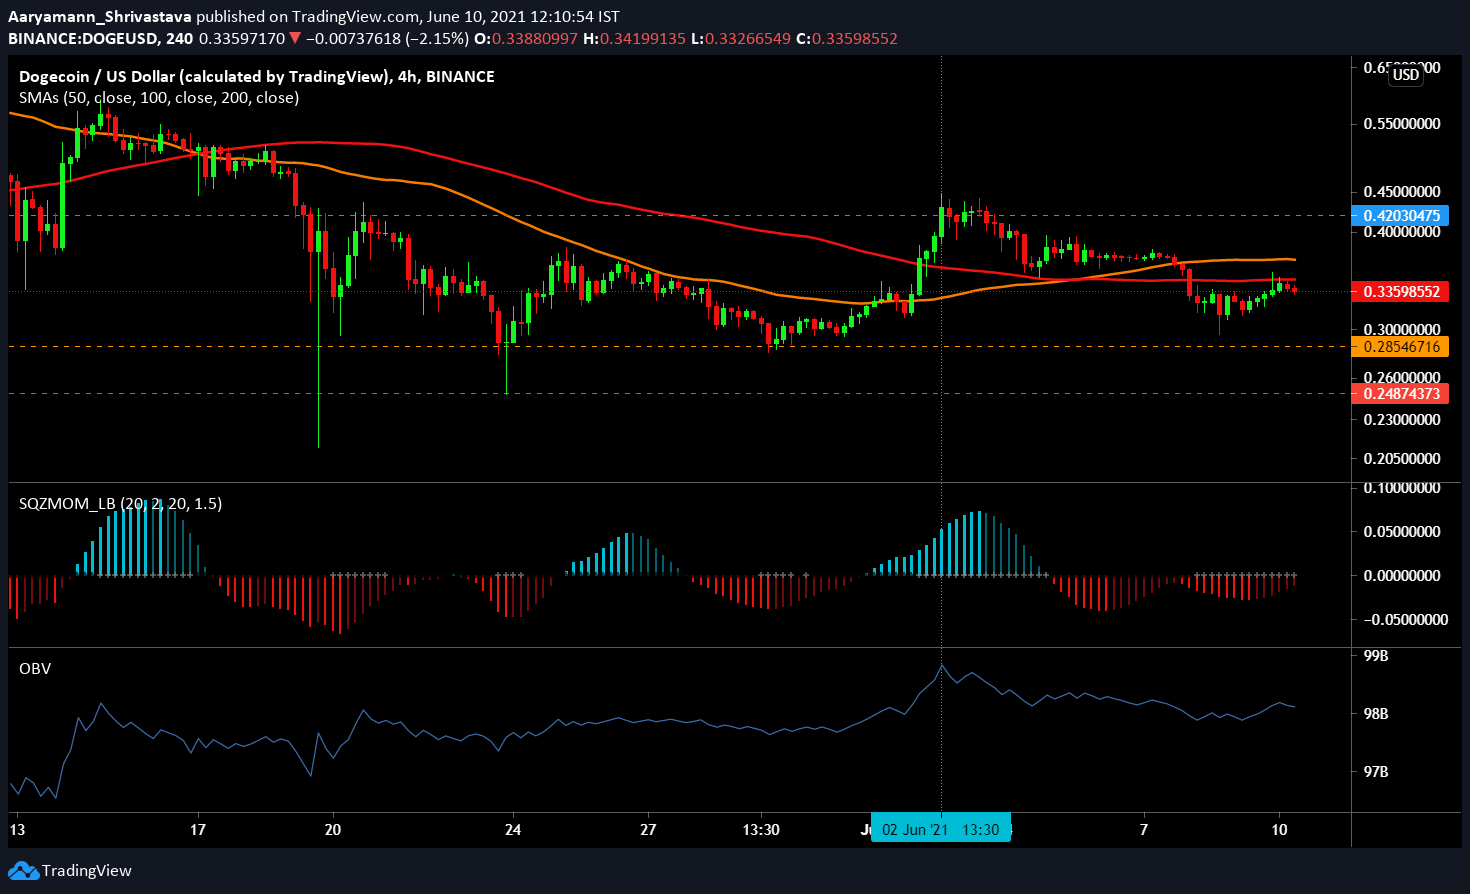
Source: DOGE/USD – TradingView
DOGE witnessed a price rise in the last 24 hours. Up by 6.4%, at press time the coin was trading in red at $0.335. The coin was in a bull run until June 4 testing the resistance level ( $0.42 ). Nevertheless, the June 4 & June 7 dips brought DOGE closer to the support level ( $0.285 ). Simple Moving Averages lines – 50 SMA (orange) and 100 SMA (red), both acted bearish for the coin. This translated to a longer waiting period for the coin to recover from the dips.
According to Squeeze Momentum Indicator, squeeze release (white dots) was still active at press time, which explained the coin’s slow recovery. However, at the time of writing, bearish pressure seemed to be receding. On Balance Volume had been displaying high buying momentum in the market, gradually slipping towards the 98 billion mark at press time.
All indicators point towards a sideways movement within the aforementioned support and resistance level.
Polkadot [ DOT ] :-
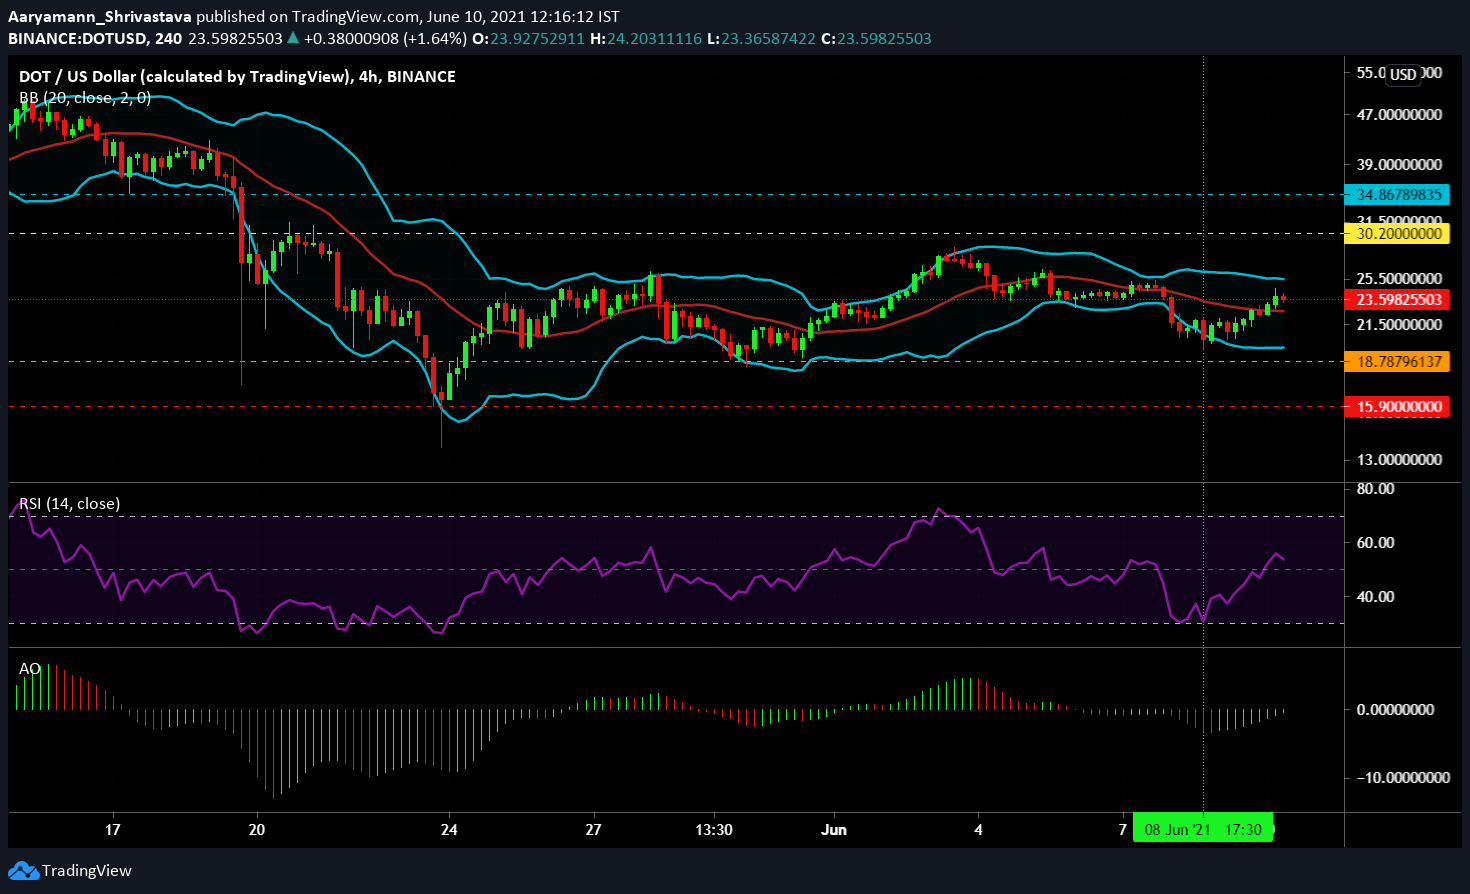
Source: DOT/USD – TradingView
DOT consolidated itself within strong support and resistance levels. The market’s recent volatility kept the coin from breaking past $30.2 as well as falling below $18.78. Relative Strength Index (RSI) made a strong comeback from the oversold zone as buying pressure brought the indicator back up. At the time of writing, the indicator observed a slight dip above the neutral line.
With Bollinger Bands still diverged, their parallel movement did not indicate volatility yet. However, since the candlesticks moved above the basis (red line) the movement further could be positive. Awesome Oscillator also displayed bullish momentum building up in the last 24 hours.
These indications are favorable to a price rise. Regardless the coin will keep within its resistance and support.
Binance Coin [ BNB ] :-
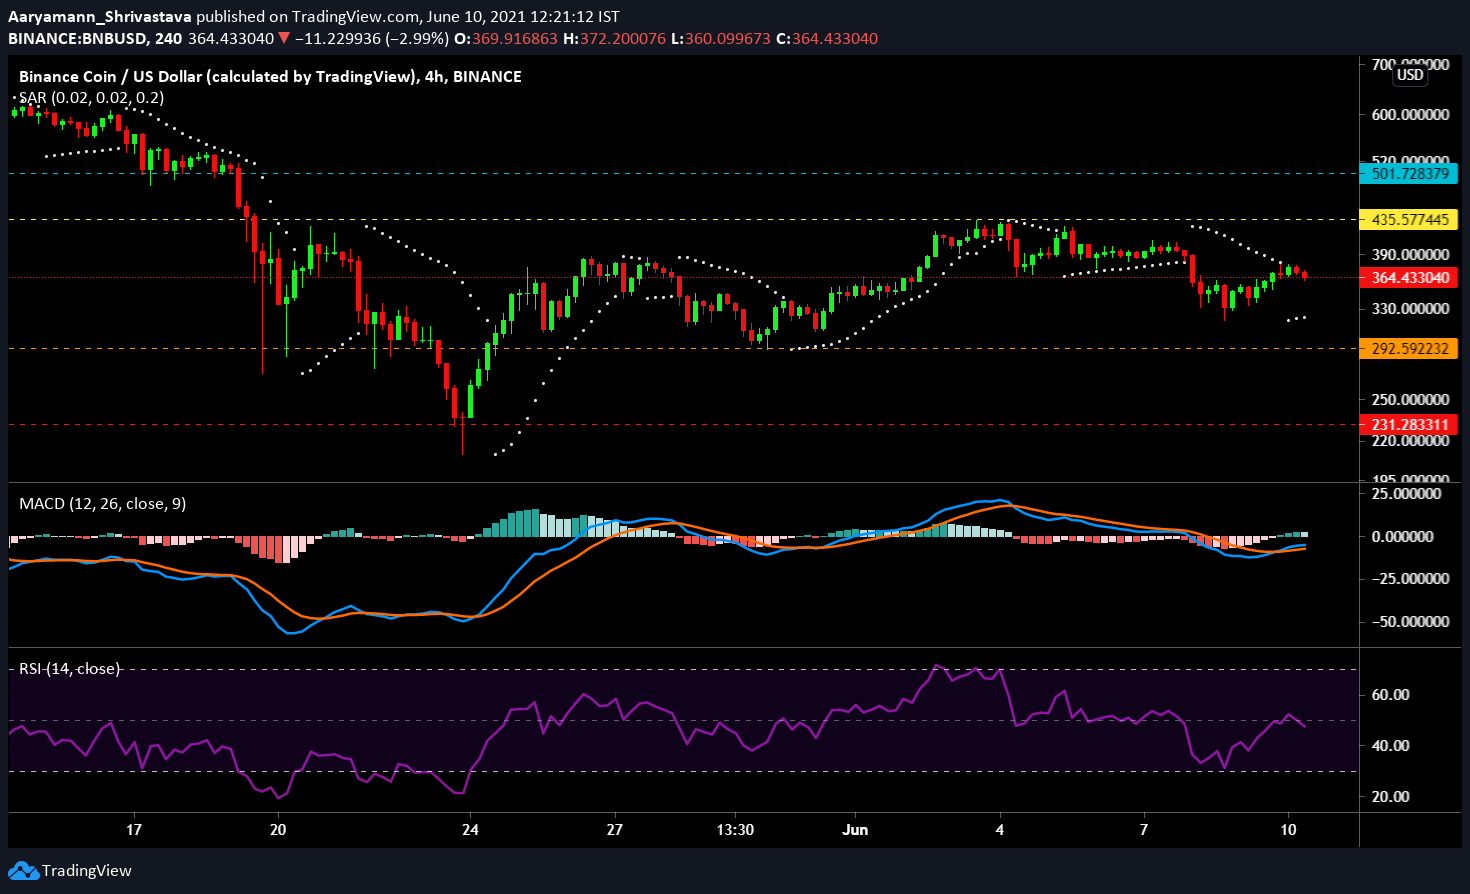
Source: BNB/USD – TradingView
Binance Coin performed well at the beginning of the month with the coin moving close to the $435 resistance level. June 4 & 7 brought that to a stop and the coin dropped. BNB is recovering but rather slowly. At press time, the price indicator was at $364, trading in the red. Relative Strength Index (RSI) dipped slightly under the neutral line at the time of writing.
MACD on the other hand, displayed a bullish crossover as the indicator line moved over the red signal line. According to the Parabolic SAR, white dotted line’s presence under the candlesticks displayed a rising uptrend. However, it is too early to declare a positive price action moving forward.
The active resistance and support levels are pretty strong, and at the moment the price could swing either way. It’s important to watch BNB’s movement.
![Why Chainlink [LINK] and Polygon [MATIC] are more similar than you realise](https://ambcrypto.com/wp-content/uploads/2024/04/Chainlink_and_Polygon-1-400x240.webp)