
- DOGE’s weekly and daily price charts remained in the green
- However, a few market indicators leaned bearish for the altcoin
While a few top cryptos registered price corrections over the last seven days, Dogecoin [DOGE] acted differently. While that happened, a bullish pattern formed on the memecoin’s price chart, one which could soon result in yet another bull rally.
Dogecoin’s bullish week
CoinMarketCap’s data revealed that Dogecoin’s price hiked by more than 6% in the last seven days. This bullish trend continued in the last 24 hours or so, as its value appreciated by another 3%.
At the time of writing, DOGE was trading at $0.1337 with a market capitalization of over $19 billion. Hence, the question – Can it go any higher?
Popular crypto analyst Kevin recently shared a tweet highlighting a bullish falling wedge pattern of DOGE’s price chart. According to the same, the world’s largest memecoin’s price has been consolidating inside the falling wedge for quite some time now.
In fact, at press time, it was getting ready to break out. In the event of a successful breakout, DOGE might hit $0.30 in the coming days or weeks.

Source: X
Will DOGE actually break out?
To assess this scenario further, AMBCrypto then took a closer look at the memecoin’s current state to better understand whether it would manage to break out. Our analysis of Santiment’s data revealed that DOGE’s trading volume declined while its price increased. This is generally considered a bearish signal.
The memecoin’s MVRV ratio dropped, which can also be inferred as a bearish development.
Additionally, Dogecoin’s weighted sentiment remained in the negative zone. To put it simply, bearish sentiments retained their dominance across the market.
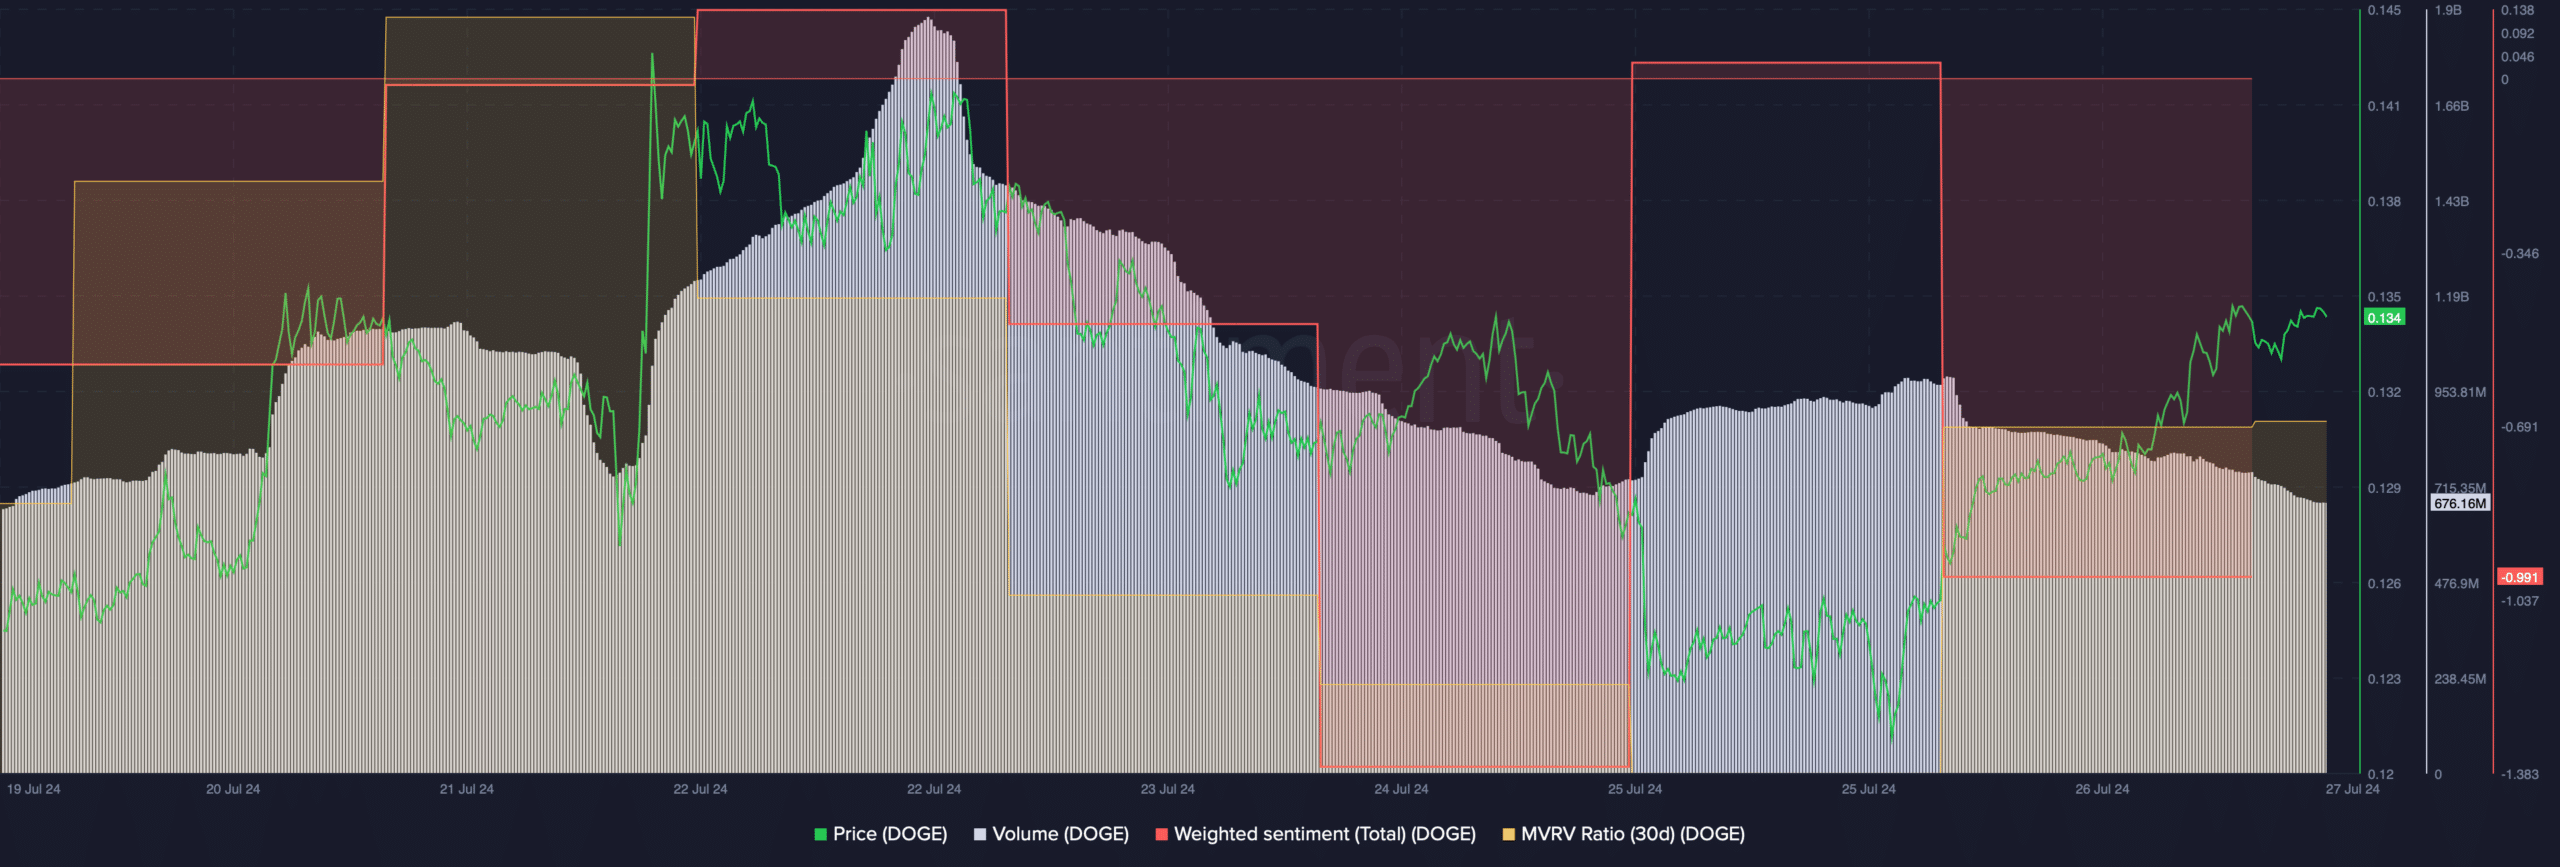
Source: Santiment
Our analysis of Coinglass’ data revealed yet another bearish signal. DOGE’s long/short ratio registered a decline. This is a sign that there have been more short positions in the market than long positions.
Apart from this, quite a few market indicators also looked pretty bearish at press time. For instance, the Relative Strength Index (RSI) registered a downtick. Dogecoin’s Money Flow Index (MFI) also followed a similar trend. Moreover, the MACD also flashed the possibility of a bearish crossover.
All of these indicators, together, suggested that DOGE might soon see some price correction.
Nonetheless, there remain chances of DOGE breaking out of the pattern. This was the case as its price continued to trade above its 20-day Simple Moving Average (SMA), as per the Bollinger Bands. If Dogecoin tests this support level, then a breakout is likely to happen.
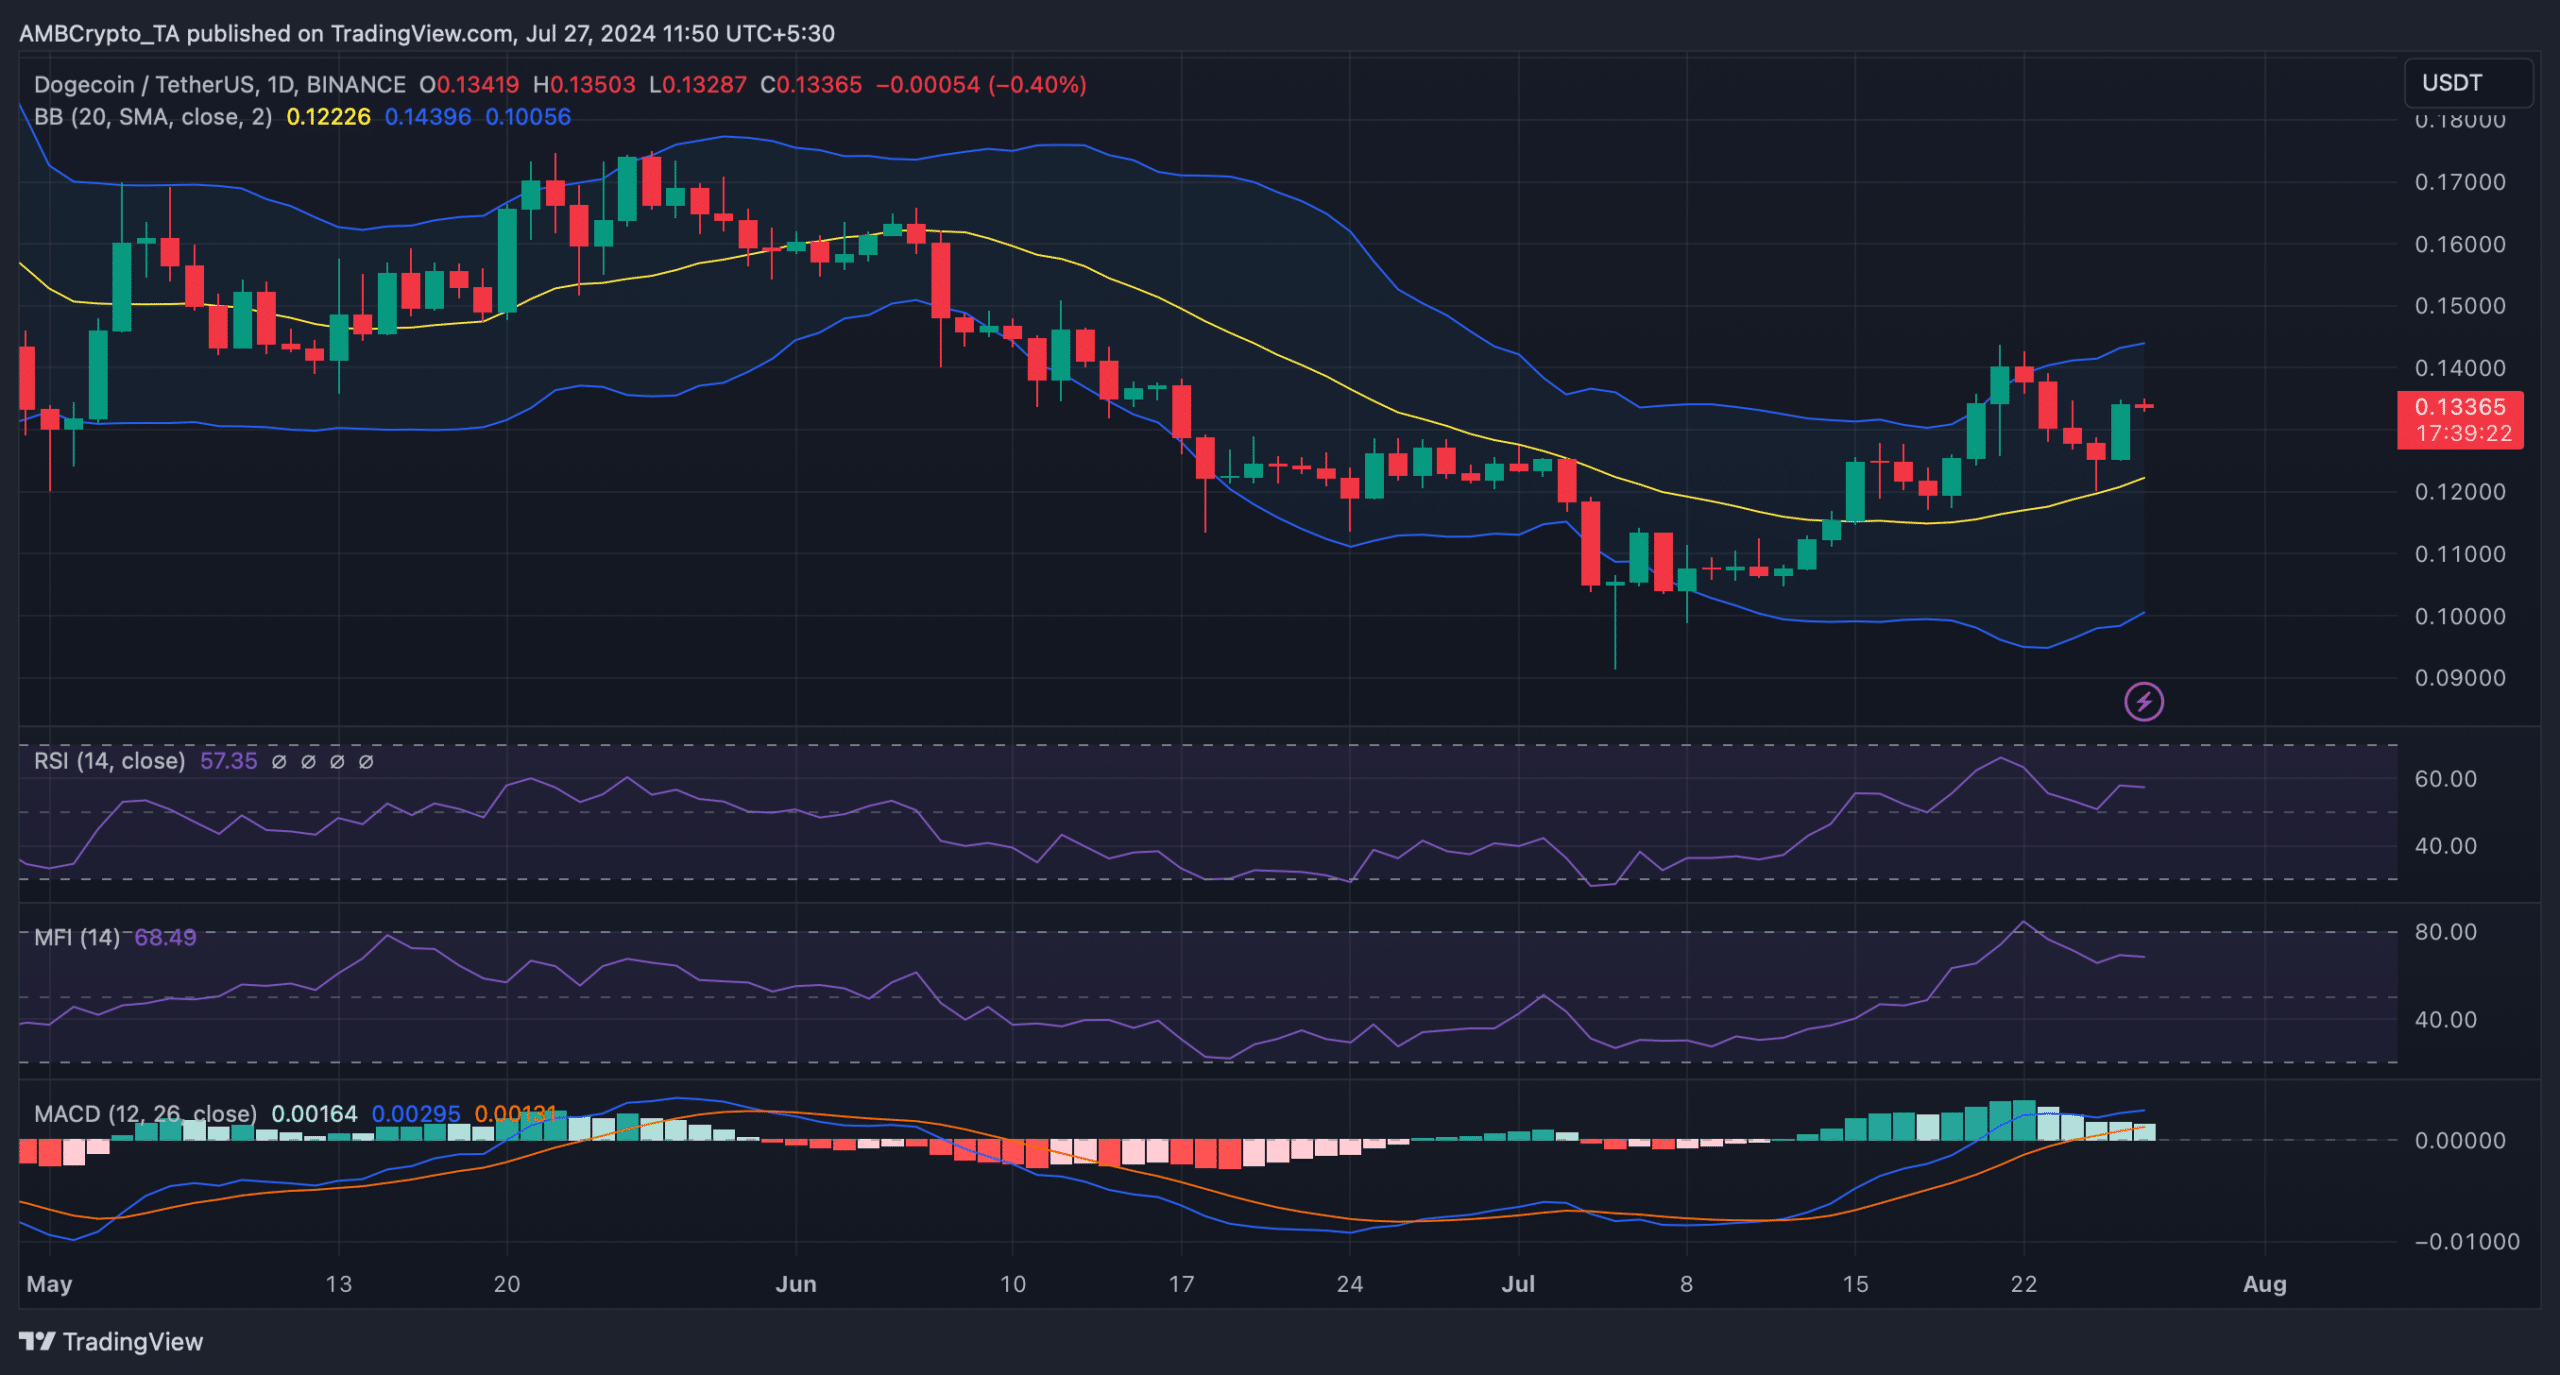
Source: TradingView
Is your portfolio green? Check the Dogecoin Profit Calculator
However, before eyeing the $0.3 level, DOGE must first go above $0.135 as liquidations would rise sharply at that level. Going north, the next possible target for DOGE in the short-term would be $0.143.

Source: Hyblock Capital