Dogecoin price prediction – Why traders need to look out for this breakout!

- After falling below the $0.13 baseline, Dogecoin broke out of a bearish pattern on its daily chart
- DOGE’s funding rate declined amid an increasing bearish edge
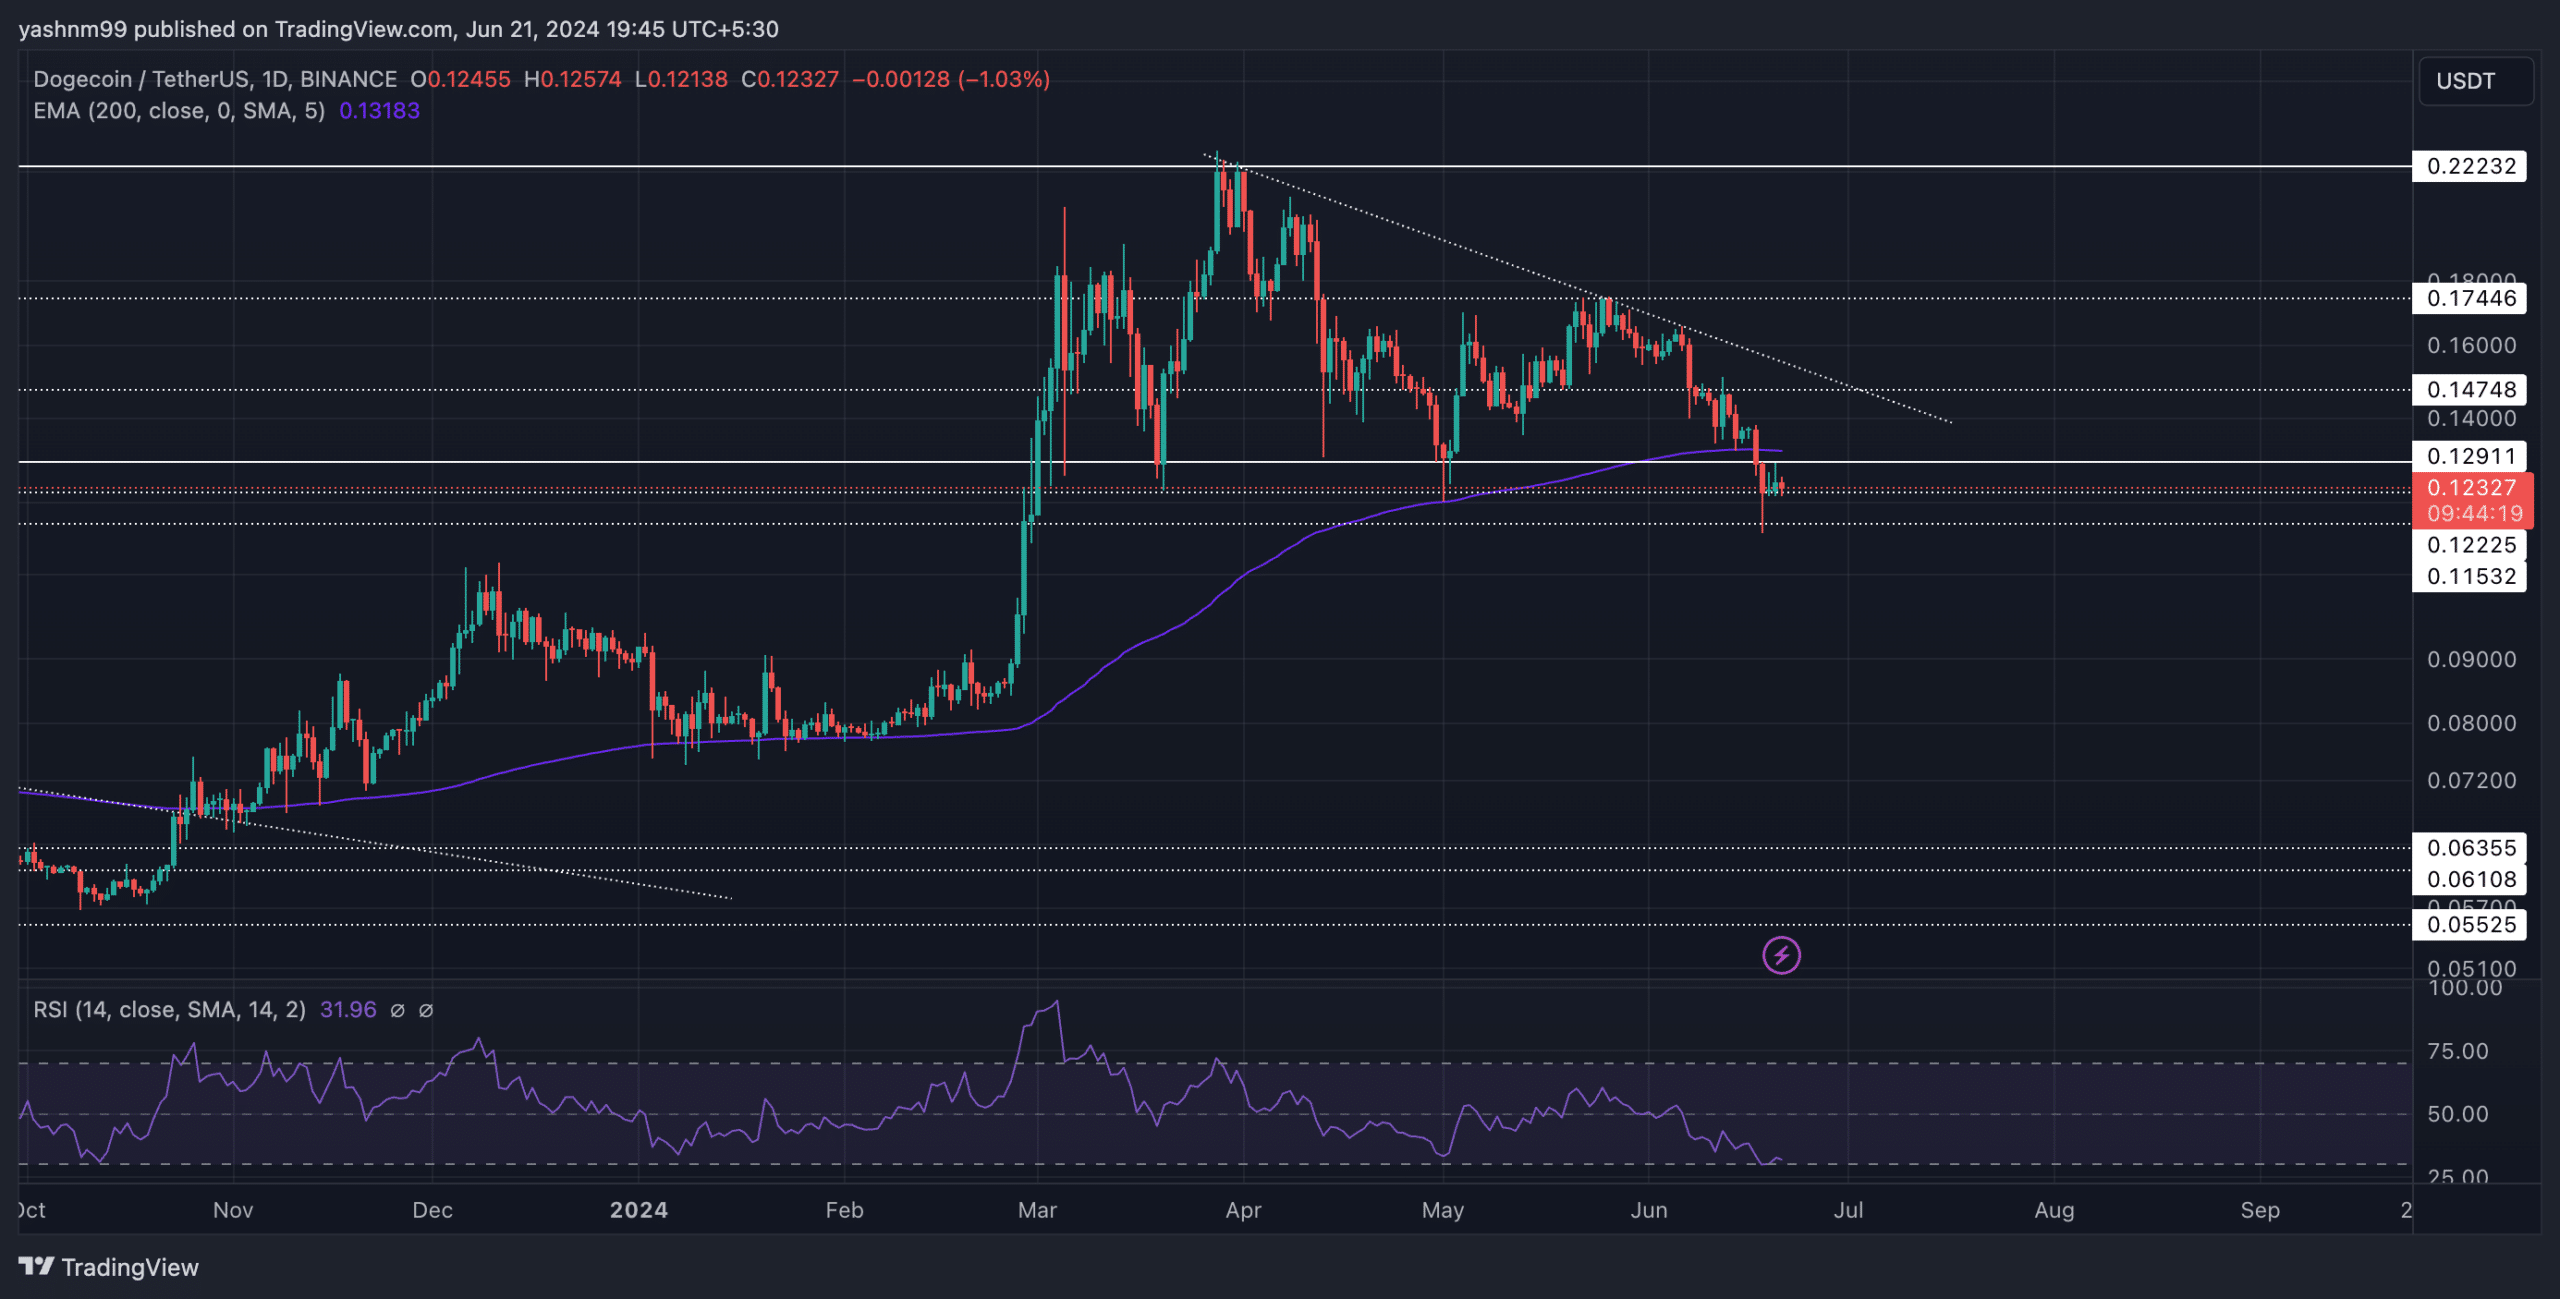
Dogecoin’s [DOGE] recent decline below the $0.13 resistance finally provoked a breakout from its classic descending triangle pattern on the daily chart. Soon after, the memecoin fell below its 200-day EMA and confirmed a rather long-term bearish sentiment.
Meanwhile, the altcoin’s funding rate also turned negative amid bearish pressure when a whale transferred over $10M worth of DOGE from an unknown wallet to Robinhood.
A potential reversal above the $0.13-level can turn the narrative around. At the time of writing, DOGE was trading at nearly $0.0122.
Can DOGE buyers induce a rally?
After witnessing over 150% gains in just a month, the previous bull run in March helped the bulls test the $0.22 resistance. The bears then quickly induced a downtrend over the next few weeks, especially as the market-wide uncertainties increased.
The reversal from the $0.13 resistance (then support) caused a consolidation phase on the charts. In the meantime, the resulting price movement resulted in a classic descending triangle structure on the daily timeframe. The recent break below this level confirmed the bearish bias as the coin touched its four-month low on 18 June.
A reversal above the 200 EMA near the $0.13 resistance can help the buyers provoke a near-term recovery. In this case, likely targets would lie around the $0.147-zone.
However, any reversal below the 200 EMA can invalidate the near-term bullish tendencies. In this case, the first major support level would be the $0.11-mark.
The Relative Strength Index (RSI) stood near the 30-level, which indicated a relatively oversold position. The buyers can expect a convincing reversal from these levels soon.
Funding rate turned negative
According to data from Coinglass, DOGE’s funding rate over the last few days has seen a steep decline. Here, it’s also worth noting that this level was last seen in May 2024.
Given the price action’s historical sensitivity to this metric, the price could further account for this decline in the coming days. However, this also means that any reversals on this front can help buyers recreate a bullish narrative.
DOGE shared a 75% 30-day correlation with Bitcoin at press time. So, Bitcoin’s movement is worth keeping an eye on, along with these technical factors.


