What Dogecoin being ‘rangebound’ actually means for traders

Disclaimer: The information presented does not constitute financial, investment, trading, or other types of advice and is solely the writer’s opinion.
Bitcoin [BTC] was in dangerous straits after its rejection at the $27.8k resistance. Its short-term market structure was bearish. Despite the move up to $28.4k earlier this week, the failure of the bulls to follow through meant the bears were dominant.
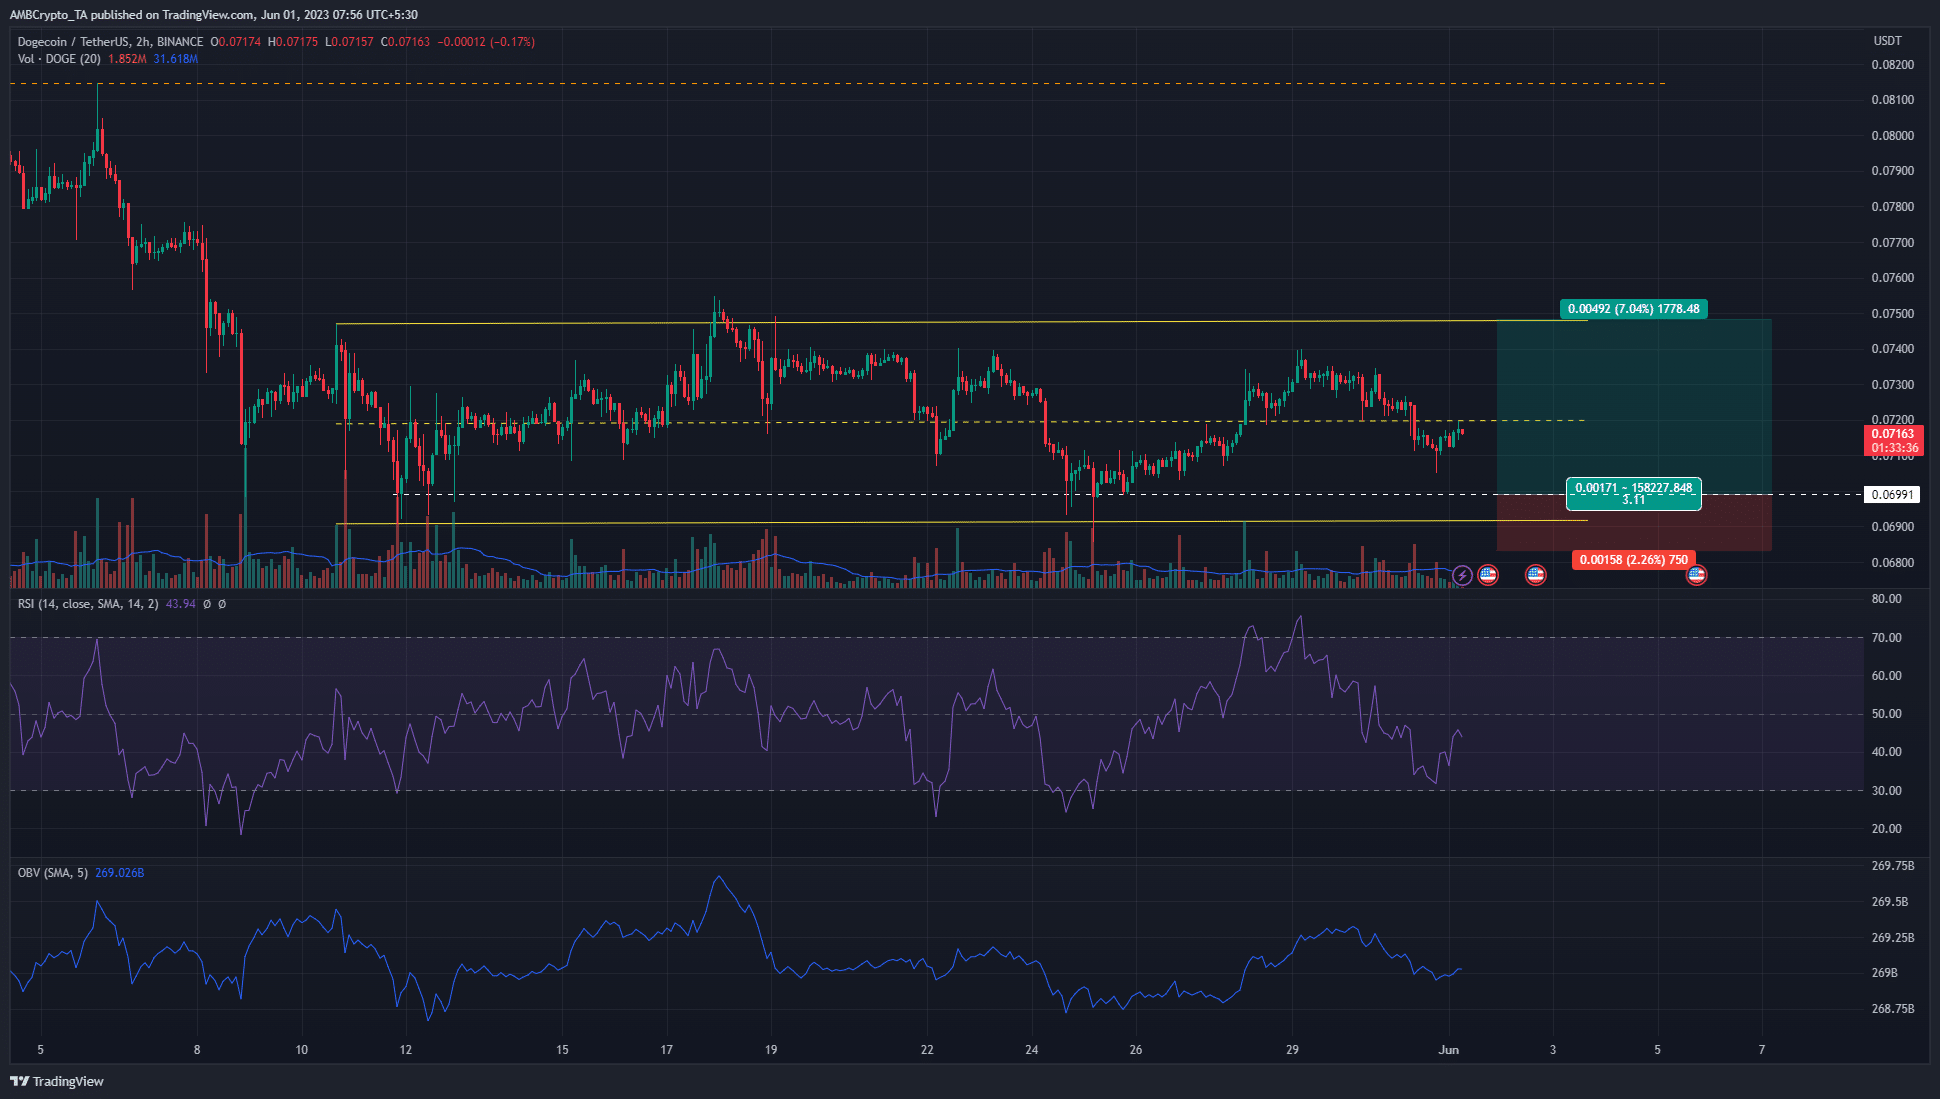
In this setting, Dogecoin presented tranquility by comparison in its price charts. The meme coin has traded within a range since 10 May. The recent selling pressure meant DOGE lost 3.5% since Monday’s highs.
The mid-range was resistance once again, which meant…
The Dogecoin lower timeframe range extended from $0.069 to $0.074. The mid-range point was at $0.072 and was respected as both support and resistance in the past three weeks. This added credibility to the range formation.
Over the past two days, the OBV began to sink lower alongside the RSI. This came after Dogecoin faced rejection at the $0.0734 resistance on Monday and began to decline. At the time of writing the RSI was beneath neutral 50, showing bearish momentum.
The range lows were defended so far. A retest will provide a good risk-to-reward buying opportunity, although a descent beneath the lows was also possible.
The next support zone for BTC lies at $24k-$25k, which meant DOGE could sustain heavy losses in case Bitcoin plunged downward on the charts.
The support level at $0.07, alongside the range lows at $0.069, could provide a bullish reaction. Stop-loss for longs can be considered beneath the swing low at $0.0685, with take-profit at the $0.074 high.
The sentiment leaned in favor of the bears after 29 May

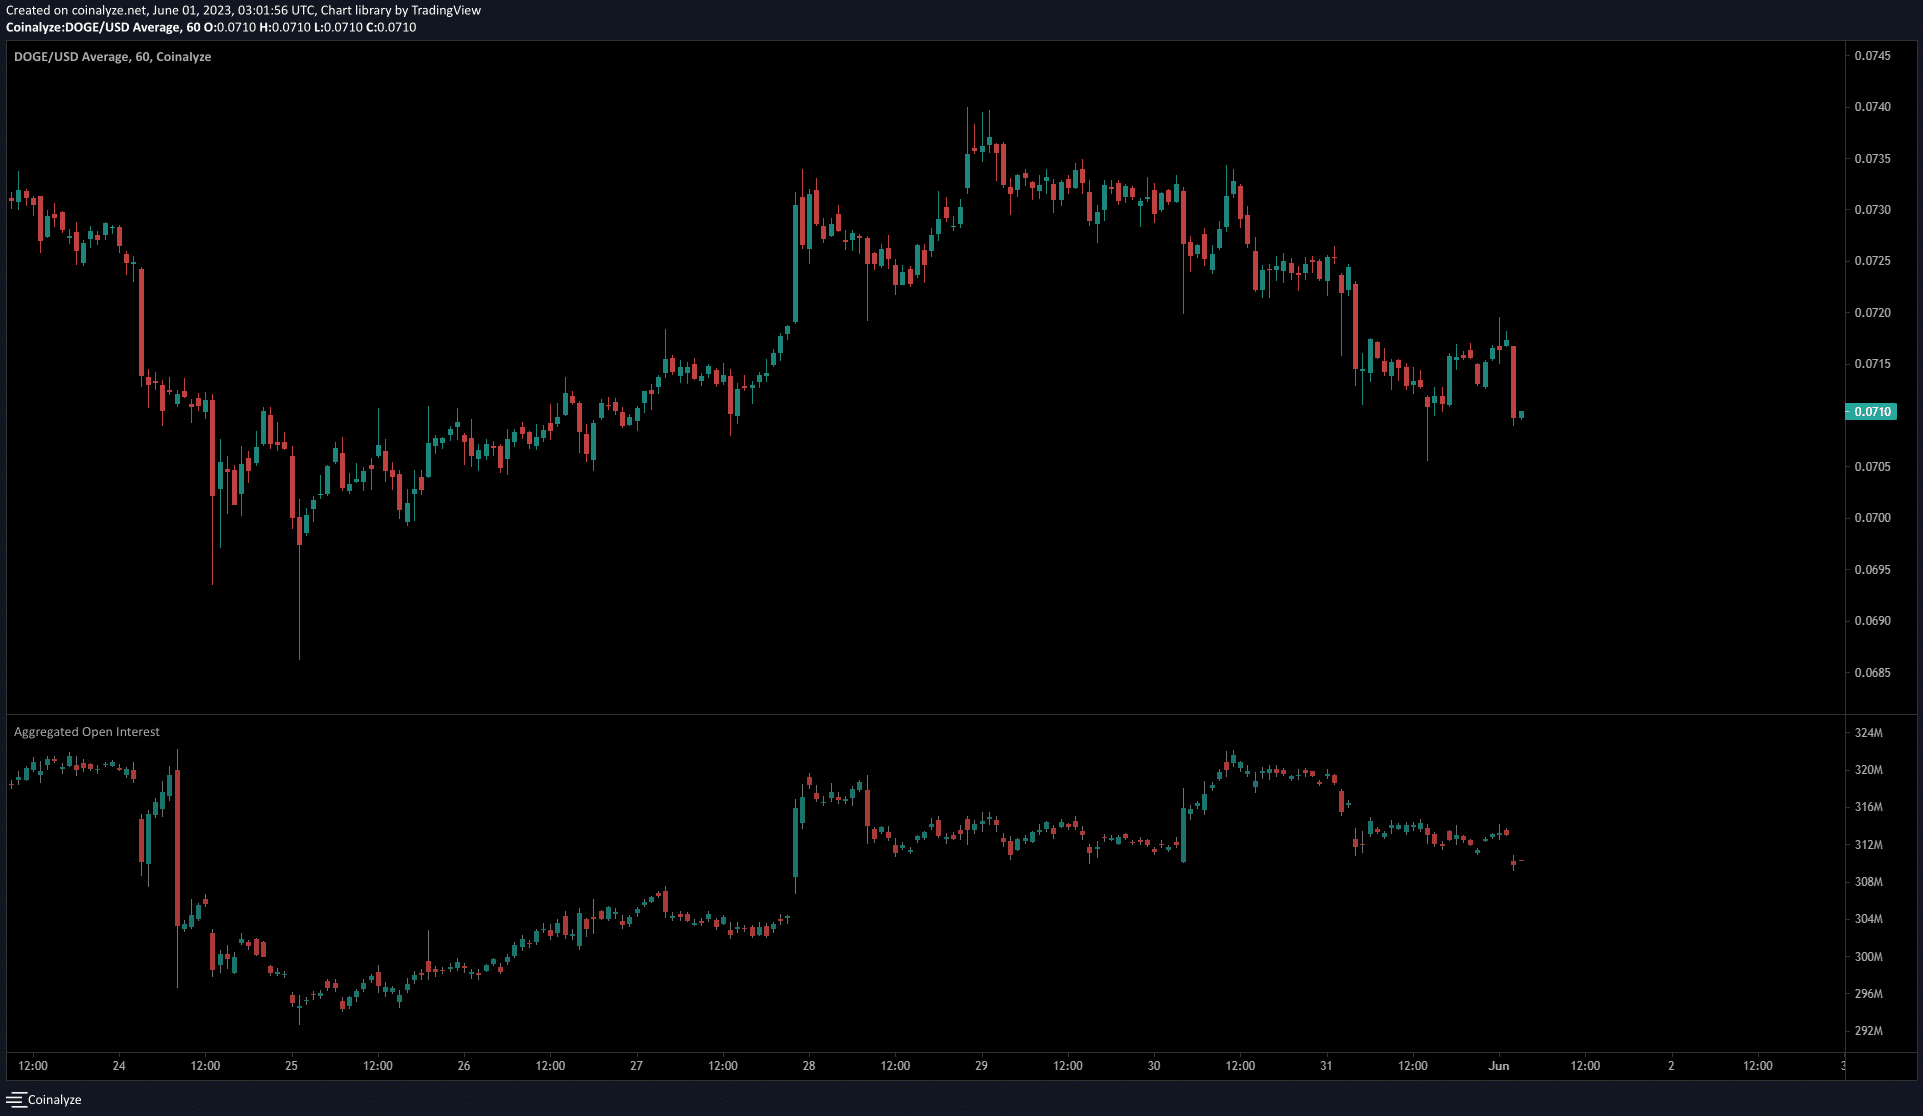
Source: Coinalyze
From 25 May to 28 May, the Open Interest rose by close to $20 million. Dogecoin posted gains of 4.5% as it climbed from $0.07 to $0.073. However, the OI began to fall on Monday even though DOGE pushed higher to reach $0.074.
Read Dogecoin’s [DOGE] Price Prediction 2023-24
This likely showed profit-taking from the short-term bullish speculators. After Monday, the OI rose on certain occasions when the price fell, for example during the late hours of 30 May.
Overall, the OI and the price declined over the past 36 hours, which showed discouraged longs and bearish momentum.


