


Disclaimer: The information presented does not constitute financial, investment, trading, or other types of advice and is solely the writer’s opinion.
- The Fibonacci retracement levels showed an important support level for bulls to defend.
- The daily timeframe market structure of Dogecoin remained bullish.
Bitcoin saw a small rejection at the $21.6k mark as the price jumped from $21k to $21.6k to collect liquidity before collapsing to $20.4k. Coinglass data showed $68 million worth of positions liquidated in the past 24 hours.
Realistic or not, here’s DOGE’s market cap in BTC’s terms
Dogecoin also saw a pullback, but its market structure remained bullish on the daily timeframe. On the other hand, it has flipped bearish on lower timeframes such as H4. An area of support at $0.075 was identified, where a bounce was likely.
The 12-hour breaker remained unbroken and momentum flipped to bearish
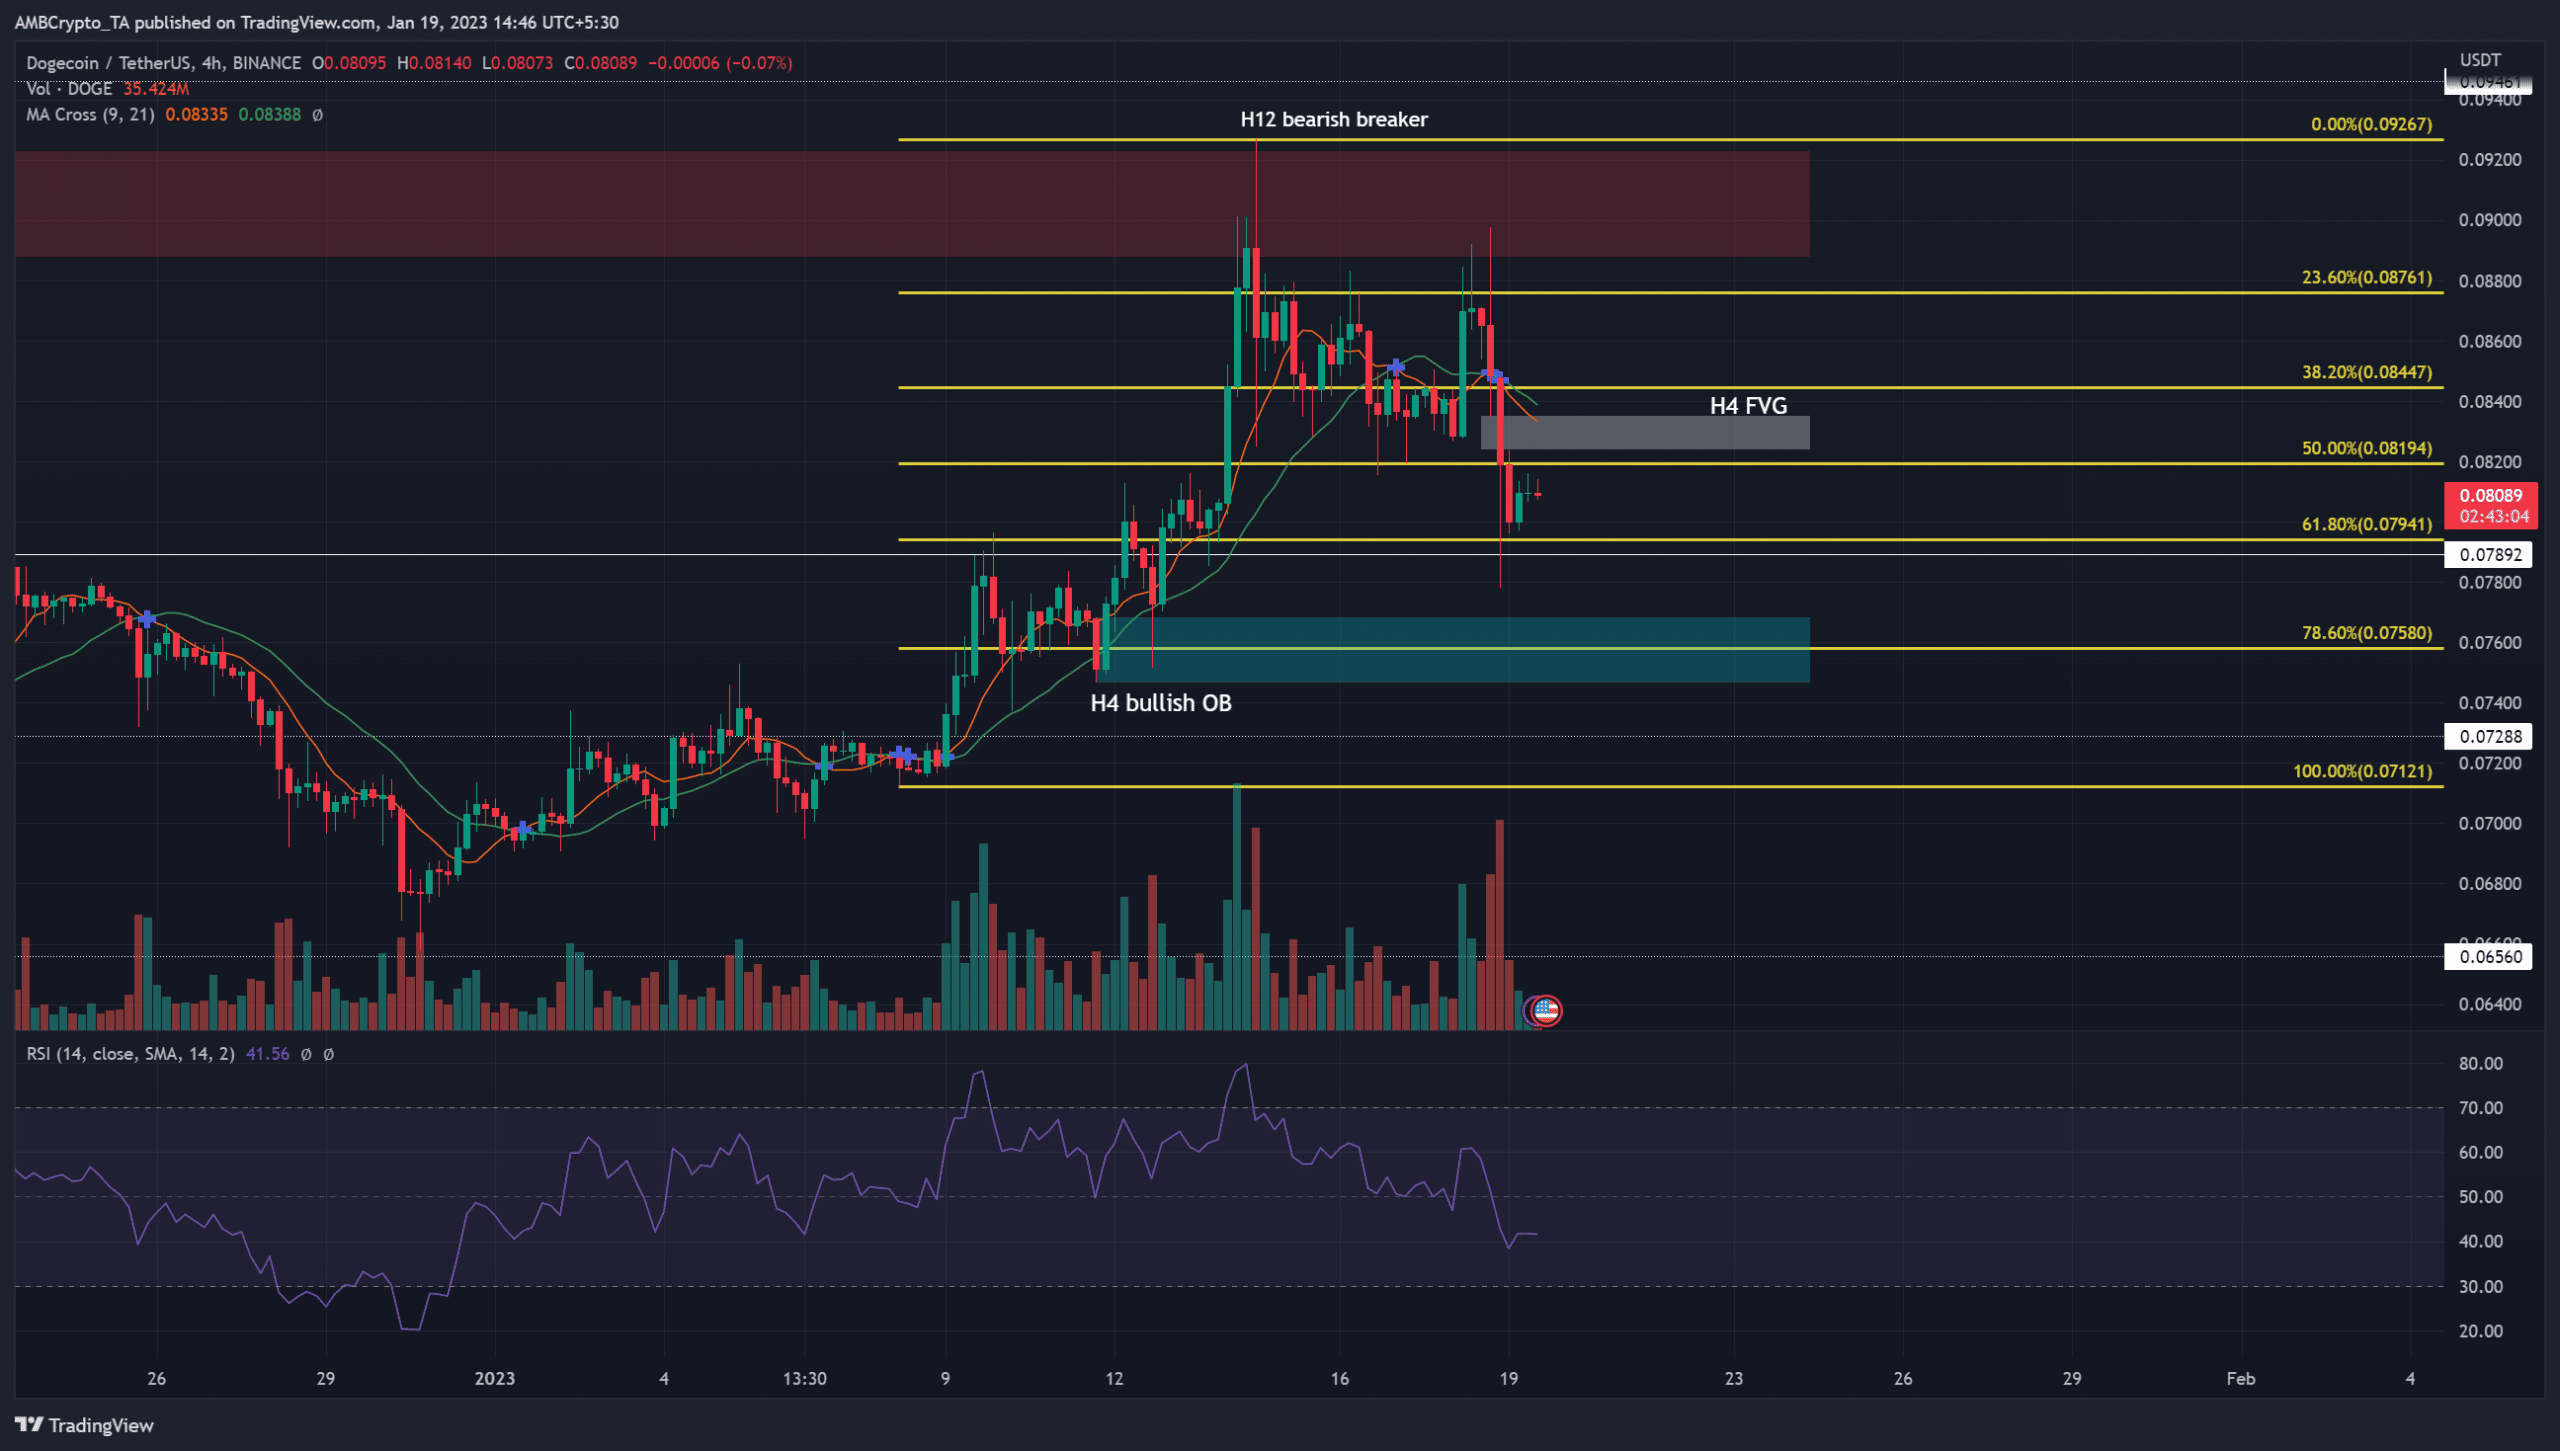
In red a bearish breaker from late November was highlighted. It was formerly a bullish breaker but was broken as support in mid-December. Based on the move from $0.071 to $0.092, a set of Fibonacci retracement levels (yellow) was plotted.
How much are 1, 10, or 100 DOGE worth today
The 78.6% retracement of the most recent, rapid move upward sat at $0.0758. This level was in the middle of a bullish order block on the 4-hour chart, highlighted in cyan. The $0.082-$0.083 area represented an inefficiency on the Dogecoin charts which was likely to be filled before another move downward.
The market structure was bearish as the most recent higher low was broken after the rejection at the 12-hour bearish breaker. To the south, a significant order block sat at $0.075. It was significant because the move immediately thereafter made a bullish market structure break on 12 January, and a move to $0.09 followed.
The 21 and 55-period moving averages showed bearish momentum as well. Hence a move downward was likely, and a revisit of the H4 bullish order block could provide a buying opportunity.
Open Interest witnesses a large decline to highlight bearish sentiment in recent hours of trading
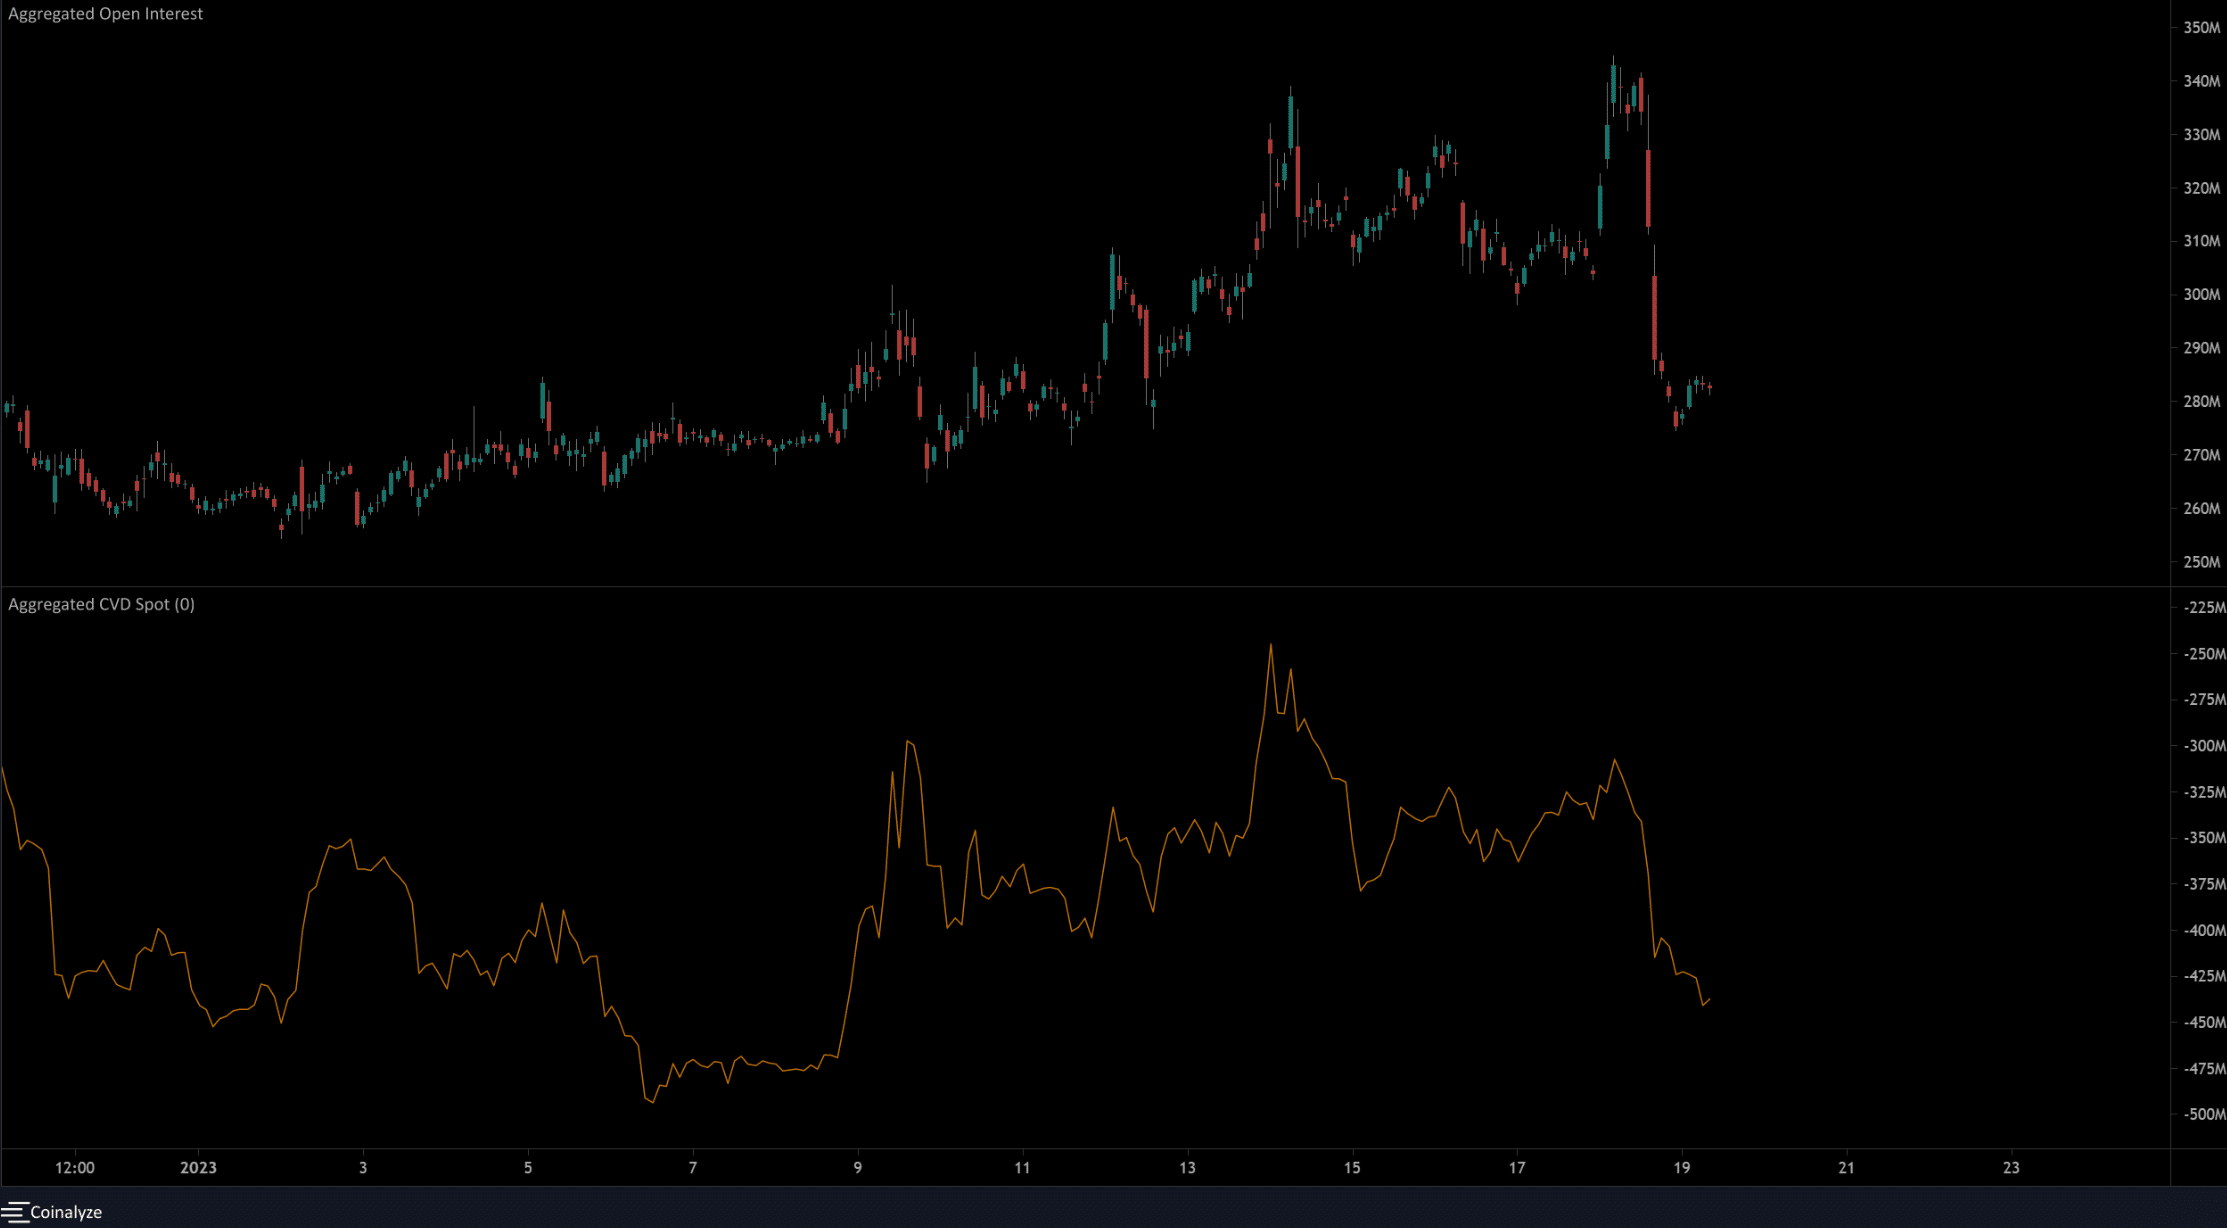
Since 6 January, the spot CVD has made a series of higher lows. This lasted until 18 January, when the metric broke beneath the most recent higher low. This suggested that at least for the time being the selling pressure was larger than the buying one.
The Open Interest was also rising alongside the price till 18 January. On that day, the short-term reversal of Bitcoin near the $21.6k mark and its drop to $20.4k meant Dogecoin also saw a pullback.
Hence, the large drop in OI meant that long positions were discouraged and the sentiment was bearish. This could change if the H4 order block sees an upward reaction from DOGE.