Dogecoin: Should traders really bank on a price reversal
Disclaimer: The findings of the following analysis are the sole opinions of the writer and should not be taken as investment advice
Buyers need to play catch up after Dogecoin suffered a symmetrical triangle breakdown on the charts. DOGE’s price seemed to return to a crucial area around $0.280 and the 12-hour 200-SMA (green) could be the missing catalyst for a much-needed upswing.
At the time of writing, Dogecoin was trading close to the aforementioned defense, down by 10% over the last 24 hours.
Dogecoin 12-hour chart
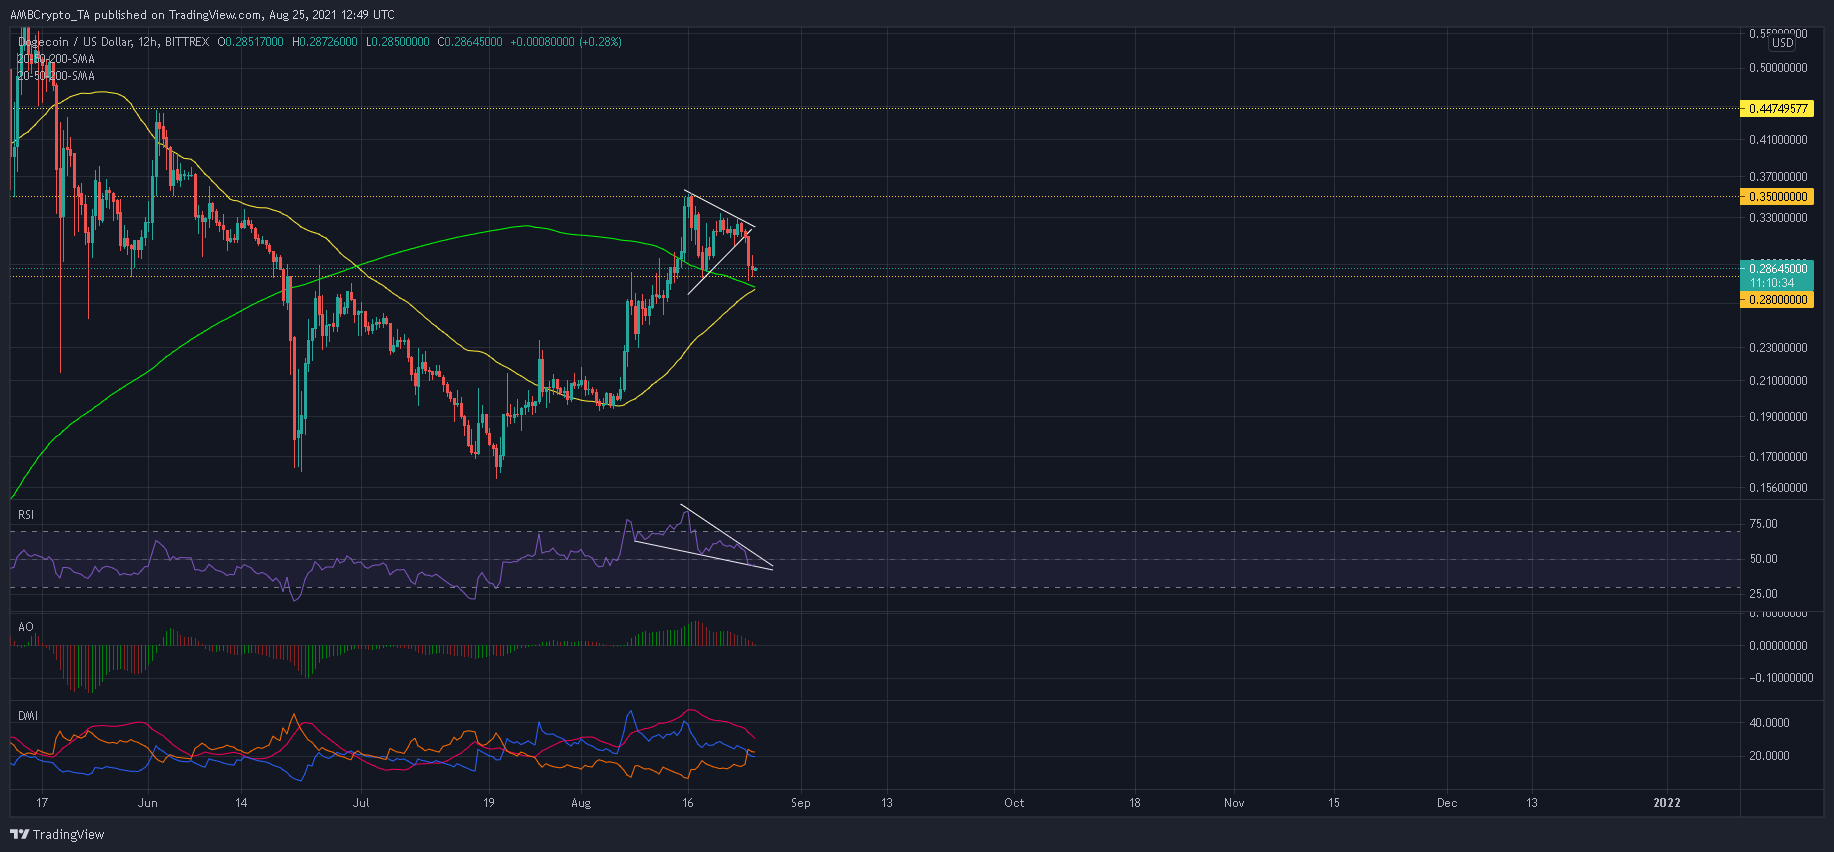
When the alt’s price broke decisively above $0.28 on 13 August, it seemed like DOGE was ready to continue its recovery towards its May highs. However, the breakout seemed like a missed opportunity as buyers failed to realize gains above $0.35. This invited short-sellers into the market.
More downside was seen when a symmetrical triangle was expected to play as a continuation pattern. Instead, it triggered a southbound breakdown on the charts. The price, at press time, was around $0.280 once again, a level that seemed to function as support.
The importance of this level cannot be understated as it has been in play since DOGE snapped new highs in early April. What worked in favor of the buyers was that the 12-hour 200-SMA (green) was close to crossing over above the 50-SMA (yellow). Such a development is expected to inject bullish sentiment and perhaps, trigger a market reversal.
Failing to do so could lead to severe bleeding in the coming days.
Reasoning
The Relative Strength Index formed a descending wedge – A pattern that usually sees a break to the upside. The index could trade close to 50 for an extended period before shooting north. Conversely, a move below 40 would negate this setup.
Meanwhile, the Awesome Oscillator looked shaky over the past week and threatened to move below the half-line for the first time in over three weeks. Further bearish signals flashed on the Directional Movement Index as the -DI crossed above the +DI, indicating a trend switch.
Conclusion
A majority of Dogecoin’s indicators presented chances of an extended decline, especially if the price closes below $0.280. However, there were chances of a price reversal as well.
This would be possible if buyers reignite momentum at the 12-hour 200-SMA (green) and the RSI breaks north from a falling wedge pattern. Although placing long bets on DOGE’s press time level does involve a high element of risk, the same would be an ideal buy entry for those banking on a reversal.