Dogecoin tests $0.17 support: Watch out for THESE levels next!
Dogecoin's Long/Short Ratio hit a one-week high, signaling renewed trader optimism. But will it be enough to fuel a rally?

- DOGE’s Long/Short ratio surged to 1.20, hinting at a possible bullish breakout.
- Price holds key support around $0.17, with targets near $0.22 if momentum builds.
Dogecoin [DOGE] may be gearing up for a directional shift, as the Long/Short Ratio has taken a bullish turn. This spike in trader sentiment and potential support levels forming on the charts could shape the next leg of DOGE’s journey.
Long/Short Ratio signals increased DOGE optimism
Over the last 24 hours, Dogecoin’s Long/Short Ratio jumped from 0.85 to 1.20, the highest level seen in the past week. This metric suggests that more traders place long bets on DOGE than shorts, indicating growing confidence in a potential upward move.
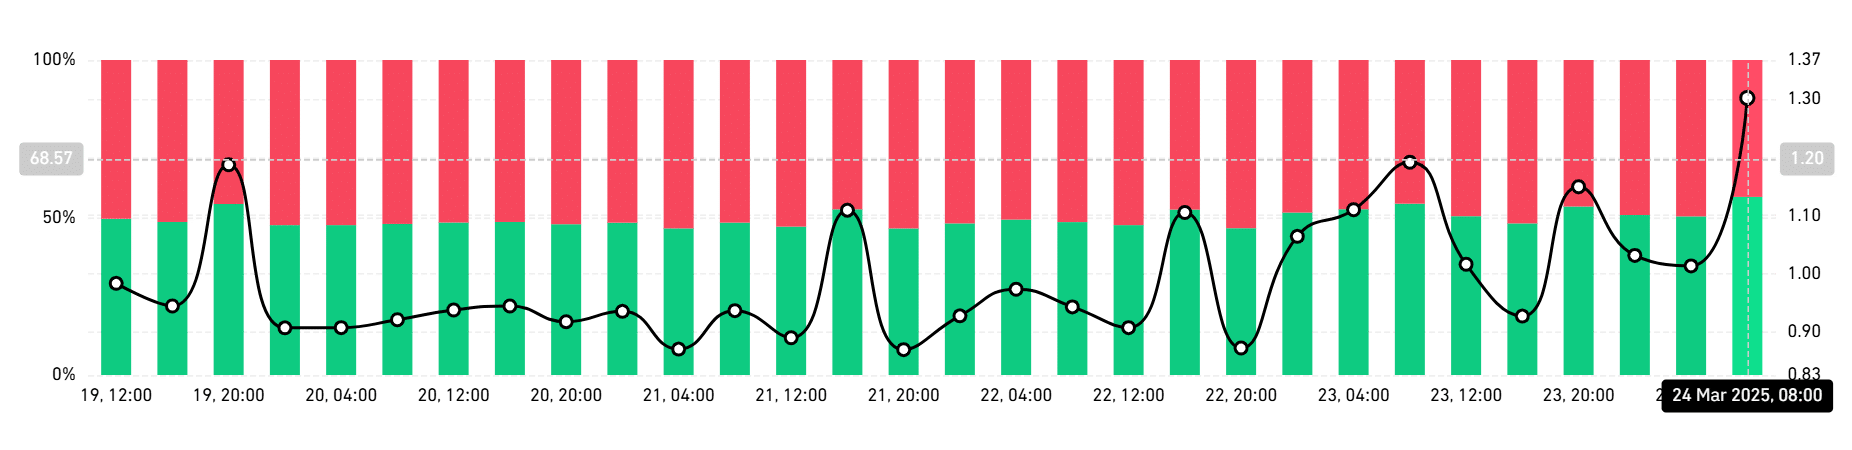
Historically, DOGE’s price tends to respond to such shifts in trader positioning, especially when the ratio crosses above the 1.00 threshold.
A rising Long/Short Ratio can be a sign of speculative appetite returning, which often precedes breakout attempts in memecoins like DOGE.
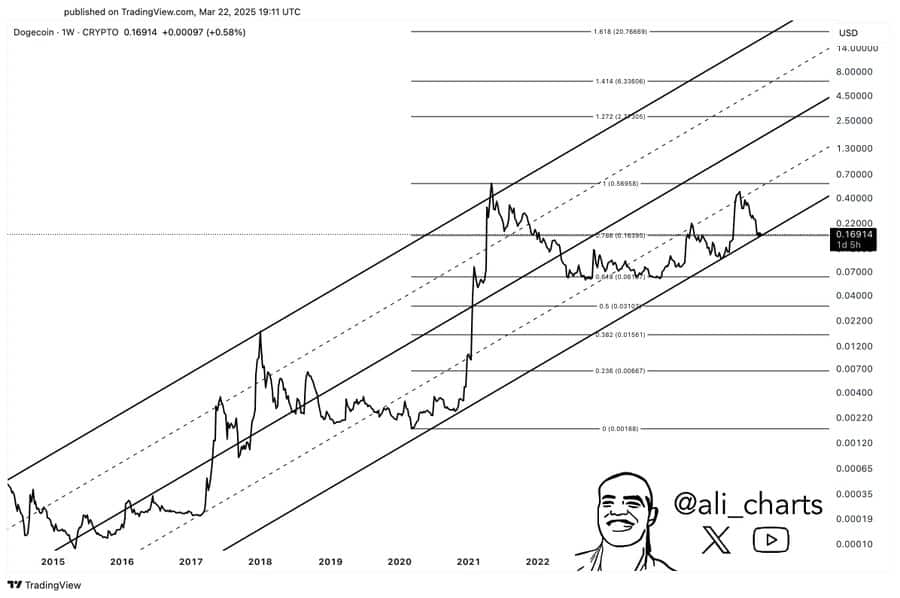
Dogecoin’s macro channel keeps bulls in play
Looking at the macrostructure from a weekly perspective, Dogecoin is trading within a long-term ascending channel. Based on Fibonacci extensions and trendline alignment, the asset held just above crucial diagonal support near the $0.17 region, a press time.
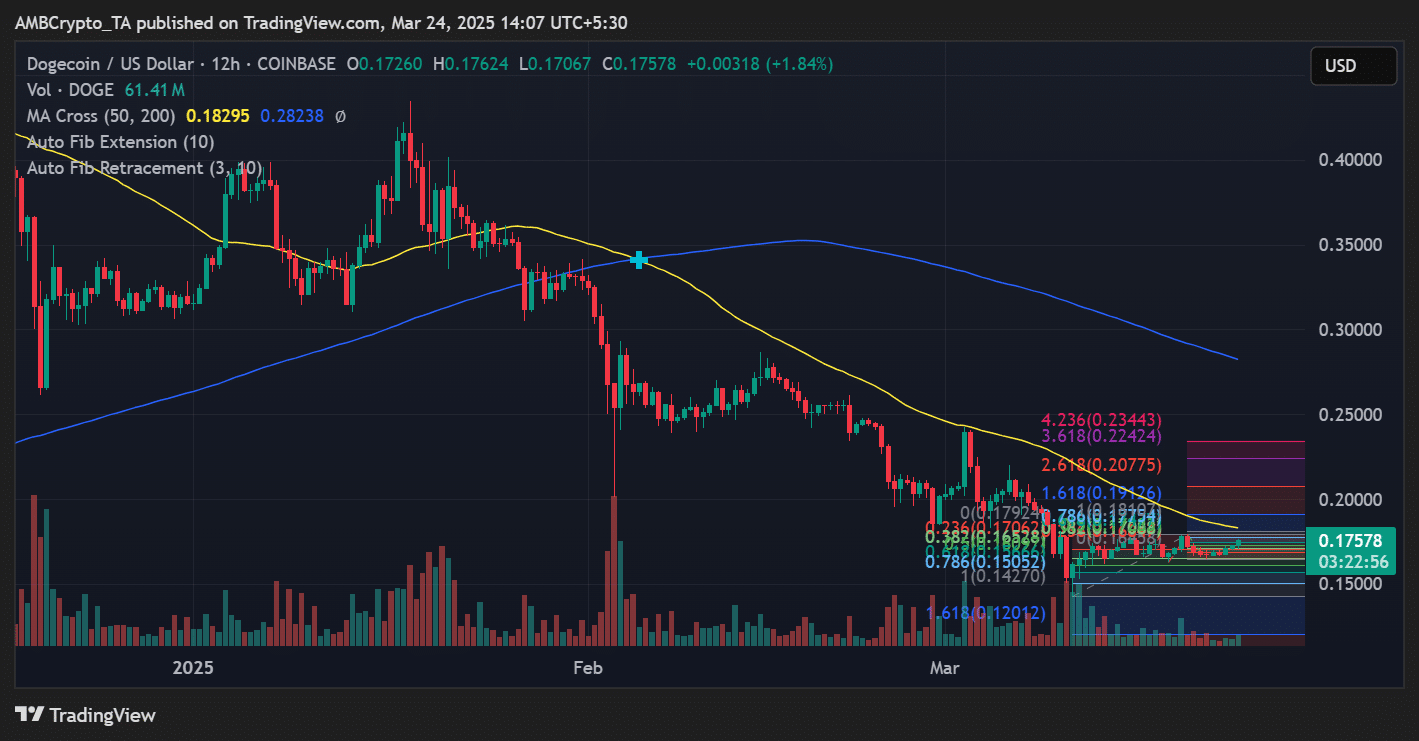
If DOGE sustains this channel and volume picks up, the next resistance zones lie between $0.22 and $0.23, aligned with the 2.618 and 3.618 Fib extension levels. A breach of these levels could open up a path toward $0.30 and beyond.
On the flip side, any failure to hold $0.16 could expose DOGE to a retest of $0.15, marked by the 0.786 Fib retracement on the 12-hour chart.
At the time of writing, the 50 EMA (yellow line) sat at $0.182, acting as near-term resistance.
DOGE technical indicators hint at…
From a momentum standpoint, DOGE’s RSI hovered around 50, reflecting a neutral setup. However, the steady sideways price action around $0.175 is accompanied by stable volume, often a prelude to a volatility expansion.
Moreover, the narrowing Bollinger Bands and flat-lining MACD suggested that Dogecoin could coil up for a larger move in the coming days, especially as traders take cues from rising long positions.
What next for DOGE
Dogecoin’s rising Long/Short Ratio shows increasing bullish sentiment among traders. As long as the price holds above key support levels and avoids a sharp correction, DOGE could test higher resistance levels in the short term.
However, with memecoin volatility still in play, traders should monitor sentiment and volume closely for confirmation.